

Mastering Market Dynamics: The Best Trend Reversal Indicators
Trend trading is the best and profitable forex trading strategy. Most forex traders using technical analysis will accept this undeniable fact. Similarly, identifying the trend reversal points and entering that market at these levels will reward traders with the maximum profit.
However, many traders fail to identify trend reversals and end up holding positions too long, only to see the profits vanish as the reversal happens. On other hand, late entry in a trend direction will deny the trader valuable pips.
In this article, we will discuss the best forex trend reversal MT4 indicators. These indicators not only help the traders to identify the trend reversals, but also to follow them. Some of these MetaTrader indicators are based on technical indicators like Stochastic, RSI, ADR, Pivots and momentum while others may use candlestick reversal patterns like Doji, Pin bar, and 5 bar reversals. We should note that we have analyzed the indicator data as of May 2023.
Table of Content
- Super Trend Indicator
- FXSSI Profit Ratio Indicator
- Buy Sell magic Indicator
- Half Trend Buy Sell Indicator
- RSI Divergence Indicator
- FXSSI Current Ratio
- Lucky Reversal Indicator
- Schaff Trend Cycle Indicator
- A-Gimat Reversal Indicator
- Swing ZZ ZigZag Indicator
- Power Trend Indicator
- FX Sniper Indicator
- Trend Magic Indicator
- Ultimate Trend Signals
- Forex Trend Scanner Indicator
- Wave Trend Oscillator Indicator
- Momentum Reversal Detector Indicator
- Trend Reversal Indicator
- Skdon Trend Indicator
- Forex Reversal Indicator
#1 Super Trend Indicator
 Downloads: 4.2k
Score: 4.5/5.0
Timeframes: M15-H4
Repaints: No
Alerts: No
Signal frequency: 1-3 per day
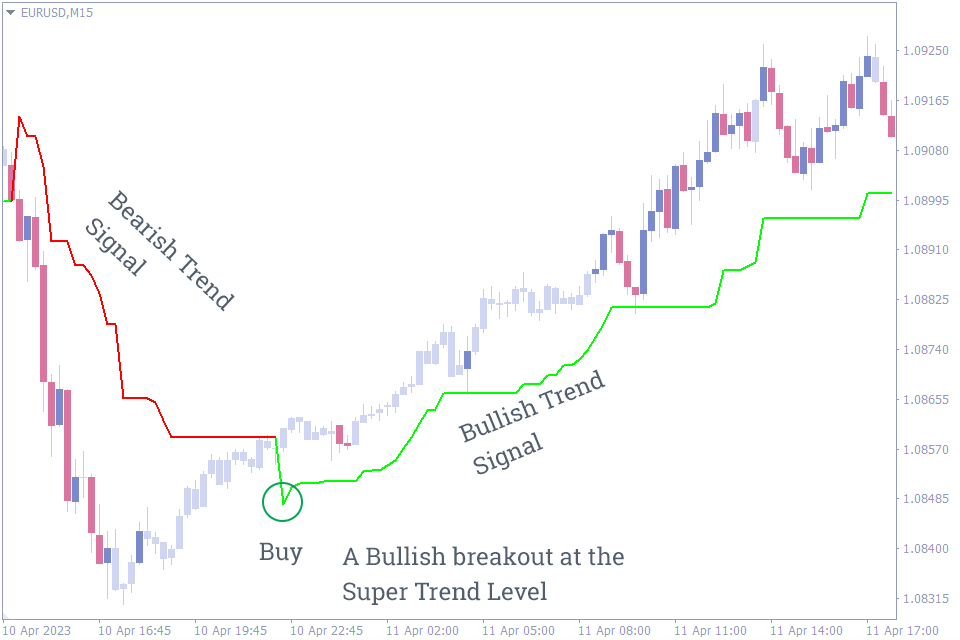
The Super Trend is a non-repaint trend indicator. The Supertrend indicator for MT4/5 provides bullish and bearish trend reversal visually. The indicator identifies the market direction based on the NPR periods and Multiplier and plots a single super trend line.
Trading signals are simple and straight forward, a change in the indicator line color indicates a trend reversal. Sometimes, the indicator level remains unchanged and plots a straight horizontal line. It happens when the price fails to break the high/low of its previous candle and closes as inside bars. So, whenever the indicator level stops ticking, we address the market as sidelined. Additionally, the super trend line acts as a support or resistance and is a best trend reversal indicator for intraday and works well in all time frames.
#2 FXSSI Profit Ratio Indicator
 Downloads: 11.7k
Score: 4.1/5.0
Timeframes: All (Preferably M15)
Repaints: No
Alerts: Yes
Signal frequency: 5+ Per Day
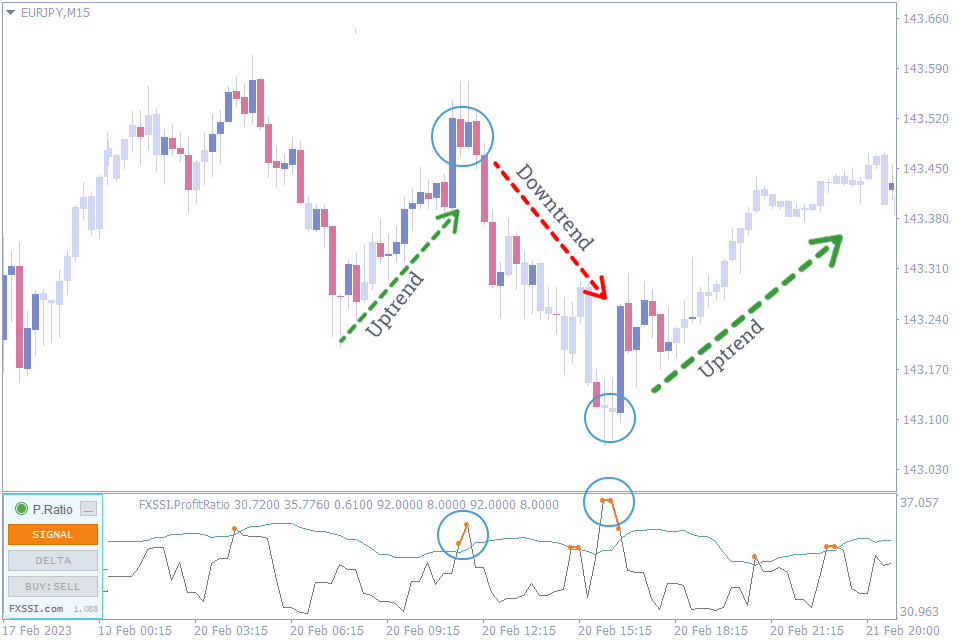
The FXSSI – Profit Ratio Indicator is the best market reversal indicator that provides trading signals based on the ratio between the winning and losing open trades. A clear analysis of the indicator shows trend reversals signals at market bottoms and tops. As a result, this accurate trend reversal indicator helps forex traders to enter the market in the beginning of the trend. Any signals higher than an average value signals a trend reversal. A dramatic increase in the value of the profit ratio indicator indicates a trend reversal.
In the above EURJPY M15 candlestick price chart initially the price was in an uptrend. However, the indicator values went well above the average line signaling a trend reversal. After the signal, the uptrend reversed to a downtrend. The indicator provided clear reversal signal at the top.
The second reversal signal occurred at the bottom while the price was in a downtrend. It is important to note that the reversal signal of the indicator was well in advance of the trend reversal. Here again the indicator values went higher than the average line providing a trend reversal signal.
The indicator also provides the profit ratio in terms of a histogram. If the green histogram bar has a value higher than 2%, it indicates a potential trend reversal. Another method of interpreting the signals is by using the Buy/ Sell mode, this displays the percentage of buyers and sellers are independent lines.
The buy / sell mode provides an interesting insight in the strength of the current market trend. If the buyer moves higher than 75% it indicates that the bullish trend is intact and vice versa for a bearish trend.
#3 Buy Sell magic Indicator
 Downloads: 25k
Score: 4.0/5.0
Timeframes: M15-H4
Repaints: No
Alerts: Yes
Signal frequency: 1-3 per day
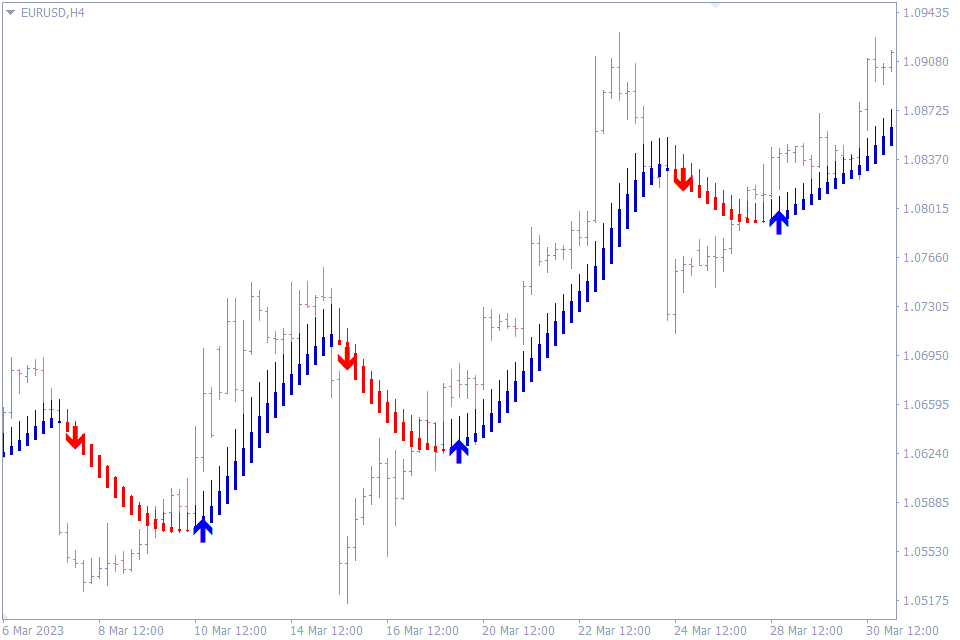
The buy sell magic indicator is a trend reversal indicator that works based on multiple technical calculations. This market reversal indicator plots buy and sell arrow trading signals on the price chart. This is a non repainting reversal indicator, so forex traders can place their trades with confidence.
Forex traders looking for price reversals should place the trades once the arrow trading signals appears on the chart. Moreover, the indicator plots the potential stop loss that helps traders to adjust the trading positions accordingly. Additionally, the indicator provides alerts via various channels to assist the traders.
#4 Half Trend Buy Sell Indicator
 Downloads: 21.6k
Score: 3.5/5.0
Timeframes: M15-H4
Repaints: No
Alerts: Yes
Signal frequency: 1-5 per day
The half trend buy sell indicator is an arrow trend reversal indicator. The indicator does not repaint and provides better trading signals than other moving average based trend reversal indicators. Since this indicator provides a stable trend direction, forex technical traders can use this indicator for additional confirmation of their technical analysis.
Additionally, forex traders can use this trend reversal indicator for intraday trading as it works well in all time frames above the M15. However, the signals become more frequent below the M15 price charts and may not be fruitful for scalping.
#5 RSI Divergence Indicator
 Downloads: 9.1k
Score: 5.0/5.0
Timeframes: M15-H4
Repaints: No
Alerts: Yes
Signal frequency: 3-7 per day
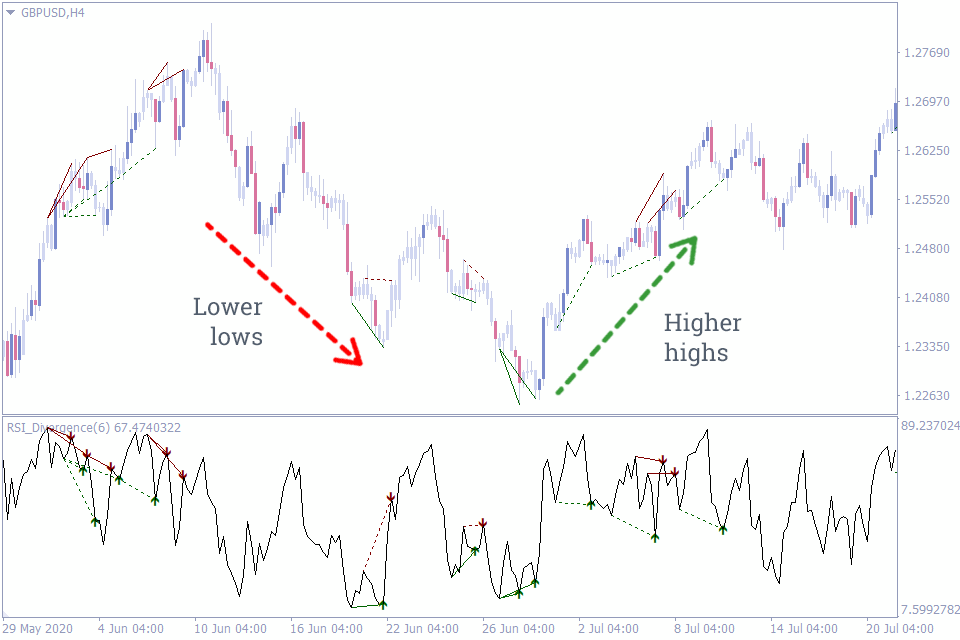
The trend reversal trading signals of the RSI Divergence indicator are based on the divergence of classic MT4 Relative strength index. As an oscillator the RSI is one of the best trend reversal indicators.
The indicator plots the divergence lines on both the chart and on the oscillator. Additionally it displays up and down arrows as trading signals. However, forex traders should only trade the trading signals that occur at oversold and overbought conditions, any trading signals in between the oversold and overbought levels should be ignored.
#6 FXSSI Current Ratio
 Downloads: 28.2k
Score: 3.9/5.0
Timeframes: All
Repaints: No
Alerts: Yes
Signal frequency: 1-2 per day
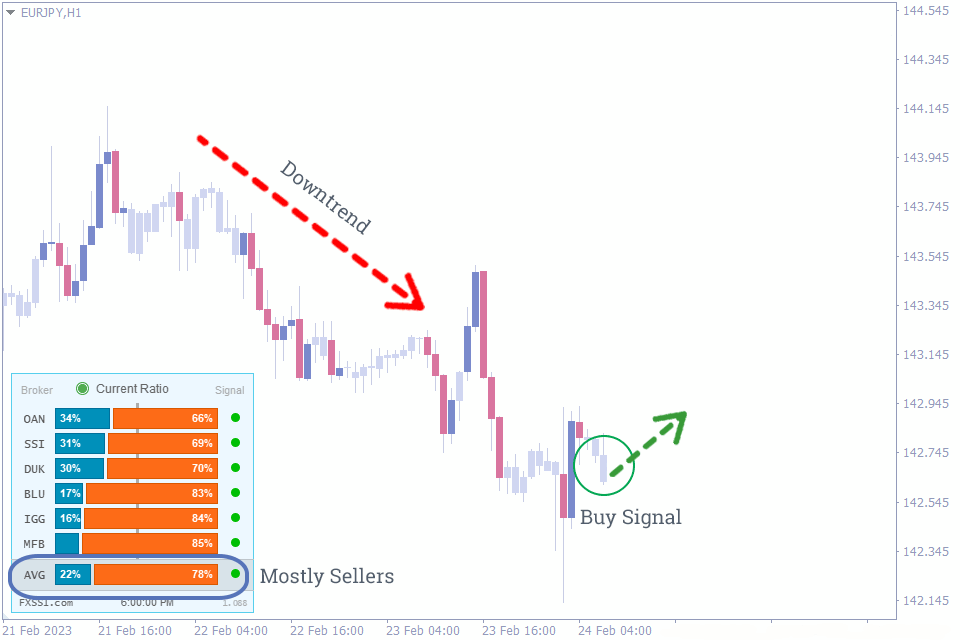
The FXSSI current ratio indicator is the best trend reversal indicator for MT4 that provides trading signals based on the ratio between the buyers and sellers in the market. This is also known as SSI – Speculative Sentiment Index. The data of the buyers and sellers ratio is based on the current open trades and is collected from several major brokerage companies.
The indicator works on the popular belief that 95-99% of retail forex traders lose money. So, trading in the opposite direction of the majority of traders can be profitable. As a result, the indicator provides a buy signal when most of the traders are sellers. Similarly, the FXSSI Current ratio indicator gives a sell signal of most of the open positions in the market are buyers.
In the above image of EURJPY, the FXSSI Current ratio indicator provided a BUY signal when most of the market participants were sellers and the price was in a downtrend. In fact 78% of the open positions were on the sell side as per the data provided by the FXSSI current ratio indicator.
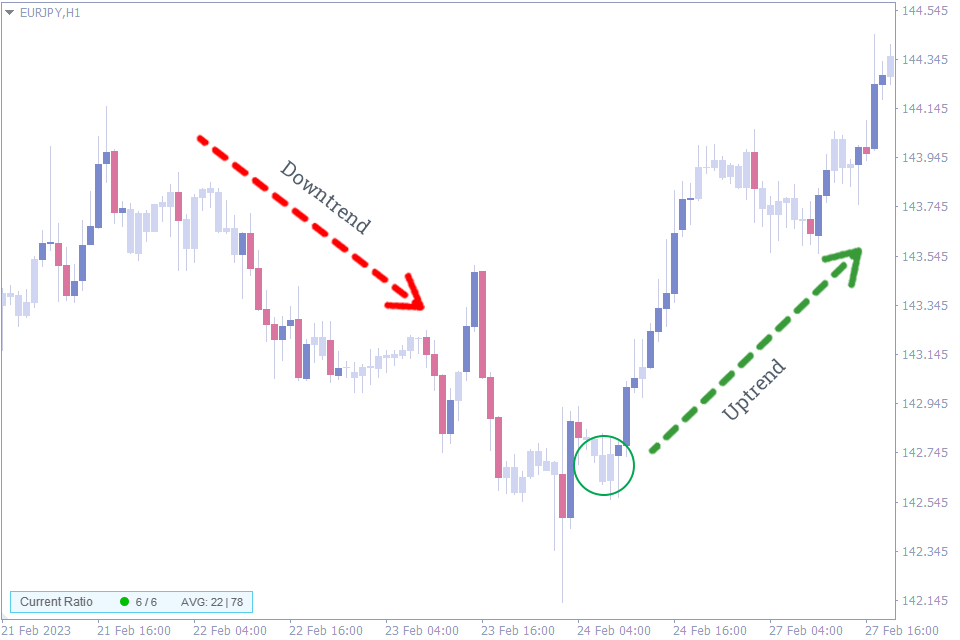 However, after the BUY signal the trend reversed to an uptrend and price moved higher significantly. This indicates that using the buyers and sellers FXSSI current ratio to identify trend reversal is most accurate and profitable method. Furthermore, it shows that trading against the majority of market is profitable.
Moreover, the indicator settings allow the trader to enable or disable the buyer and seller ratio from a brokerage or service. In addition traders can customize the formula to calculate the buyer and seller ratio. New and advanced forex traders can use this indicator with ease as it provides the buyers and sellers ratio visually.
#7 Lucky Reversal Indicator
 Downloads: 38.8k
Score: 4.23/5.0
Timeframes: M15-H4
Repaints: Yes
Alerts: No
Signal frequency: 3-7 per day
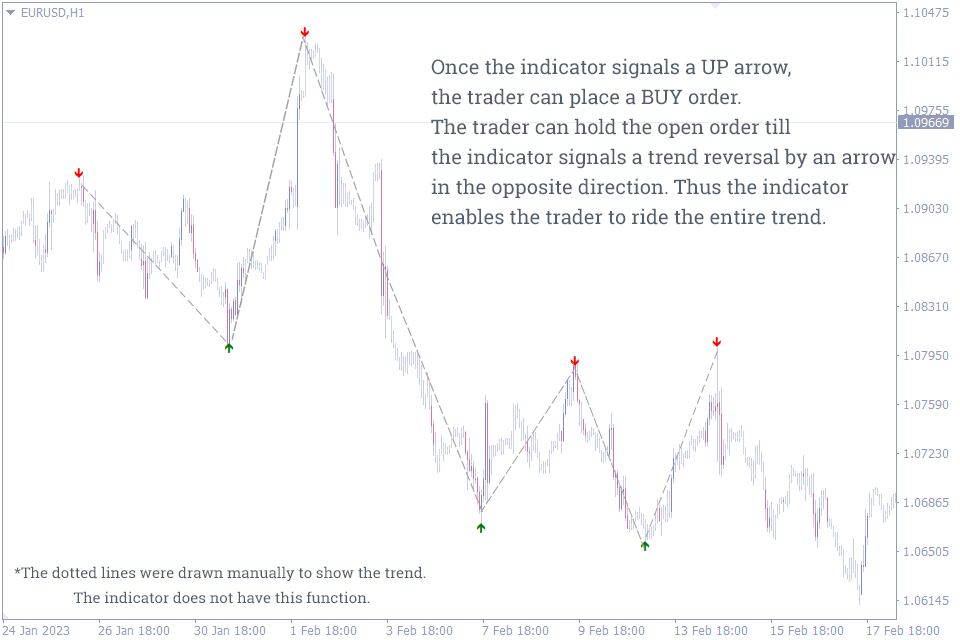
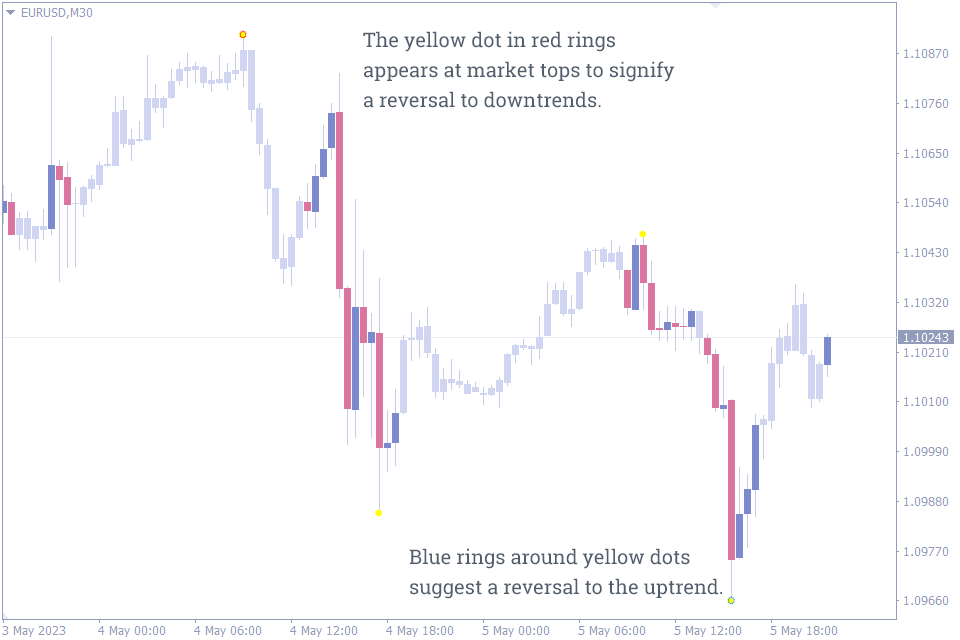
The Lucky reversal indicator provides arrow based trend reversal forex trading signals. As support and resistance levels provides a potential reversal point, this indicator uses. However, the indicator uses a combination of ZigZag and Fractals to identify the support and resistance. As a result, the indicator is a lagging indicator and repaints once the support or resistance is broken.
Forex traders should have some previous experience using lagging and repainting indicators to use this technical indicator. However, this indicator can be used in confluence with other indicators to identify the best trend reversal zone. Trading signals are easy to identify as the indicator displays an up and down arrow to signal the bullish or bearish trend reversal.
#8 Schaff Trend Cycle Indicator
 Downloads: 7k
Score: 3.5/5.0
Timeframes: M15-H4
Repaints: No
Alerts: No
Signal frequency: 2-4 per day
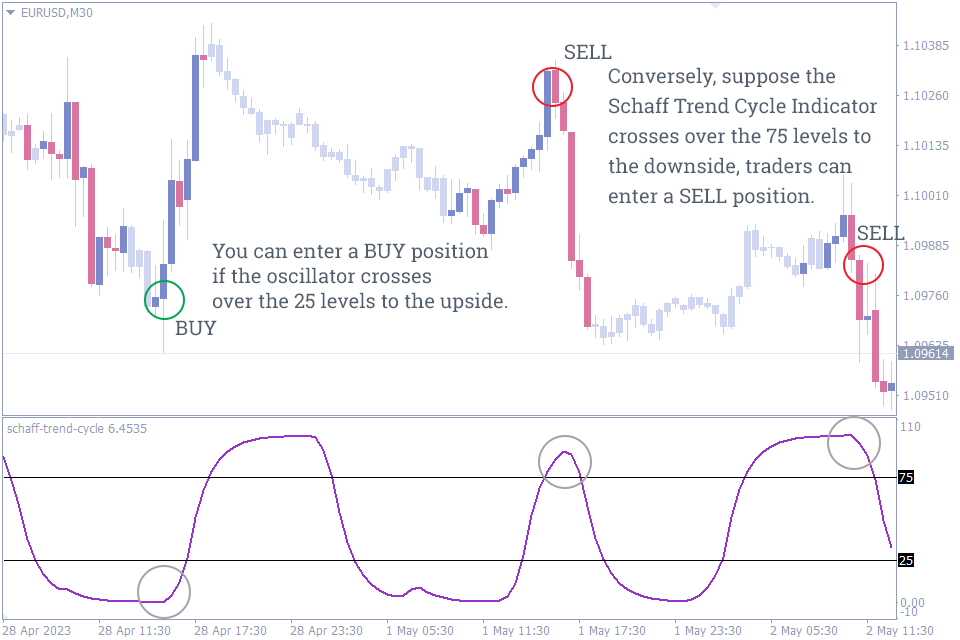
The Schaff trend cycle indicator is an overbought and oversold indicator that acts as a potential reversal zone indicator. This forex reversal indicator provides oversold and overbought signals in combination of Moving average convergence divergence – MACD and Stochastic indicator. As a result, the signals of this key reversal indicator is used in technical analysis.
As a reversal trading indicator, forex traders should enter the market with a buy trade at an oversold reversal zone. Similarly, traders should place a sell trade at an overbought zone. Though the trading strategy is similar to the MACD and Stochastic oscillators, the signals are better during many instances.
As the Schaff Trend Cycle Indicator is an oscillator, it shows the overbought and oversold levels. You can add overbought and oversold zones in the indicator settings for more accurate analysis.
#9 A-Gimat Reversal Indicator
 Downloads: 5.8k
Score: 4.83/5.0
Timeframes: M5-H4
Repaints: Yes
Alerts: No
Signal frequency: 5-10 per day
The A-Gimat reversal indicator uses the classic ZigZag MetaTrader indicator to provide the forex trend reversal trading signals. Many automated trading systems use the ZigZag indicator to identify the potential trend reversal levels. Forex traders should note that the ZigZag indicator repaints and may not be suitable to identify trading signals at lower chart time frames.
The indicator provides up and down arrow based trading signals. However, traders should use additional indicators or price action for confirmation of the trend reversal. The A-Gimat reversal indicator should not be used as a reversal scalping indicator.
#10 Swing ZZ ZigZag Indicator
 Downloads: 6.9k
Score: 5.0/5.0
Timeframes: M15-H4
Repaints: Yes
Alerts: No
Signal frequency: 1-4 per day
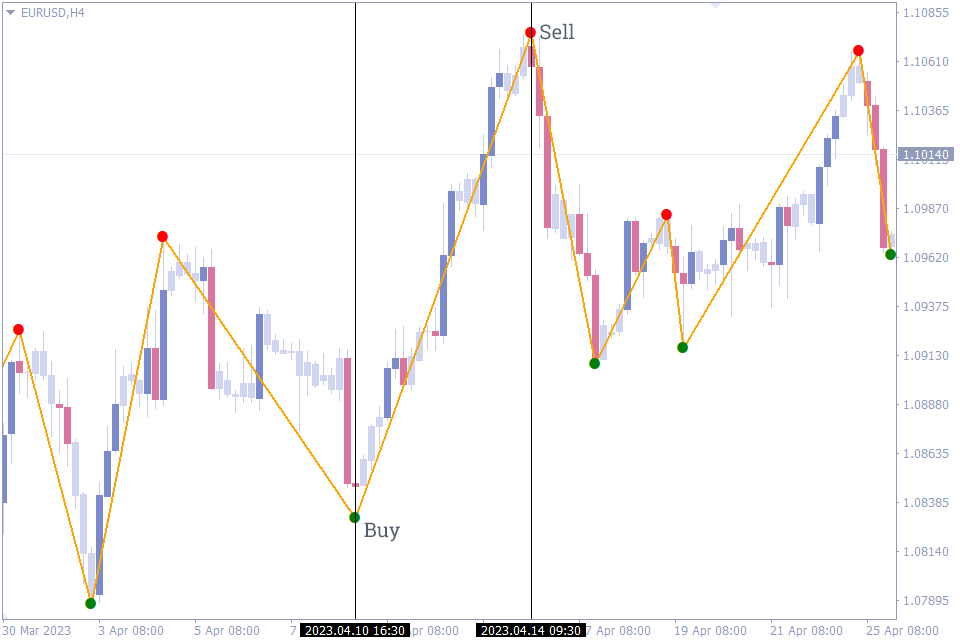
As the name suggests the Swing ZZ ZigZag indicator provides bullish and bearish trend reversal trading signals based on the classic ZigZag MT4 indicator. However, this swing trading indicator works well in the higher time frame charts and should be avoided as a forex reversal scalping indicator.
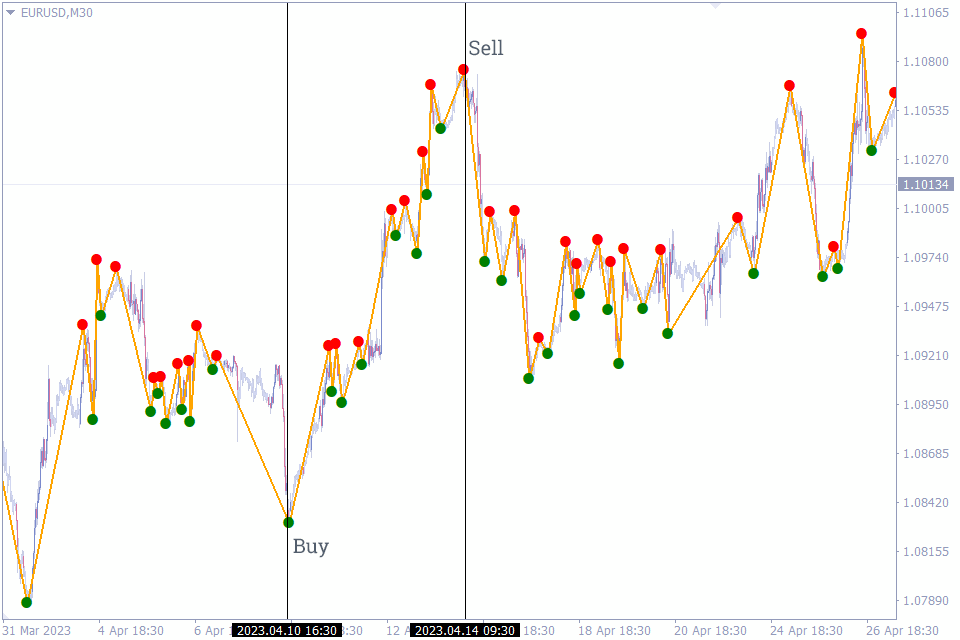 Forex traders can use this as multi time frame trading system. Once the major trend direction is identified, traders should enter the markets in a lower chart time frame in confluence with the higher time frame chart.
#11 Power Trend Indicator
 Downloads: 4.4k
Score: 5.0/5.0
Timeframes: M15-H4
Repaints: No
Alerts: No
Signal frequency: 1-4 per day
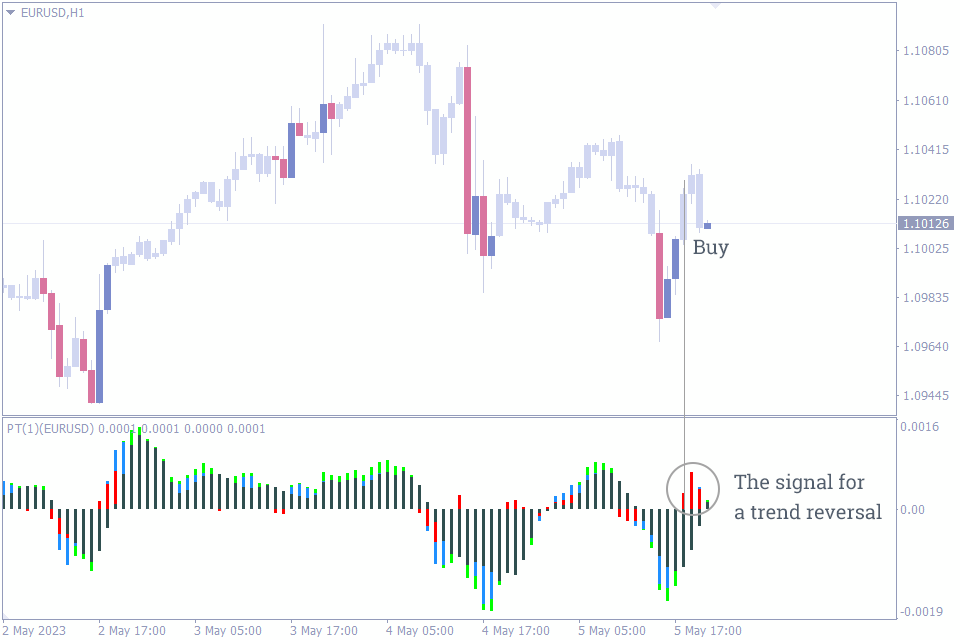
The Powertrend indicator is the best technical indicator for trend reversal and plots a multi color histogram. The histogram plays an important part in identifying the trend direction and strength. Furthermore, the histogram indicates changes in trend direction. A major advantage of this indicator is the ability to display the weakness of current trend strength which helps forex trader to anticipate trend reversal earlier.
Since this forex trend reversal indicator provide visual clues using various colors, it is helpful for new forex traders. When the histogram color changes to red, it indicates a potential trend reversal so forex traders can enter the market and buy or sell accordingly. Additionally, extreme trend conditions are in green color and indicate a potential pull back which could eventually lead to a trend reversal.
#12 FX Sniper Indicator
 Downloads: 4k
Score: 4.5/5.0
Timeframes: M30-H4
Repaints: No
Alerts: No
Signal frequency: 2-5 per day
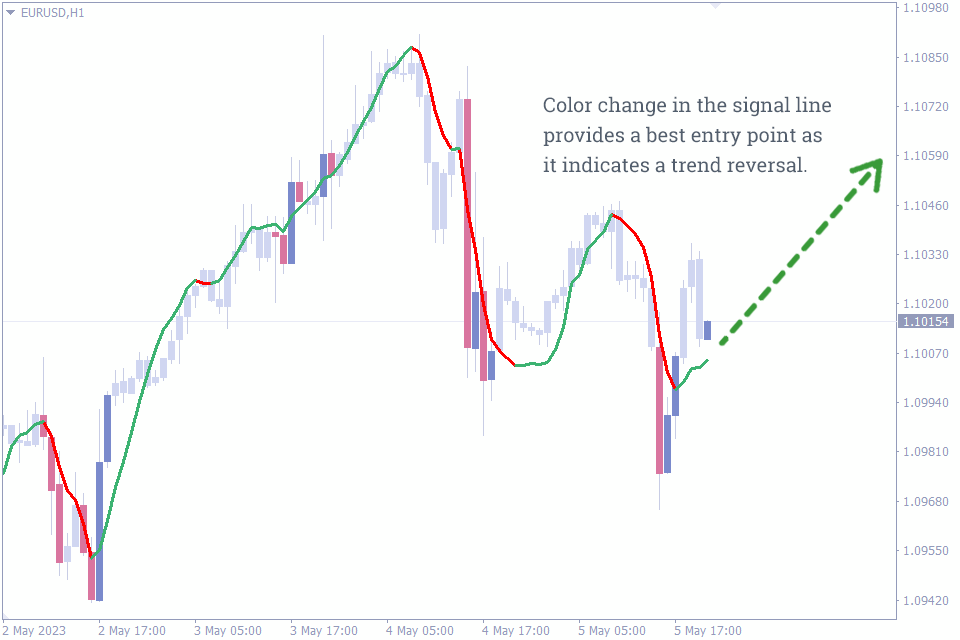
The FX Sniper indicator is an excellent trend following indicator which doubles down as a trend reversal indicator. The indicator plots a single signal line on the price chart with different color indicating bullish and bearish trend. So, a color change in the signal line provides a best entry point as it indicates a trend reversal.
The FX Sniper is a non repainting indicator and does not change after bar close, and does not provide any trading alerts. However, the indicator is not suitable for scalping and short term trades as the signal changes frequently.
#13 Trend Magic Indicator
 Downloads: 3.1k
Score: 5.0/5.0
Timeframes: M15-H4
Repaints: No
Alerts: No
Signal frequency: 1-3 per day
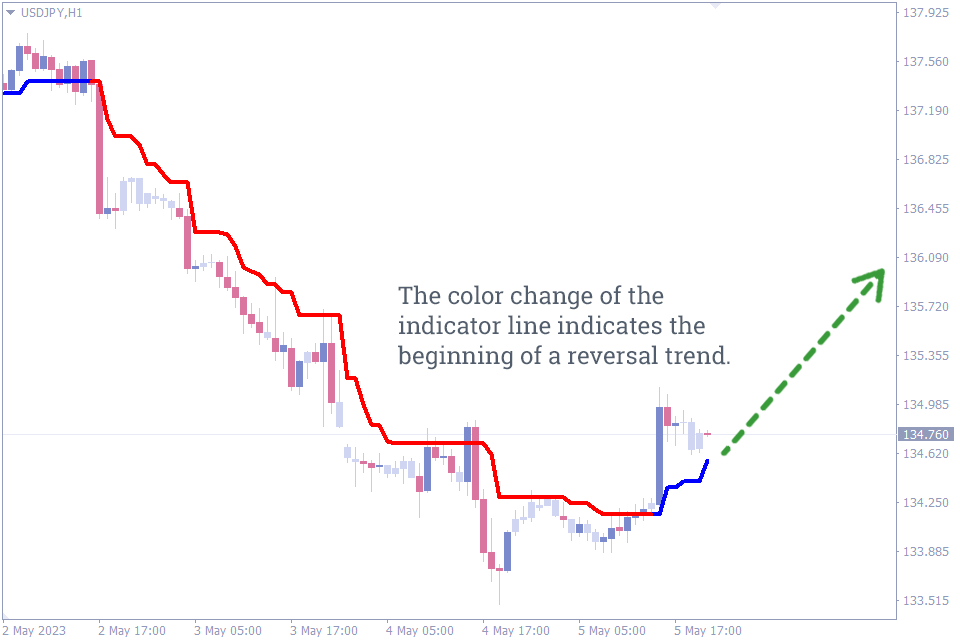
The Trend magic indicator provides trend reversal forex trading signals based on the classic CC indicator for MT4. Furthermore, it uses the ATR – Average True Range to refine the trading signals and is the best non repainting reversal indicator. The color change of the indicator line from blue to red indicates the beginning of a bearish trend, while the opposite signals the start of a bullish trend.
The trend magic indicator provides choppy trading signals in lower time frames. However, for more accurate trend reversal signals forex technical traders should use the indicator in a chart time frame higher than the 30 minutes.
#14 Ultimate Trend Signals
 Downloads: 3.2k
Score: 4.88/5.0
Timeframes: M5-H4
Repaints: No
Alerts: Yes
Signal frequency: 3-8 per day
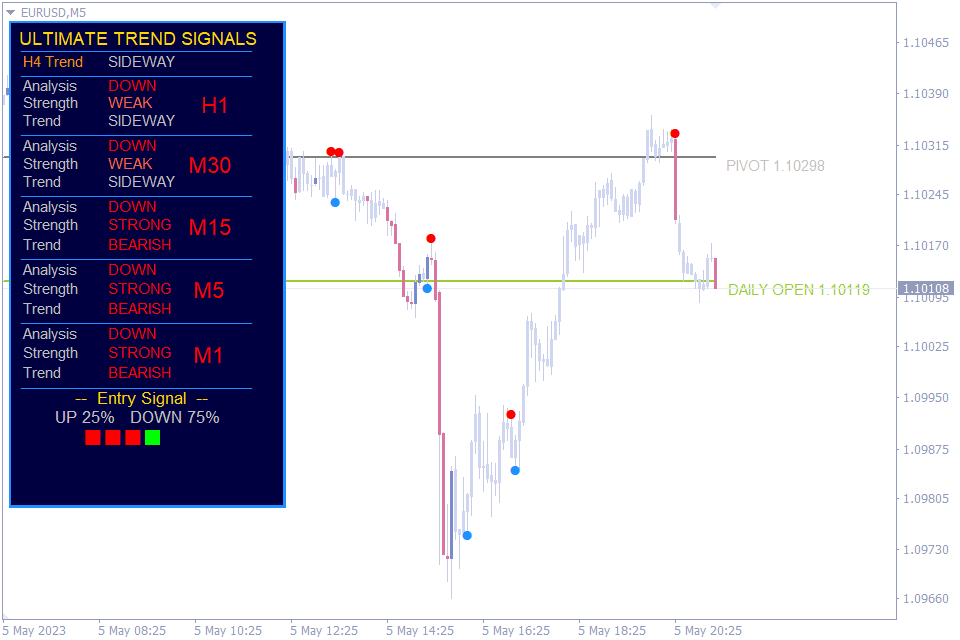
The above chart shows the Ultimate trend signals indicator in action. The indicator shows the Bullish arrow signals as BLUE and Bearish arrow trading signals in RED. Moreover, it displays the daily pivot value and the daily open price on the price charts.
The Ultimate trend signals is a trend reversal dot indicator that provides signals based on the ADX, Pivot and the daily open price. Furthermore, the indicator displays a multi time frame dashboard that indicates trend direction, strength for 5 different time frames. As a result, this indicator is very effective for multi time frame trading strategies.
The indicator displays a trade recommendation based on the trend strength of multiple time frames. Since the dashboard displays the trend strength of M1, M5 time frames, this forex reversal scalping indicator is effective in lower time frames. However, it is highly recommended to trade in confluence with the direction of higher time frame.
#15 Forex Trend Scanner Indicator
 Downloads: 2.3k
Score: 3.5/5.0
Timeframes: M15-H4
Repaints: No
Alerts: No
Signal frequency: 3-6 per day
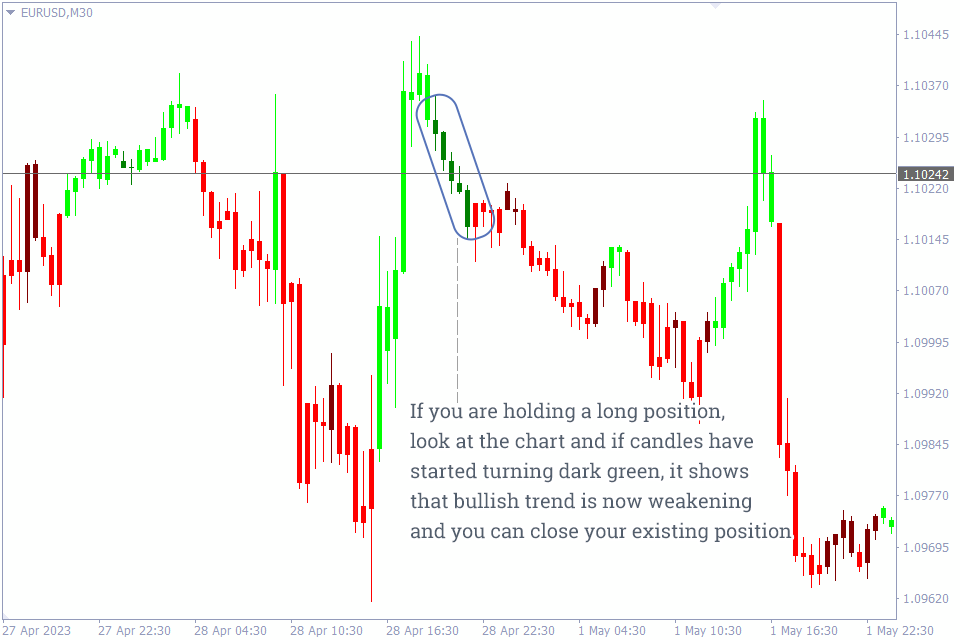
The Forex trend is a reversal candlestick pattern indicator. However, this indicator does not scan the charts for standard candlestick reversal patterns like to Doji or pin bar. Instead, the indicator plots the candlestick with 4 different colors based on the trend strength. The Lime green color indicates a bullish trend, while the dark green color shows the weakening of bullish trend.
Similarly, a red candlestick shows bearish trend while the maroon candlestick shows a weakening bearish trend. So, forex traders can understand the current trend and also anticipate a potential trend reversal based on the weakening of the current trend. In summary, this indicator is an alternate version of candlestick reversal indicator.
#16 Wave Trend Oscillator Indicator
 Downloads: 2.1k
Score: 5.0/5.0
Timeframes: M5-H4
Repaints: No
Alerts: No
Signal frequency: 3-6 per day
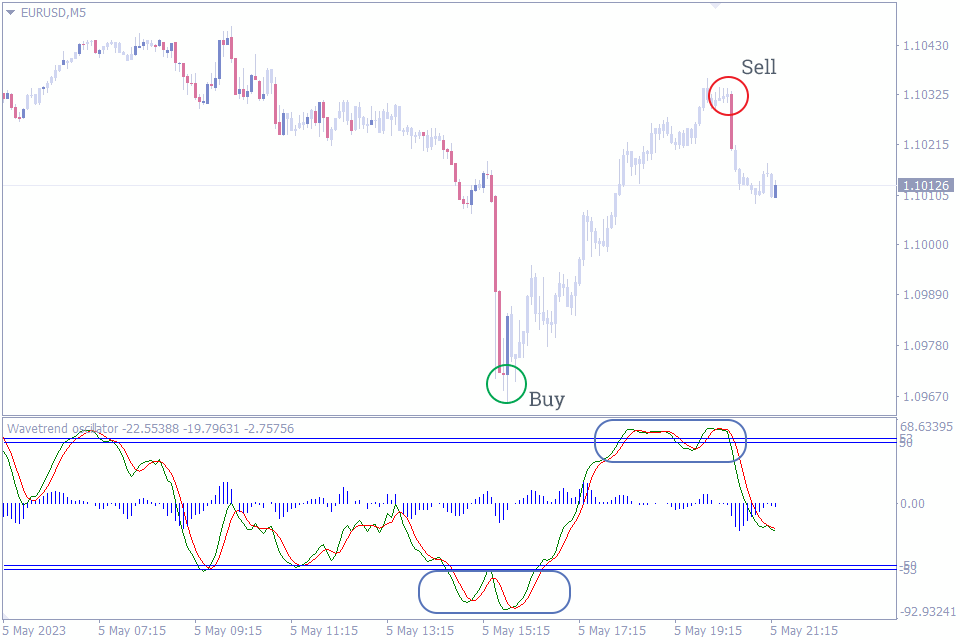
The Wave trend oscillator indicator for MT4 is provides trend reversal signals based on oversold and overbought conditions. Furthermore, the convergence and divergence of the oscillator can help forex traders anticipate trend reversals. Since, the indicator applies momentum to identify the extreme market conditions the signals are pretty reliable.
This momentum reversal indicator is a non repainting indicator and is reliable as the classic RSI and MACD MetaTrader indicators. Furthermore, this indicator works well in all chart time frames and comes handy for scalping too. Moreover, forex traders can adjust the sensitivity of the indicator to smoothen the trading signals.
#17 Momentum Reversal Detector Indicator
 Downloads: 1.8k
Score: 5.0/5.0
Timeframes: M15-H4
Repaints: No
Alerts: No
Signal frequency: 3-6 per day
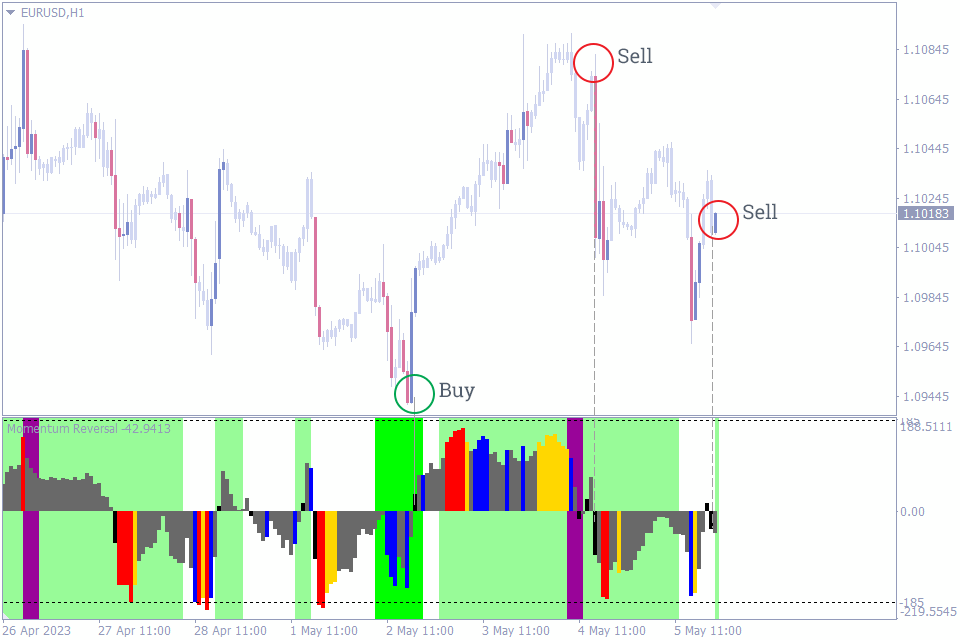
The momentum reversal detector indicator detects the trend direction based on momentum. When the momentum changes the potential of trend change is much higher. So, this indicator scans momentum changes and plots them as a histogram. The black bar in the histogram signals a trend change. If the black bar is upwards above the zero line of the histogram it indicates a buy signal.
Similarly, if the black bar is downwards below the zero line of the histogram it is a sell signal. Additionally, if the indicator identifies a divergence in higher time frames it changes the background color of the histogram of the lower time frame charts. This helps the technical forex traders to identify them in the lower time frame charts and trade accordingly.
#18 Trend Reversal Indicator
 Downloads: 1.6k
Score: 4.5/5.0
Timeframes: M5-H4
Repaints: No
Alerts: No
Signal frequency: 2-5 per day
The trend reversal indicator for MT4 provides forex trading signals based on the crossover of the slow and fast EMA – Exponential moving averages. Generally, moving average crossovers find their way in most trend reversal trading strategies. Since the moving averages calculate the market trend and follow the closely, they act as excellent trend reversal indicators.
Forex traders can change the EMA periods, applied price and signal period to adjust the trading signals to suit their trading style. As a result, this trend reversal indicator can work with any type of forex trading system including scalping. However, traders should take note that moving averages have a certain degree of lagging and may produce delayed trading signals.
#19 Skdon Trend Indicator
 Downloads: 1.2k
Score: 5.0/5.0
Timeframes: M5-H4
Repaints: No
Alerts: No
Signal frequency: 2-5 per day
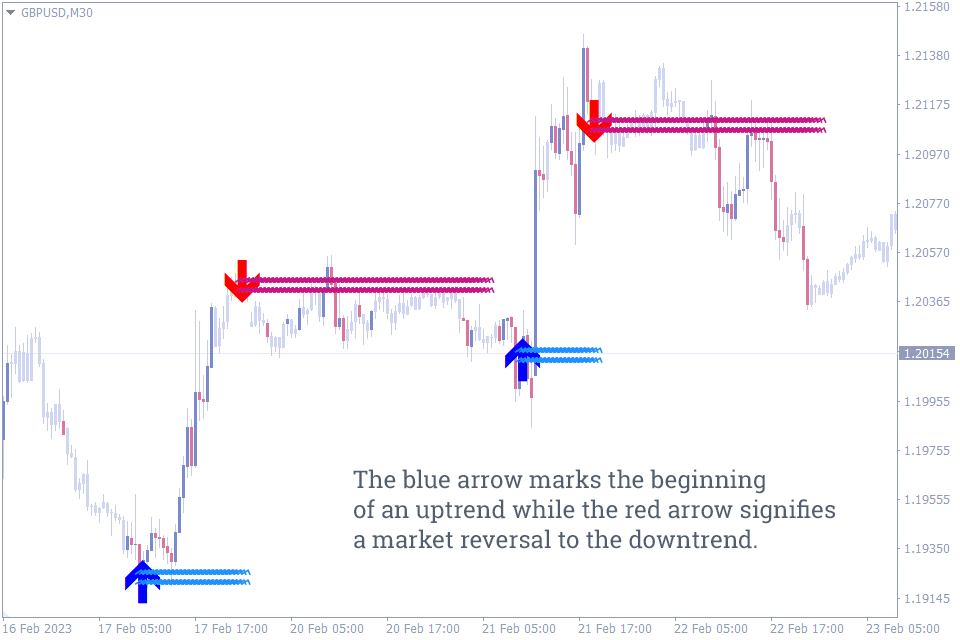
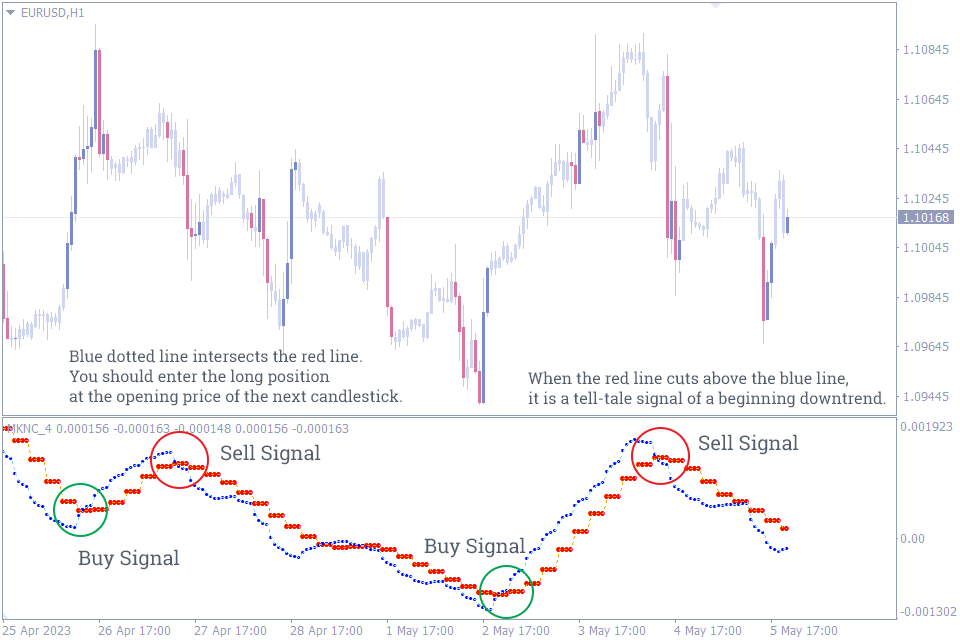
The Skdon trend indicator provides trend reversal buy and sell arrow trading signals based on the crossover of the price and moving average. The blue arrow indicates a bullish trend change, so forex traders should enter the market with a buy position with a stop loss below the previous swing low.
Similarly, a red down arrow shows a bearish trend change, so traders should place a sell trade with a stop loss above the previous swing high. The best strategy to book profits it to exit at an opposite arrow trading signal. Though the indicator works well in all chart time frames, it is highly recommended to apply them in a higher time fame chart to identify the market direction.
#20 Forex Reversal Indicator
 Downloads: 11k
Score: 4.67/5.0
Timeframes: M5-H4
Repaints: Yes
Alerts: Yes
Signal frequency: 4-8 per day
Forex trend reversal indicator uses the ZigZag indicator to provide trend reversal signals. Additionally, traders can customize the indicator input settings to receive both minor and major signals.
As the indicator is based on ZigZag it repaints, so traders should use additional indicators for confirmation of signals. Moreover, the indicator works well in all time frames.
Conclusion
In the above article we have discussed in detail the important traits of the indicators that help forex traders to identify the trend reversals. It’s imperative that entering the market at the beginning of the price trend provides a profitable trade and eventually every trader aims for it.
In summary, though there are multiple indicators, the FXSSI profit ratio and FXSSI current ratio indicators help traders identify trend reversals most accurately and provide trading signals much early. Additionally, by employing trading techniques that promote trading against the market participants these two indicators open numerous profitable trading opportunities.


Leave a Reply