
Best Fibonacci Indicators for MT4
Technical analysis is the key to profitable forex trading. In fact most forex traders use technical analysis together with fundamental analysis. The humble price chart with its ups and downs may seem easy to understand and to identify the bullish or bearish market sentiment.
However, traders will agree its complex to tame the charts and identify profitable buy and sell trading opportunities. In this article, we will look into an amazing mathematical ratio found by Fibonacci.
Traders apply the Fibonacci levels to identify market retracement levels. Once the retracement wave is completed, the price normally resumes in the initial trend direction. Retracement levels provide an excellent opportunity to enter the market
The golden ratios of Fibonacci can be applied to forex price charts in multiple methods. Though Fibonacci levels can be used as raw data, some indicators try to get additional information and clarity by combining Fibonacci levels with other math functions.
MT4 platform has many types of the Fibonacci levels in built within the trading platform. However, we will discuss indicators that help forex traders to identify the market in a different perspective. That said, the top most application of the Fibonacci levels is the identification of support and resistance besides providing the best entry and exit points.
Here in this article we will discuss some of the top most Fibonacci based MetaTrader indicators.
Fibonacci Indicators for MT4
- Fibonacci Retracement Indicator
- Auto Fibonacci Retracement Indicator
- Fibonacci Pivots Indicator
- Fibonacci Based Moving Average Indicator
- Fibonacci Pivot Lines Indicator
- Auto Fibonacci Fan Indicator
- Fibo Projection Indicator
- KG Fibonacci MA Indicator
- Fibo Label Indicator
Fibonacci Retracement Indicator
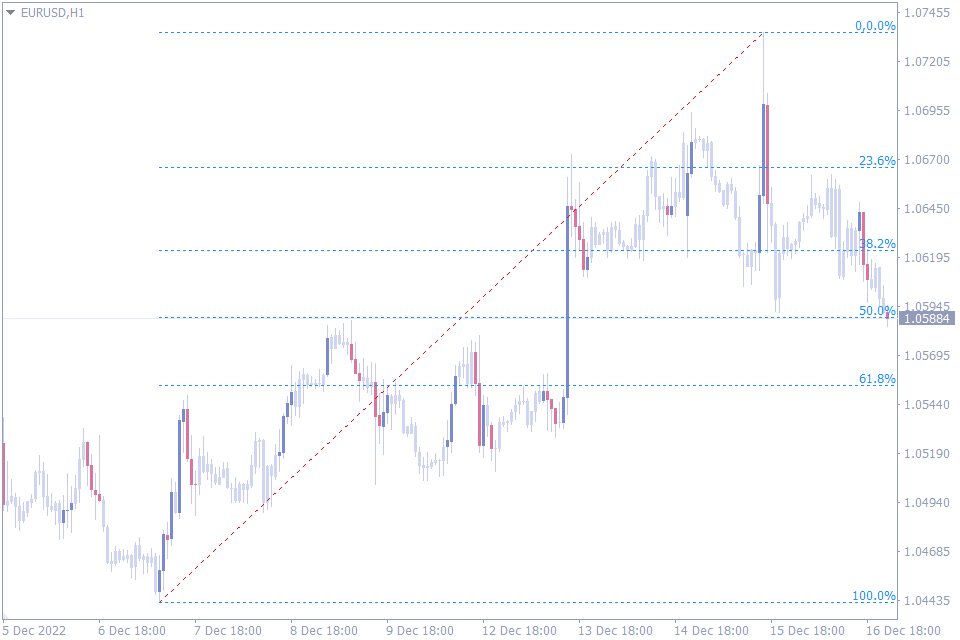
Let’s start with the first indicator in the list of top Fibonacci indicators. The Fibonacci Retracement indicator automatically plots the Fibonacci retracement levels. These levels are 100%, 61.8%, 50%, 38.2%, 23.6% and of the trend wave.
Since price moves in trend waves and then provides a pullback or retracement. Forex trades wait for prices to complete the retracement phase. Traders anticipate price reversals at these levels as they act a support and resistance levels.
However the difficult part is to identify the price level at which the retracement will be over. The Fibonacci retracement indicator automatically plots the retracement levels corresponding to the trend move. Thus it helps traders to avoid guess and to anticipate price reversals at certain levels.
The best trading strategy using this indicator is to enter the markets in the direction of the primary trend. Now that we know at which price levels we should look to enter the markets, let’s look at this indicator to identify the best stop loss and take profit levels.
Simply put the nearest Fibonacci levels acts as the support and resistance. So, they act as potential stop loss and take profit level.
Another important aspect of the indicator is that once we plot the Fibonacci indicator it is visible in all time frames. So, traders can visually identify same Fibo levels in various time frames to further refine the entry point.
Auto Fibonacci Retracement Indicator
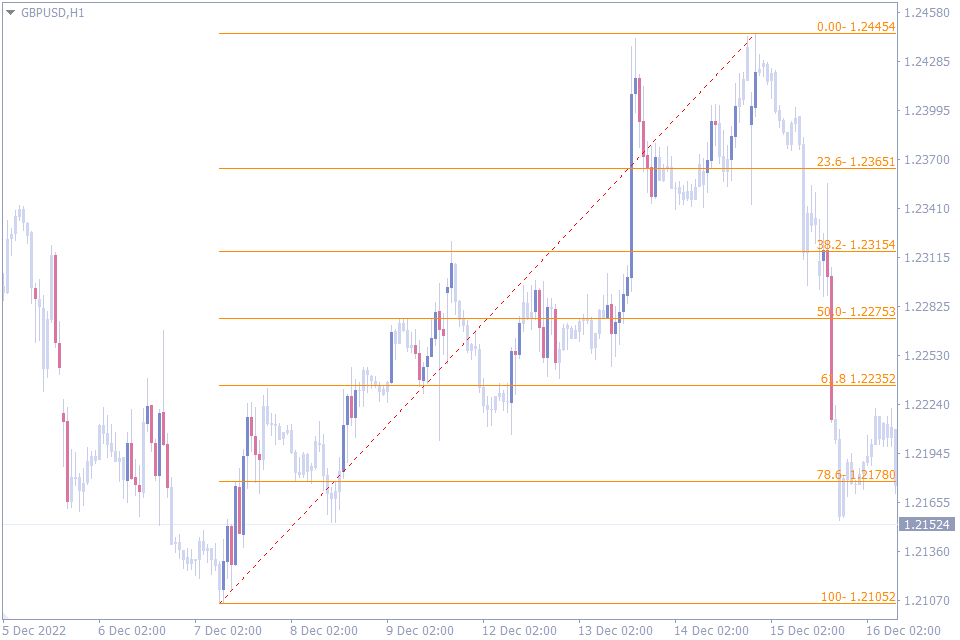
We will now discuss the second indicator in this list of best Fibonacci indicators. The Auto Fibonacci Retracement indicator automatically identifies the market top and bottom and plots the Fibo levels accordingly.
The most important step in Fibonacci calculation is the identification of the top and a bottom. Once they are identified the indicator does the work. However, many traders do not identify the market top and bottom correctly.
Incorrect identification of the top and bottom makes the indicator calculate and plot incorrect Fibo levels. It’s more than a convenience but an essential step. So, using the Auto Fibonacci Retracement indicator helps the trader to automatically identify the top and bottom and plot them.
Based on the automatic identification forex traders can now focus on price action at the retracement levels. Once the price action confirms reversal at these support and resistance at the Fibo retracement levels, forex traders can enter the market.
Similarly, the indicator plots all the Fibo levels and enables the trader to place the best stop loss and take profit points.
In effect, this Auto Fibonacci retracement indicator automates the process of identifying the best top and bottom to draw the Fibonacci tool.
Fibonacci Pivots Indicator
Let’s now move on to the third indicator in the list of best Fibonacci indicators. The Fibonacci Pivots Indicator is an amazing combination of Pivots and Fibonacci levels. As a result, the indicator provides best support and resistance levels.
Pivot points are an effective tool in identifying the market trend. The pivot points are calculated based on the previous day’s price data. Open, High, Low and close prices of the previous day essentially form the basis of pivot calculation.
If the price is above the Pivot point, the market is effectively bullish and forex traders tend to place buy trade. Similarly, traders tend to place sell positions if the price is below the pivot point. So, forex traders decide whether the market is bullish or bearish using the pivots.
The Fibonacci pivots indicator now adds the Fibonacci numbers with the pivot levels and plots three supports S1, S2 and S3. Moreover, it plots three resistances at R1, R2 and R3. Since the indicator plots the resistance and support levels using Fibonacci levels they act as strong and reliable ones.
In fact forex traders can enter the market with a buy position above the pivot. They can target R1, R2 and R3 as profit levels while the trade can be trailed from S1 to S2 and finally to S3.
So the Fibonacci pivots indicator can be used for entry and to trail the markets once the trend is established.
Fibonacci Based Moving Average Indicator
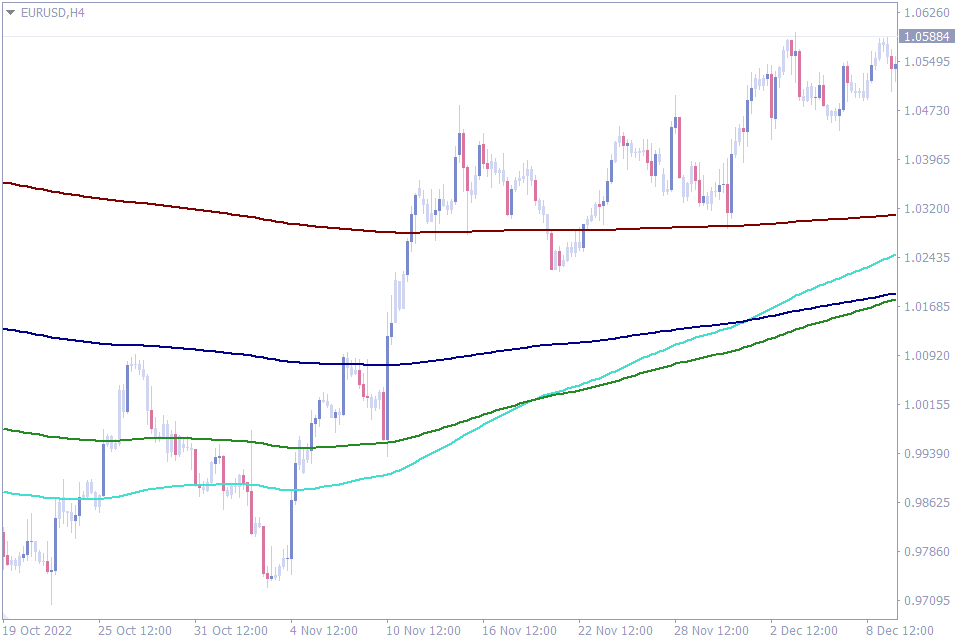
We will now discuss the fourth indicator in this list of best Fibonacci indicators. The Fibonacci based moving average indicator combines the Moving averages and Fibonacci levels to identify the trend and to locate best entry points.
Moving averages, especially Exponential Moving averages are very responsive and reacts quickly to trend changes. This indicator plots five exponential moving averages. These exponential moving averages are calculated using the Fibonacci levels.
Forex traders can now trade using these moving averages and apply trading strategies base on moving averages. The market trend is bullish if the shorter period EMA is above the longer period EMA. Similarly, in a bearish trend the shorter EMA is below the longer period EMA.
Once the trend is established traders can enter a trade in the trend direction. Another most popular trading method is the moving average crossover trading strategy. Traders can buy once the shorter EMA crosses the longer EMA upwards and sell in a crossover in the opposite direction.
To summarize, forex traders can use the same moving average trading strategies using the Fibonacci based moving average indicator. The advantage here is the combination of Fibonacci levels to calculate the moving averages.
Fibonacci Pivot Lines Indicator
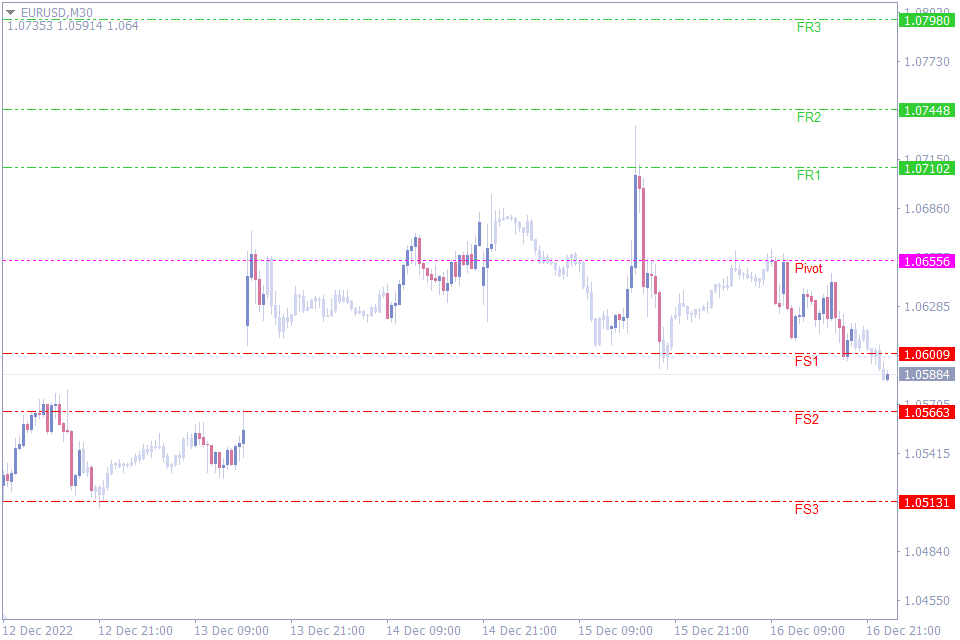
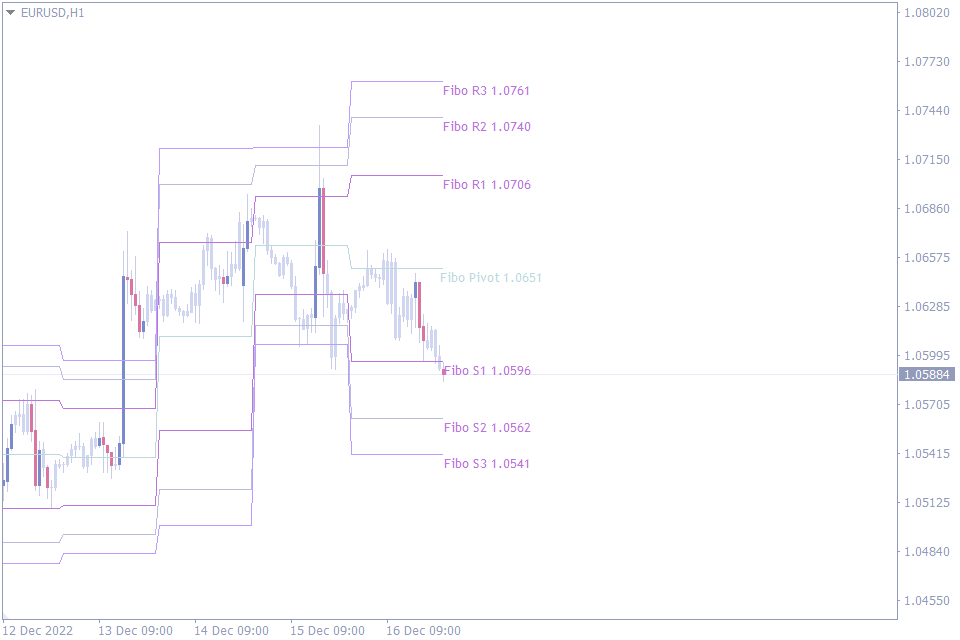
Let’s now have a look at the fifth indicator in the list of best Fibonacci indicators. The Fibonacci Pivot Lines indicator is another MT4 indicator that combines the Pivots and Fibonacci ratios to identify the trend direction, entry point, and support and resistance levels automatically.
The indicator differs from most of the pivot level indicators that calculate pivots, support and resistance using the standard pivot formula. The incorporation of Fibo levels into this indicator helps forex traders to understand strong support and resistance levels.
Most new forex traders struggle to identify the best support and resistance and employ multiple methods to identify them. The Fibonacci Pivot lines indicator works well in all intraday time frames and is well suited for new forex traders, as it plots support and resistance automatically.
The indicator plots three resistances FR1, FR2 and FR3 above the pivot level and three support levels FS1, FS2 and FS3. Traders can buy above the pivot and sell below the pivot as prices above the pivot is bullish and below the pivot is bearish.
Many traders fail to stay in the market throughout the trend. However, the three supports and resistance lines further help the forex trader to identify the best stop loss and take profit points.
Auto Fibonacci Fan Indicator
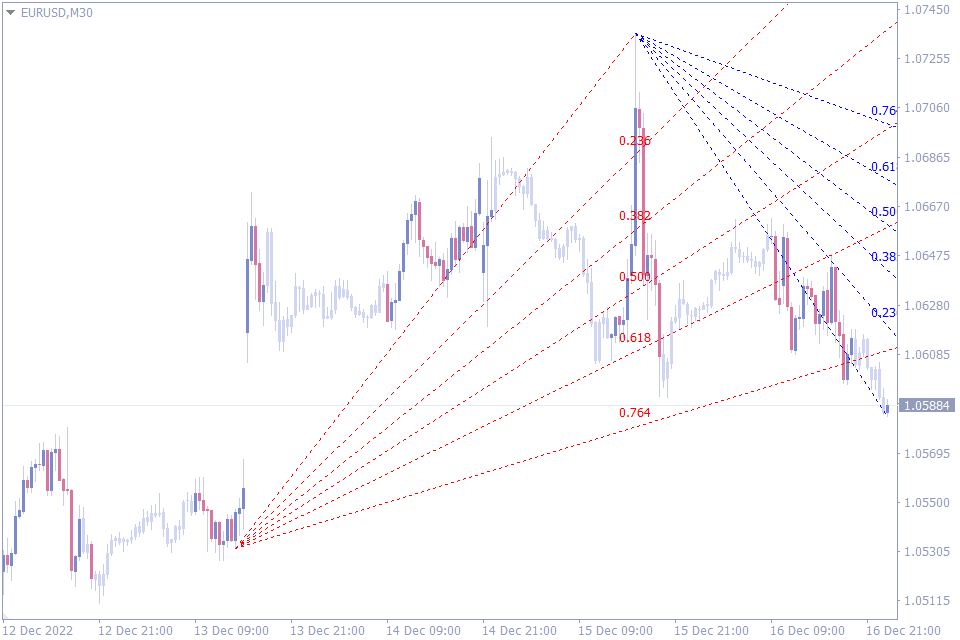
Let’s discuss the sixth indicator of this list. The Auto Fibonacci Fan indicator is another interesting MetaTrader indicator that helps forex traders identify the trend direction and the best support and resistance levels.
Trading with Fan line is an exciting method to identify the support and resistance levels. The fan lines are not horizontal in nature. These lines slope from the top of bottom of the market. Thereby they provide a different perspective of the support and resistance levels.
The Auto Fibonacci fan indicator automatically identifies the top or bottom of the market. Once the indicator identifies the top or bottom it draws the fan lines. The indicator draws Blue fan lines for a bullish trading signal. On the other hand, for a bearish trading signal the indicator plots red lines.
The indicator applies the Fibonacci ratios to calculate the values of the fan lines. In total five fan lines shows the sloping at an angle plot the support and resistance lines. As a result, the indicator automatically identifies market top and bottom, plots support and resistance lines.
The indicator indeed is a very attractive proportion for traders using fan lines to form forex trading strategies.
Fibo Projection Indicator
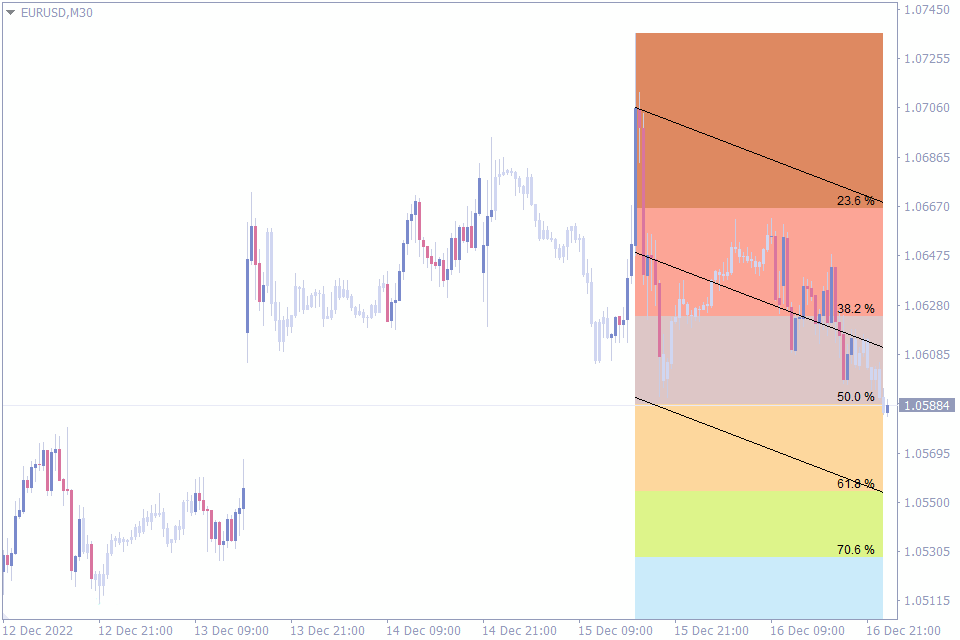
Next on our list is the seventh indicator that works with Fibo levels. The Fibo Projection Indicator applies the Fibo ratios to the ZigZag and provides the forex trader with support and resistance levels.
Many forex traders use the Zigzag MetaTader indicator to identify the market trend direction. The Zigzag indicator searches for market top and bottom and connects them using a trend line. Moreover, once the trend changes the Zigzag indentifies using the deviation and plots the trend line accordingly.
The Fibo projection indicator uses the ZigZag to identify the trend direction. Once the indicator identifies the direction, it applies the Fibonacci ratios to provide Fibo retracement and extension levels. As a result, forex traders can identify the best entry and exit points.
Once a trend is identified the indicator plots the potential retracement levels. So, traders can anticipate the prices to retrace at these levels and decide to enter the market using a buy or sell trade. Now they can use the subsequent Fibonacci levels to look for potential profit targets.
Another important feature of this indicator is about customization. Forex traders can customize the settings of both Zigzag and Fibonacci parameters to adjust the indicator according to their personal preferences.
KG Fibonacci MA Indicator
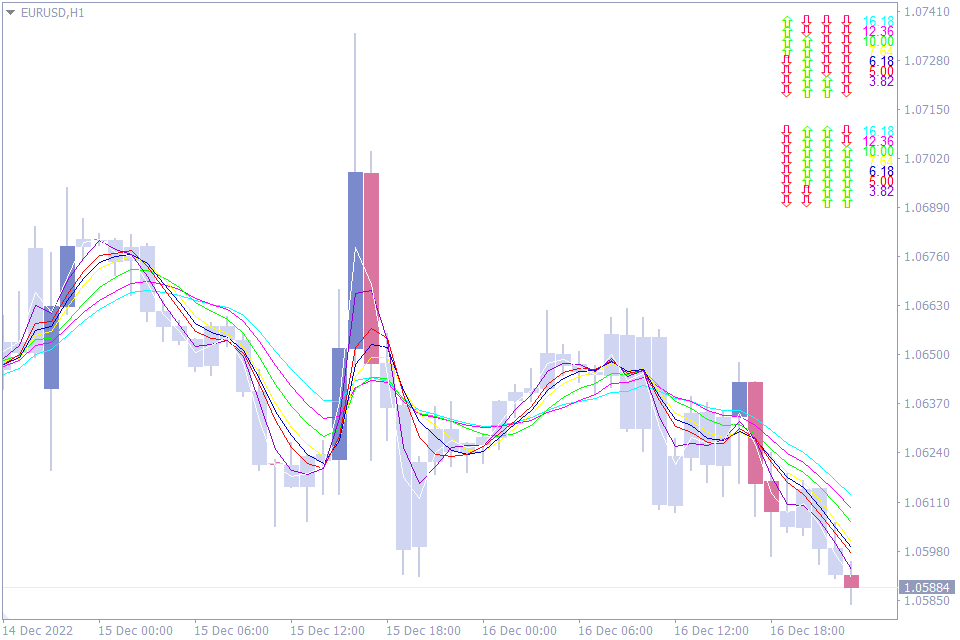
We are now reaching the final indicators in this list of best Fibonacci indicators. The KG Fibonacci MA indicator is an interesting indicator that combines eight moving averages and Fibonacci levels. The indicator helps the trader to get the market trend across eight time frames at a glance.
The indicator has a very exciting display of all the trend direction of monthly, weekly, daily, 8H, 4H, and 1H, 30 min and 15 min. In fact the corner display shows the trend direction of these indicators in Green for bullish trend and Red if the trend is bearish.
What is unique in this indicator is the combination of Fibonacci ratios to these moving averages. The indicator also displays if the moving averages are bearish or bullish with regard to the Fibo levels. So, the corner display shows the trend direction of all eight moving averages and their location with regard to the Fibo.
As a result, forex traders can understand the trend situation of the currency pair in all timeframes from monthly to 15 minutes. The KG Fibonacci indicator helps traders to apply MTF – Multi time frame strategies using this display of trend info and Fibo levels accordingly.
Forex traders will find this unique method of display and will be able to understand the markets.
Fibo Label Indicator
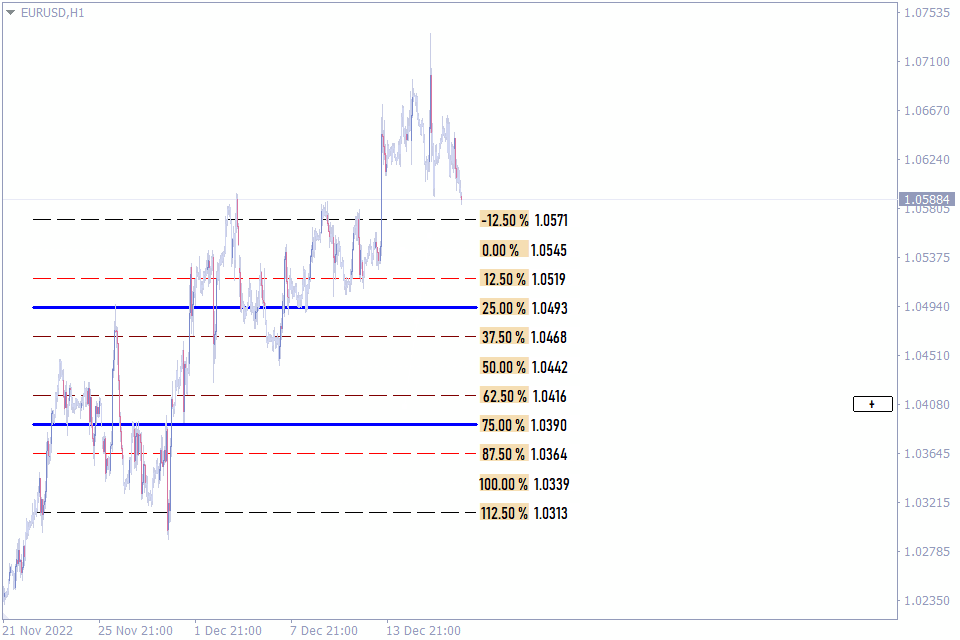
We have now reached the last indicator in our list of the best Fibonacci retracement MT4 indicators. Let’s now discuss about the Fibo label indicator. This indicator plots eight support levels and eight resistance levels and helps forex traders to enter and exit the market multiple times within a trend.
Sure, It’s important to identify a trend, which is more important is to use the trend and make the maximum profit out of the trend move. The Fibo label indicator assists the forex trader to do the same.
Once a trend move is established, Forex traders should plot the Fibo tool by connecting the high and low of the market. This enables the Fibo tool to plot retracement levels that act a support and resistance.
The most important aspect of this indicator is the possibility to adjust the indicator settings in detail. This helps the trader to separate the market into various segments and enter and exit the market between these levels.
A total of eight support and eight resistances divides the enter price move and helps trader to focus between the levels and enter and exit.
The Bottom Line
The Fibonacci ratios are applicable to many financial instruments and particularly in most price charts. However, the above indicators take that one step further and combine the Fibo retracement and extension levels with other technical indicators and trading strategies. So, it’s worth exploring them to incorporate into a forex trader’s trading strategy.


Leave a Reply