
Best Indicators for 5 and 15 Min Chart – Technical Forex Soft for Signals
Most of the retail forex traders are day traders. These forex traders enter and exit the market in short intervals. Of course, most of the day traders close the positions before the end of day and avoid holding positions overnight or over weekends and holidays. So, the optimal indicators for such traders should work well in the 5 and 15 min charts.
The optimal trading duration of the trading positions are well within a trading session. Sometimes these trades may well extend to the adjoining trading sessions. These traders may not be classified as scalpers, but intraday traders. Mostly, day traders rely on the 5 and 15 min charts as they reflect the market dynamics quickly enough for the day trader.
The technical analysis and fundamental analysis are focused on the same. Indicators that work on providing long term trading signals may not be suitable for such forex traders. In this article, we will focus on the best indicators that work in 5 and 15 min price charts and provide great results.
We will discuss in detail to understand the indicators as we require robust and responsive trading signals from them. These indicators should be able to detect trend changes and differences in momentum quickly and deliver the trading signals accordingly.
Top Indicators for 5 and 15 Min Chart
- EMA Crossover Signal Indicator
- TEMA Indicator
- Color RSI With Alert Indicator
- Adaptive RSI Indicator
- Smoothed RSI Indicator
- TMA Centered Bands Indicator
- TMA+CG Indicator
- Trend CCI Indicator
- Scalper Signal Indicator
EMA Crossover Signal Indicator
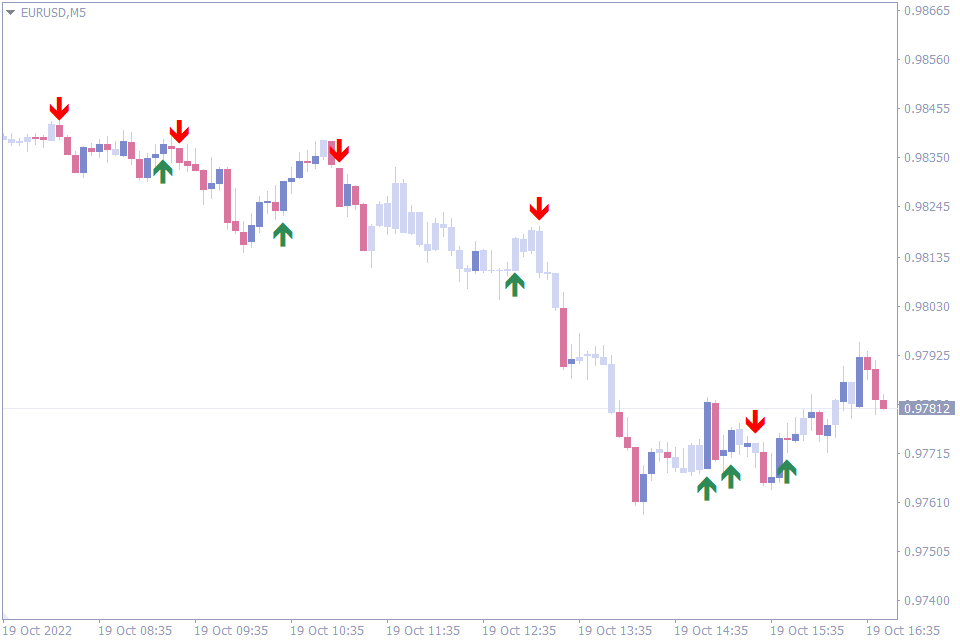
The first indicator we will discuss is our list of best indicators for the 5 and 15 min is the EMA crossover Signal Indicator. Under the hood, the driving engine of this indicator is the crossover of the EMA – Exponential moving averages.
The trader is able to custom input the settings for EMA crossover calculation. This helps technical forex traders to adjust the indicator and the subsequent trading signals according to their requirements. The EMA – Exponential moving averages are quite responsive the indicator reflects the same as trading signals.
Mostly, the indicator reflects the trend changes quickly and provides buy and sell arrow trading signals. So, traders can enter the markets and have an early entry in a trend which could last intraday. As a result, traders can get multiple trading signals using the 5 and 15 mins price chart.
Similarly, the indicator is good enough to alert on an impending price reversal. Thus the indicator also helps the trader to exit the trade upon signs of weakness.
The EMA crossover signal indicator alerts the trader once a trading signal is found. If you are looking for early trend reversal signals and optimal entry and exit zones in 5 and 15 min charts. This indicator is the best to go for.
TEMA Indicator
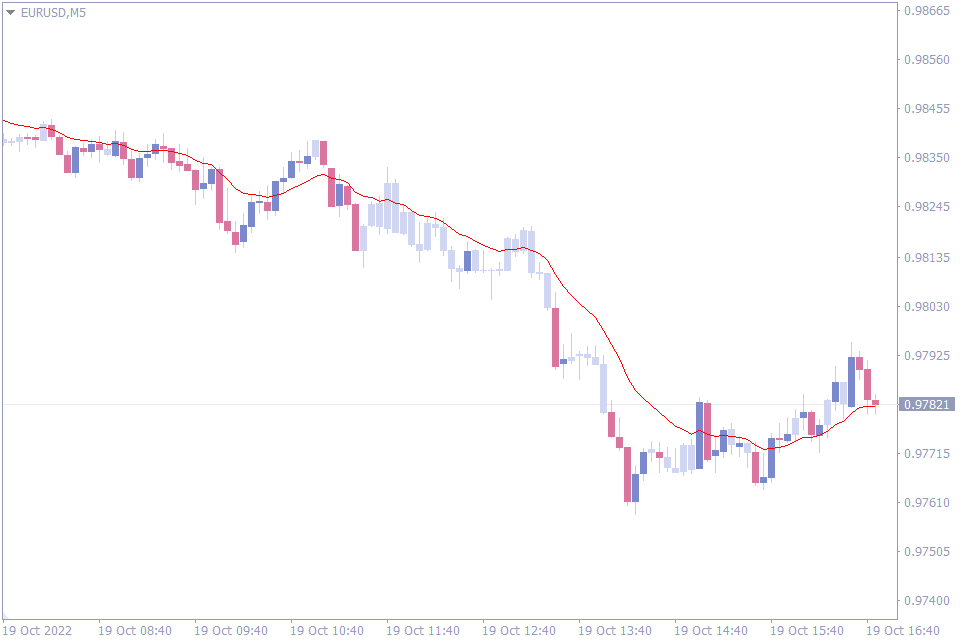
Our second indicator in the list of best indicators for 5 and 15 min is the TEMA – Triple Exponential Moving Average indicator. Interestingly, this indicator is also based on the exponential moving averages.
Forex traders use this indicator to identify dynamic support and resistance levels. As a result, technical forex traders can adapt to the market conditions easily and take advantage of the dynamic levels. Adjusting the stop loss and take profit positions according to the market conditions is a very useful application of the TEMA
In effect, this enables the trader to follow the trend effectively. Trend following is effective and profitable in the direction of a higher timeframe. To be precise this indicator helps traders applying MTF trading strategies.
What makes this indicator special? Well, the TEMA is highly responsive to recent price changes. This increased response helps the traders to identify entry and exit points during a trend. Additionally, traders can anticipate bullish and bearish market conditions well in advance.
Forex traders use the higher time frame charts like H1 or H4 to identify the trend direction. But, to identify the precise entry points traders can use the 5 and 15 min price charts. The TEMA – Triple Exponential Moving Average works effectively in identifying the same.
Another important method to derive buy and sell forex trading signals is to enter the market in a pullback. Most traders agree that pullbacks often result in profitable trades. The TEMA indicator helps the traders to identity the pullbacks in the 5 and 15 min charts.
As you can see, TEMA is effective in many trading methods. Traders can apply the indicator to follow trend, identify entry points in pullbacks and to identify entry point using MTF trading strategies.
Color RSI With Alert Indicator
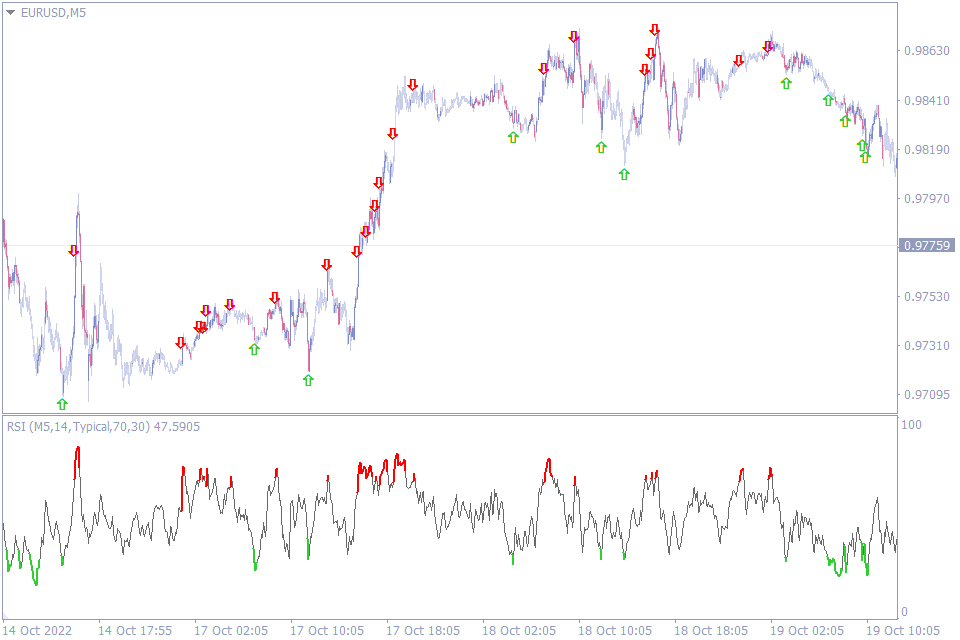
Let’s now discuss the third indicator in the list of best indicators for 5 and 15 min charts. The third indicator, Color RSI with Alert Indicator is a modified version of the classic RSI – Relative Strength Index. This MT4 indicator is pretty much useful to all the forex technical traders using the RSI.
The classic RSI does not have an alert built in. This is eliminated and traders can choose arrow alerts, sound alerts, message alerts, email alerts. As a result, forex traders can receive alerts and never miss a potential trading opportunity.
The basic application of the RSI is to identify the oversold and overbought market conditions. Simply put, RSI traders ignore any price movements between the overbought and oversold levels. The best opportunity to trade the market is to anticipate a reversal at these levels.
Color RSI with Alert Indicator alerts the traders during the overbought and oversold levels and helps the trader to enter the markets with a buy or sell position accordingly. Moreover, the indicator also changes the color of the oscillator and helps traders identify the oversold and overbought levels visually.
Another important feature of this MT4 indicator is the possibility of displaying the RSI of any time frame in the current chart. This feature is very effective in identifying multiple market conditions respective to the current chart.
The above MTF trading strategy helps the forex trader to visually understand the RSI values of any time frames or a higher time frame chart in the current chart.
Traders can input the desired chart time frame in the settings to get the same.
As a result, traders can use this indicator in 5 and 15 min chart to identify the overbought and oversold conditions. Simultaneously, they can understand the RSI values of any time frame.
Adaptive RSI Indicator
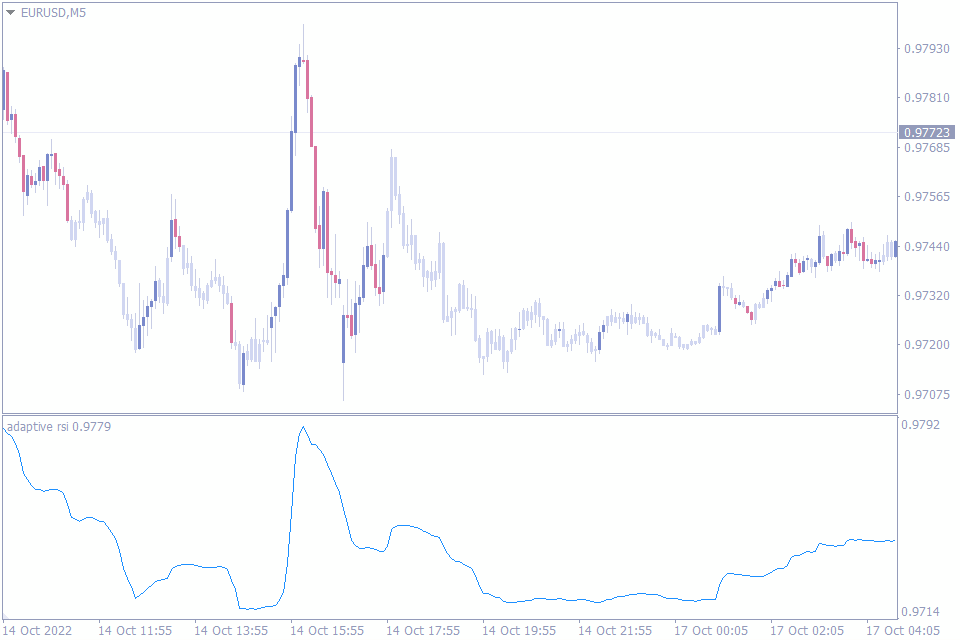
We will now discuss our 4th indicator in the list of best indicators for the 5 and 15 min charts. The Adaptive RSI indicator is a modified version of the classic RSI – Relative Strength Index indicator.
The Adaptive RSI indicator is an oscillator with a signal line. The movement of this signal line provides the important clues about the market conditions. Indeed, the Adaptive RSI provides the overbought and oversold trading signals.
The important difference between the classic RSI and the Adaptive RSI is the smoothness of the signal line. As the signal line of the Adaptive RSI is smoother, without the regular choppiness of the classic RSI. It provides much better clarity in the market movements.
Furthermore, the smoothness of the signal line helps forex traders for additional confirmation of an entry. The entry signals of overbought and oversold conditions needs to be confirmed by additional signals, the smooth Adaptive RSI signal line provides the same.
Another important application of the indicator is identification of bullish and bearish divergences. Since, divergence is a leading indicator the Adaptive RSI is helps trader to anticipate trend changes.
Effectively, the Adaptive RSI provides better overbought and oversold trading signals. Similarly, it provides potential buy and sell divergence trading conditions.
Smoothed RSI Indicator
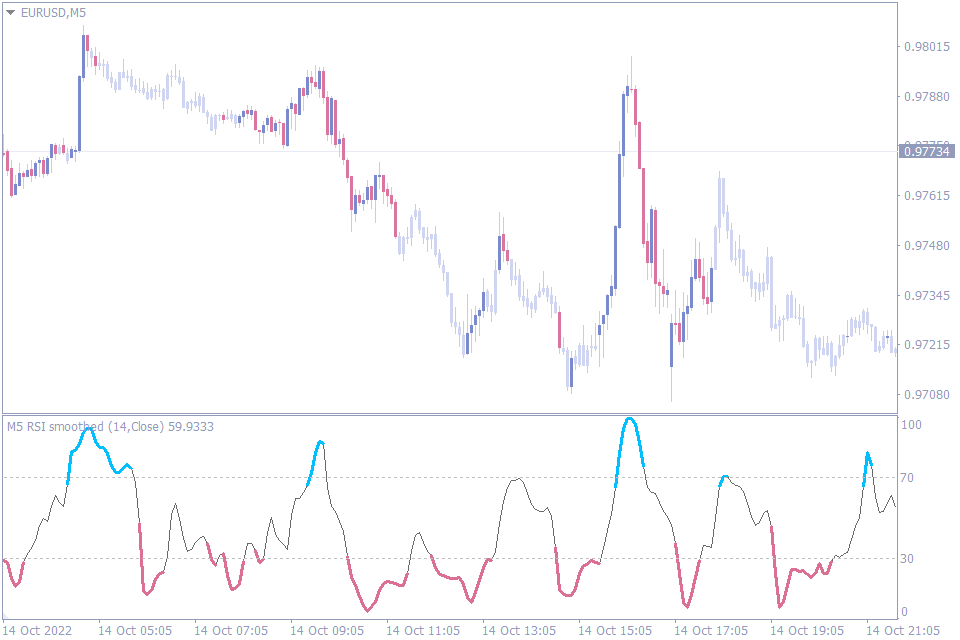
Now we will discuss the Smoothed RSI indicator that is 5th in our list of best indicators for 5 and 15 min charts. The Smoothed RSI indicator is also a modified version of the classic RSI indicator. But, this indicator has additional features that can adjust as per the forex trader’s requirements. The input settings are trader friendly to smoothen the output.
The Smoothed RSI indicator incorporates settings to enable or disable additional smoothening of data. Smoothening helps traders to experience a smooth RSI oscillator. This helps traders to identify the overbought and oversold levels effectively.
Additionally, settings cover to enable or disable interpolation. The interpolation option is definitely an option that is not found is most of other RSI based indicators. RSI oscillator interpolation provides the forex traders with additional assistance in projecting the oscillator values and in turn helps to identify market direction.
Another feature which is unique in this indicator is the type of alerts. The alertsOnZoneEnter and the option to alertsOnZoneExit is very helpful to identify the best exit point. While, forex traders can use the same to identify a potential trade entry opportunity and await the same.
The supplement the trading opportunities the indicator comes with various options to alert the trader.
TMA Centered Bands Indicator
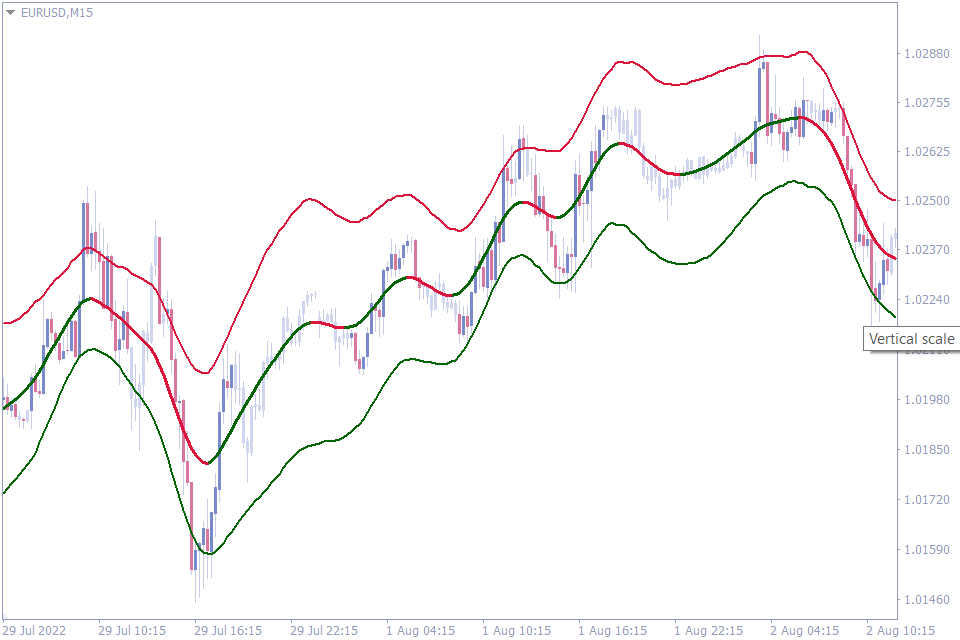
We are now moving to the lower half of the list of best indicators for 5 and 15 min charts. Our 6th indicator is the TMA Centered Bands Indicator. This MT4 indicator is a good trend following indicator and is very useful for trend traders.
The indicator plots bands on the price chart, which are effective in identifying the trend direction. Additionally, traders can identify the trend reversals as immediate as possible.
The TMA centered bands indicator is based on the Triangular Moving Averages. So, the indicator plots the bands based on the moving averages. The indicator plots an upper band, lower band and a mid line. The bands point towards the overall direction of the trend.
Forex traders can use the bands to enter and exit the markets. Placing a buy or sell trade based on the price relative to the band is the key to make a trading decision. In general, traders can place a buy order if the price is at the lower band.
Similarly, traders can enter the market with a sell trade if price at the higher band. If the price crosses the mid band to the upwards it’s considered as bullish market condition. Similarly, if the price moves lower than the mid line it indicates a bearish market condition.
TMA centered bands indicator provides bands similar to the classic Bollinger bands. But in this indicator the calculations are derived from the Triangular moving averages.
TMA+CG Indicator
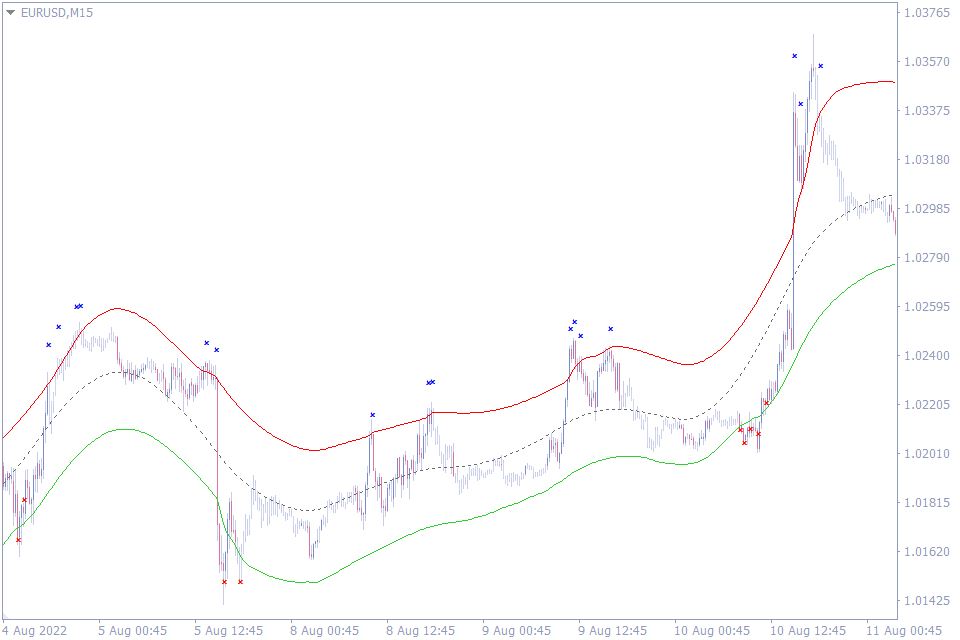
We will now look at the specifics of the 7th indicator in the list of best indicators for 5 and 15 min charts. The TMA + CG indicator is a combination of TMA- Triangular Moving Averages and CG – Center of Gravity indicator. The combination of these two indicators helps forex trend traders to define trend trading strategies.
The TMA + CG indicator is an effective tool to identify the trend direction and also to find best entry points. In fact forex traders using channel trading strategies will find it very useful to identify trend. The direction of the channel identifies the bullish or bearish market condition.
So, traders can enter the market with a buy or sell trade based on the direction of the channel. However, another interesting application of this indicator is to help traders identify best buy and sell entry points.
Channel lines are effectively dynamic support and resistance levels. As the channel lines change and reflect the market dynamics, forex technical traders can use these lines to enter and exit.
Generally, the lower channel line is considered as a good buy entry point, while the upper channel line acts as the best sell entry point. An additional confirmation to this trade is the direction of the channel. So, traders can filter the signals of upper and lower channel using the direction of the channel.
The indicator settings provide user input settings for various parameters including interpolation, band deviation and half length. These settings help the trader to further customize the indicator according to the individual trader’s requirements.
Trend CCI Indicator
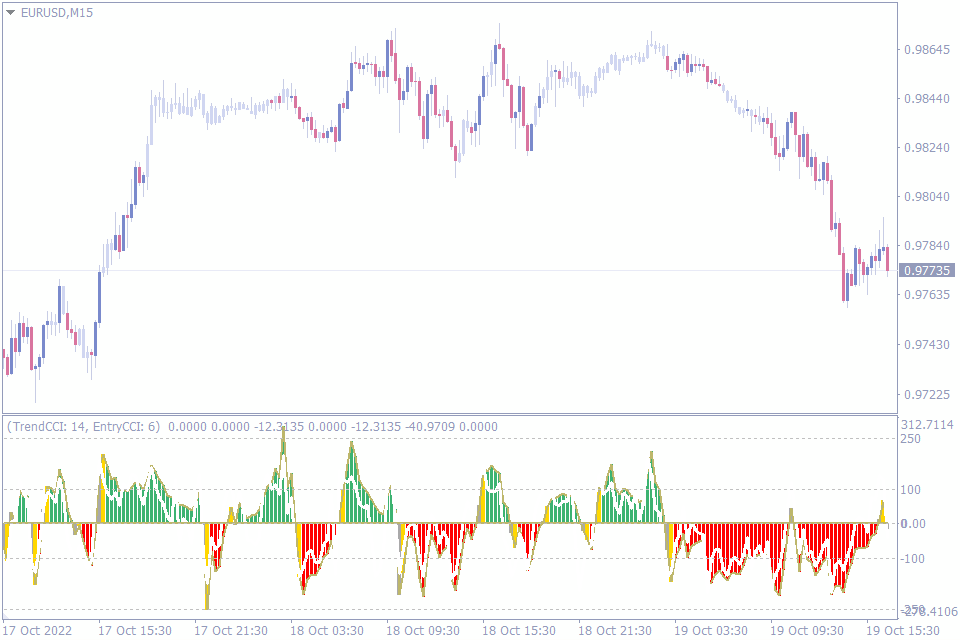
We will now move to the 8th indicator in the list of best indicators for 5 and 15 min chart. The Trend CCI indicator uses the Commodity Channel Index MT4 indicator to calculate the momentum and trend. As an oscillator this indicator helps traders to identify overbought and oversold conditions too.
The combination of CCI with a momentum detector makes this indicator very useful to forex traders. Momentum is visually displayed by the histogram bars; longer histogram bars indicate the trend strength in both bullish and bearish conditions.
This helps the traders to hold profitable positions for a longer period and to ride the trend. As a result, the trades tend to have better Risk reward ratio. A weakening momentum indicates the potential exit point as it indicates a possible price reversal ahead.
Indeed, the indicator helps the technical traders to identify the overbought and oversold market conditions. Indicator values higher or lower than 250 indicate potential overbought or oversold market condition.
So, traders can enter the market with a buy position if price reaches an oversold condition of -250. On the other hand, a sell trade with at an overbought condition of 250 will produce potential profits.
Intraday traders and scalpers using the 5 min and 15 min price charts will be able to identify the momentum which is very essential at these chart time frames.
Scalper Signal Indicator
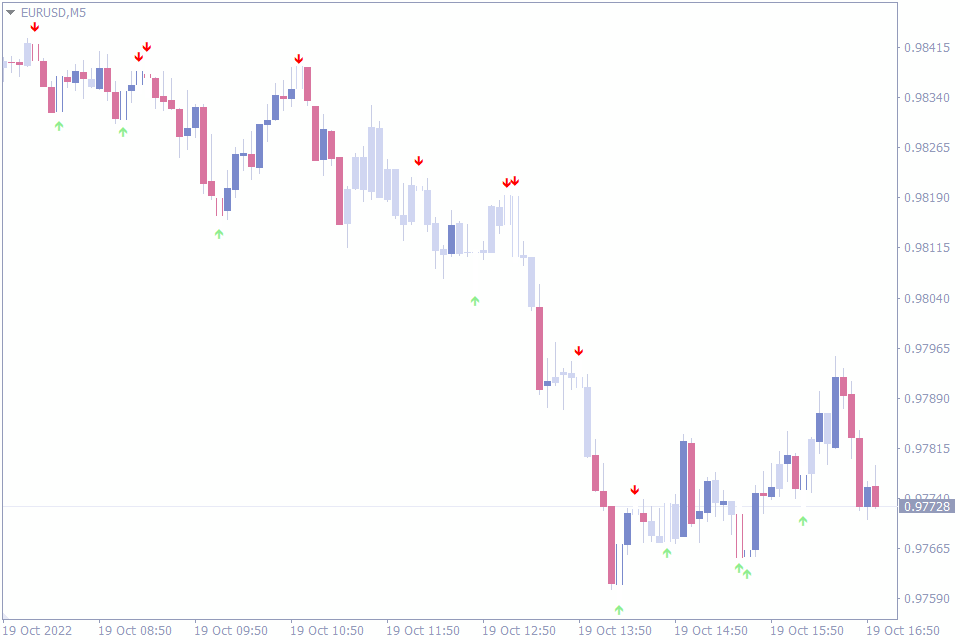
Our last indicator in the list of best indicators for 5 and 15 min charts is the Scalper Signal indicator. This MT4 indicator generates buy and sell arrow trading signals. The indicator primarily focuses on identifying the trend direction.
In fact, the indicator is best suitable trend followers. As mentioned earlier the arrow signals appear during trend changes. Since the indicator is very responsive to trend changes and reacts to the recent price changes, it is well suited for 5 and 15 min charts.
The driving force behind this indicator is momentum. Price momentum is an essential component in identifying the market direction. The indicator forecasts the bullish and bearish price movement and signals the buy and sells trade.
The application of this indicator is pretty simple. If the trader finds an up arrow below the price a buy trade is initiated. Alternately, a down arrow warrants a sell trade. Traders can exit the current position at an opposite trading signal. This enables traders to hold the positions for a longer period of time and benefit from the trend movement.
The arrow trading signals can be used to trade MTF trend following trading strategies. If a higher time frame chart indicates a downtrend, then MTF traders can enter the market in the lower time frames like to 5 min and 15 min charts in the same direction. This enables traders to filter the trading signals and ensures that they stay in the direction of the main trend.
Bottom Line
The above list of best indicators for 5 and 15 min charts is a short list based on their effectiveness on the lower time frame price charts. Though there are many trading methods that can be applied using these indicators. We recommend to use these indicators in tandem of others for additional confirmation.


Leave a Reply