

Best MACD Settings for Precision in Swing and Intraday Trading
The Moving Average Convergence Divergence (MACD) has a storied history in the realm of technical analysis, becoming a widely embraced indicator following its inception by Gerald Appel in the late 1970s. Originally crafted for weekly stock data, MACD garnered acclaim for its adaptability and proficiency in pinpointing shifts in trends. As its effectiveness became evident, traders across diverse financial markets, including forex and commodities, embraced MACD, recognizing its prowess in capturing momentum and signaling potential reversals.
However, to extract the maximum benefit from MACD, it’s crucial to optimize its settings based on your trading style and the timeframe you’re operating in.
Understanding MACD
A Brief Overview. Before diving into optimization, let’s briefly revisit the MACD’s components. The indicator consists of two lines: the MACD line and the signal line. The MACD line is calculated by subtracting the 26-period Exponential Moving Average (EMA) from the 12-period EMA. The signal line, often a 9-period EMA, is then plotted on top of the MACD line, serving as a trigger for buy or sell signals.
MACD Indicators
The Moving Average Convergence Divergence (MACD) indicator is a powerful tool for traders utilizing the MetaTrader 4 (MT4) or MetaTrader 5 (MT5) platforms. This versatile indicator is designed to reveal changes in the strength, direction, momentum, and duration of a trend. Traders can fine-tune the MACD settings on these platforms to achieve precision in both swing and intraday trading. By adjusting parameters such as the Fast and Slow Exponential Moving Averages (EMA) and the Signal Line, users can tailor the MACD to suit different timeframes and market conditions. This customization empowers traders to capture potential trend reversals, identify entry and exit points, and make informed decisions based on the evolving dynamics of the financial markets.
Numerous freely available variations of MACD indicators for Meta Trader 4/5, featuring diverse displays and signal outputs, are accessible at no cost and can be choosen for free download here. From this selection, I opted for the MACD Alert Indicator and MACD True Alerts Indicator.
Optimizing MACD Settings for Swing Trading
Timeframe: Daily and Weekly Charts
For swing traders who operate on daily and weekly charts, a more extended timeframe is preferred. Consider the following settings:
Fast EMA: 12
Slow EMA: 26
Signal EMA: 9
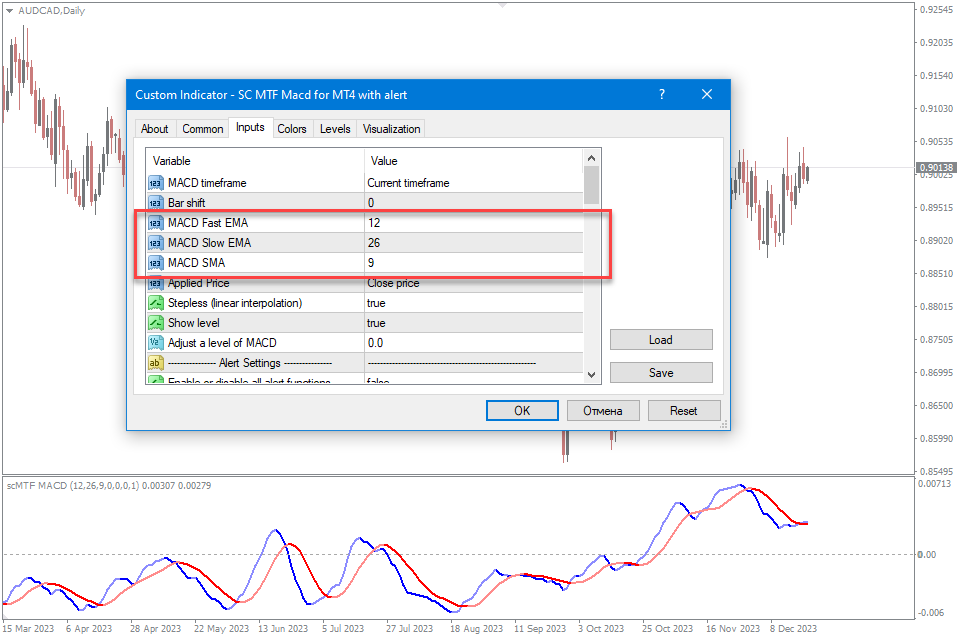
These settings offer a balanced approach, capturing significant price movements without being overly sensitive to short-term fluctuations. For swing traders, the focus is on identifying trends that may unfold over several days or weeks, and these settings align with that objective.
Optimizing MACD Settings for Intraday Trading
Timeframe: 4-Hours Chart
Optimal MACD Settings for 4-Hour Timeframe:
Fast EMA: 8
Slow EMA: 17
Signal EMA: 9
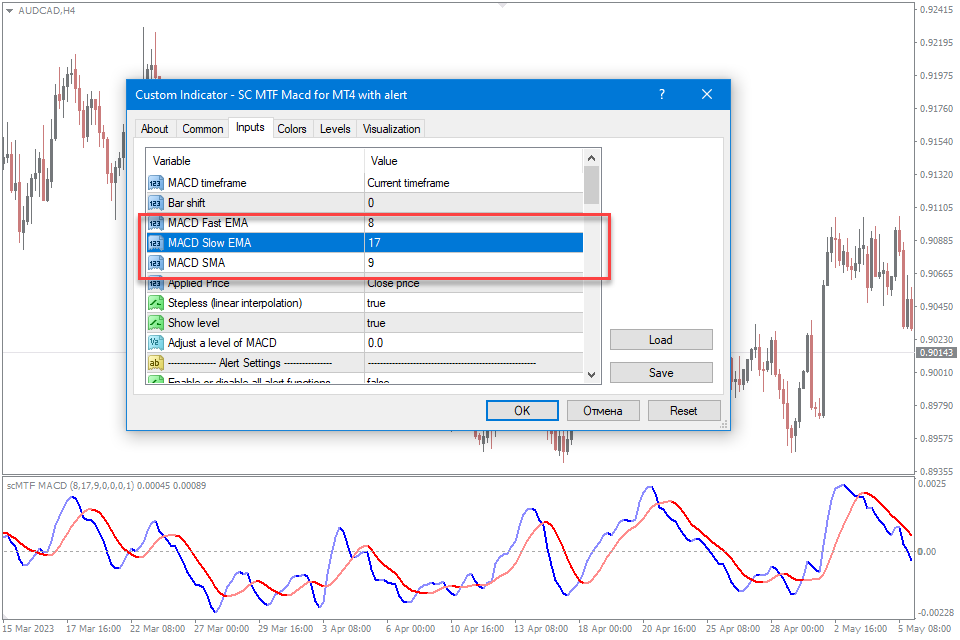
For the 4-hour timeframe, these settings strike a balance between capturing significant price movements and providing signals that are responsive to medium-term trends. The 12-period Fast EMA ensures sensitivity to shorter-term fluctuations, while the 26-period Slow EMA smoothens out noise, and the 9-period Signal EMA acts as a trigger line. This configuration is well-suited for traders looking to identify trends and potential entry or exit points over a few days. As always, consider these settings based on your trading strategy and market conditions.
Timeframe: 1-Hour Chart
Optimal MACD Settings for 1-Hour Timeframe:
Fast EMA: 5
Slow EMA: 13
Signal EMA: 8
For the 1-hour timeframe, a slightly longer configuration provides a balance between responsiveness and smoothing.
Timeframe: 15-Minute Сhar
Intraday traders, dealing with shorter timeframes, require settings that respond quickly to market changes. Here’s an ideal MACD Settings:
Fast EMA: 3
Slow EMA: 8
Signal EMA: 5
In the 15-minute timeframe, commonly employed for intraday trading, a shorter configuration is recommended. The 8-period Fast EMA ensures responsiveness to shorter-term price movements, allowing traders to capture more immediate trends. The 17-period Slow EMA and 9-period Signal EMA strike a balance between smoothness and precision, providing reliable signals for timely decision-making
Timeframe: 5-Minute Сhart
Optimal MACD Settings for 5-Minute Timeframe:
Fast EMA: 2
Slow EMA: 5
Signal EMA: 3
In the fast-paced environment of a 5-minute timeframe, a shorter period configuration is appropriate. The 5-period Fast EMA allows the MACD to respond quickly to short-term price movements, enhancing its effectiveness in intraday trading. The 13-period Slow EMA provides a slightly smoothed trend indication, and the 5-period Signal EMA serves as a prompt for potential trade entries and exits. Keep in mind that this setting is just a starting point.
Experimentation and Fine-Tuning
While these optimized settings provide a starting point, remember that no one-size-fits-all solution exists in trading. Market conditions, asset volatility, and personal trading preferences vary. Therefore, consider these settings as a foundation and be open to experimentation.
Adapt to Market Conditions: In volatile markets, you might need faster settings to capture rapid price changes. Conversely, in stable markets, slightly slower settings could reduce false signals.
Combine with Other Indicators: MACD works well in conjunction with other indicators. Experiment with combinations to confirm signals and minimize false positives.
Risk-Reward Ratio: Ensure that your MACD settings align with your risk tolerance and desired risk-reward ratio for each trade.
Backtesting: Evaluate the performance of your chosen settings by backtesting against historical data. This can provide insights into how well the settings perform under different market conditions.
Common MACD Trading Strategies
Regardless of the timeframe or settings, several common trading strategies can be applied using MACD
MACD Crossovers: Buy when the MACD line crosses above the signal line (bullish crossover) and sell when it crosses below (bearish crossover).
Divergence: Look for discrepancies between price movements and MACD, which may signal potential reversals.
Histogram Analysis: Analyze the MACD histogram to identify changes in momentum. A rising histogram indicates increasing momentum, while a falling histogram suggests a slowdown.
Trend Confirmation: Use MACD to confirm the strength of an existing trend. A strong trend is often accompanied by a wide gap between the MACD and signal lines.
Conclusion
Optimizing MACD settings is a dynamic process that involves aligning the indicator with your trading goals and the specific characteristics of the market you’re navigating. Whether you’re a swing trader aiming for longer-term trends or an intraday trader capturing quick price movements, the right MACD settings can significantly enhance your decision-making process.
Remember, there’s no universal “best” setting for MACD. Successful trading involves continuous adaptation and a keen understanding of market dynamics. Use these optimized settings as a starting point, but always be ready to refine them based on your evolving experience and the ever-changing nature of the financial markets.


Leave a Reply