

TOP 10 Best TradingView Indicators
Navigating the dynamic expanse of TradingView, a robust online platform, unveils a rich tapestry for traders and investors. Offering a seamless blend of advanced charting tools, technical analysis prowess, and a vibrant community, TradingView stands as a versatile hub accessible across various financial domains, including stocks, forex, commodities, cryptocurrencies and more.
The platform features a vast library of user-generated content, including scripts, indicators, and strategies. Traders can access and use these tools to enhance their trading experience.
TradingView is widely used by traders of all experience levels, from beginners to seasoned professionals, due to its friendly interface and powerful analytical tools. It is accessible through web browsers or desktop applications (for Windows, macOS, and Linux) and mobile applications (for IOS and Android), making it convenient for users to access their charts and analyses from different devices.
Table of content
- Moving Averages (MA)
- Relative Strength Index (RSI)
- Bollinger Bands
- MACD (Moving Average Convergence Divergence)
- Ichimoku Cloud
- Stochastic Oscillator
- Fibonacci Retracement
- Average True Range (ATR)
- Aroon Oscillator
- On-Balance Volume (OBV)
#1. Moving Averages (MA)
A fundamental trend-following tool, MAs smooth out price data to identify trends over specific periods.
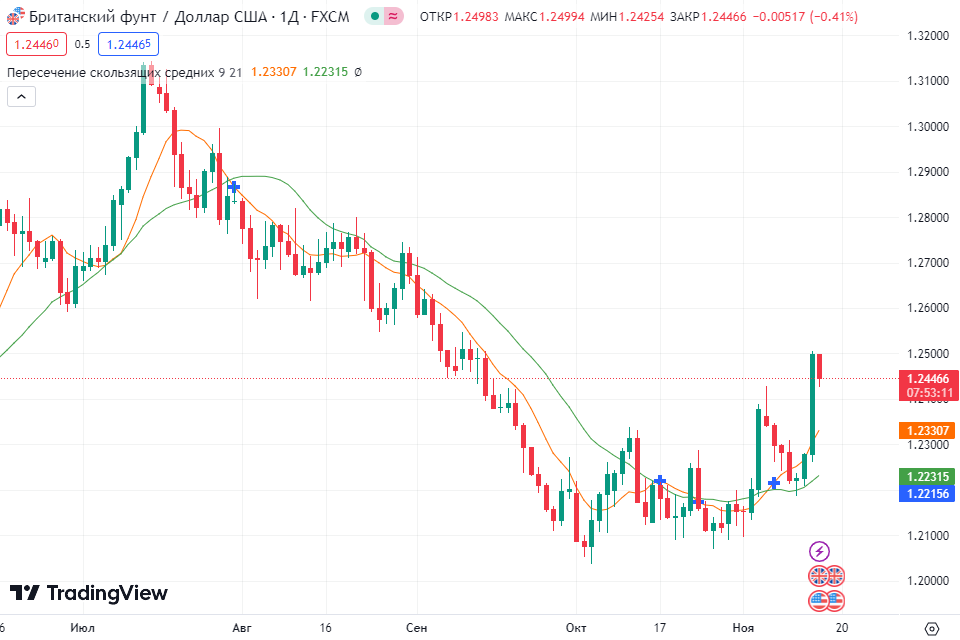
Use Case: Crosses between short-term and long-term MA’s signal potential trend reversals or continuations. These crossovers act as strategic signals, guiding traders in making informed decisions based on the evolving market dynamics.
#2 Relative Strength Index (RSI)
RSI measures the speed and change of price movements. It helps identify overbought or oversold conditions.
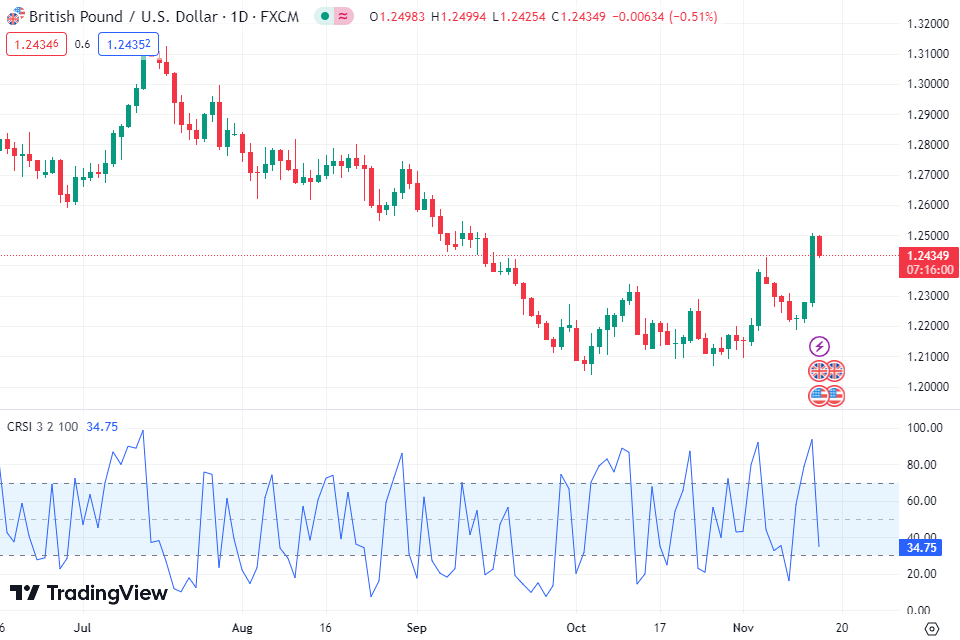
Use Case: RSI values above 70 suggest overbought conditions, while values below 30 indicate oversold conditions. Traders often utilize these RSI thresholds as key decision points, helping them formulate strategies for entries, exits, or anticipating trend shifts.
#3 Bollinger Bands
Bollinger Bands consist of a middle band, an upper band, and a lower band. They adapt to volatility in price movements.
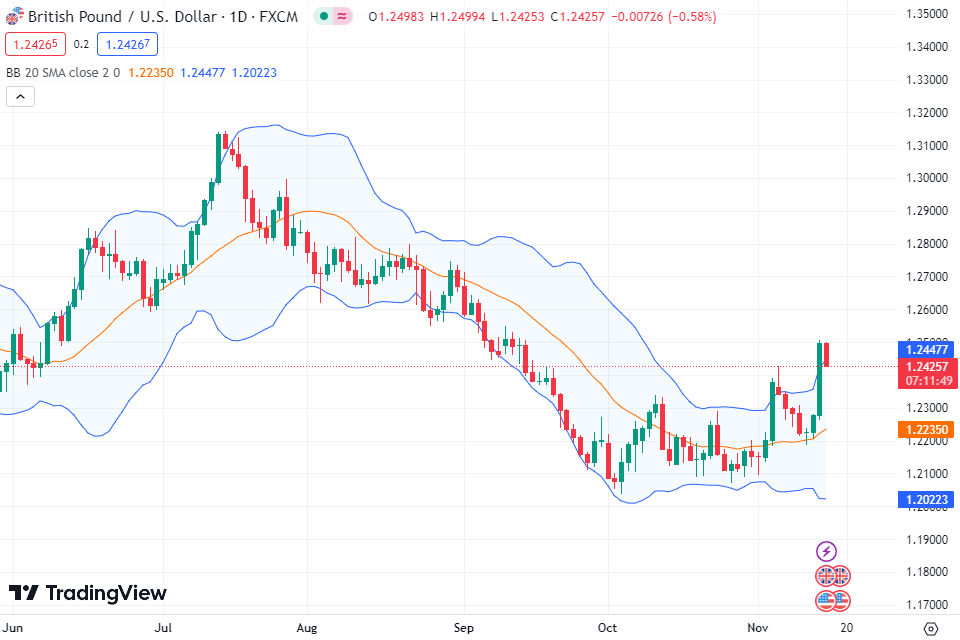
Use Case: Price touching the upper band may signal overbought conditions, while touching the lower band may indicate oversold conditions. Understanding these scenarios broadens the utility of Bollinger Bands, providing traders with valuable insights into potential market conditions.
#4 MACD (Moving Average Convergence Divergence)
MACD identifies potential trend changes by measuring the relationship between two moving averages of an asset’s price.
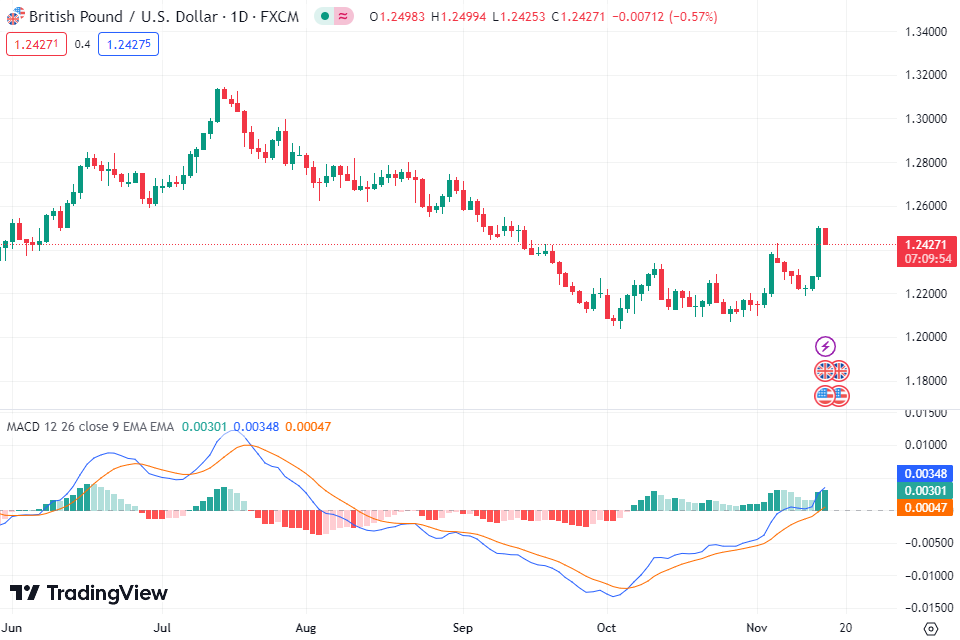
Use Case: MACD crossovers, especially the signal line crossing above or below the MACD line, can indicate trend reversals. Traders often use these crossover events to make informed decisions, adding a dynamic element to their analysis and enhancing their ability to capture shifts in market sentiment.
#5 Ichimoku Cloud
This Japanese indicator provides a comprehensive view of potential support and resistance levels, as well as trend direction.
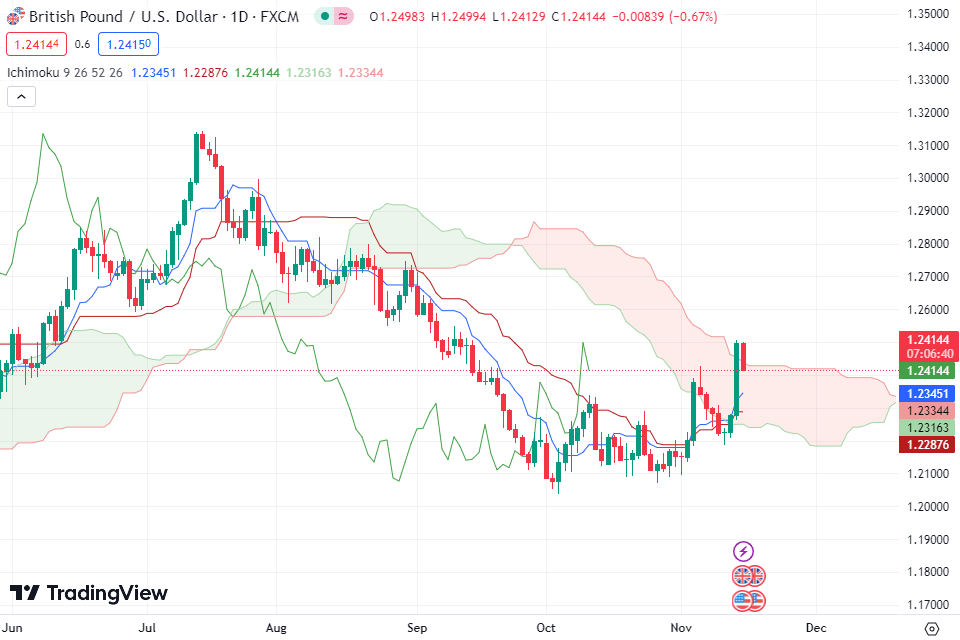
Use Case: The Ichimoku Cloud, with its distinct components like the Senkou Span A and Senkou Span B, offers a comprehensive view of market trends. When the price resides above the cloud, it signals a bullish trend, indicating a potential opportunity for traders to explore long positions. Conversely, when the price dips below the cloud, it implies a bearish trend, prompting traders to consider short positions. This dynamic interaction with the cloud provides a valuable perspective on market sentiment and assists traders in making well-informed decisions based on prevailing trends.
#6 Stochastic Oscillator
Stochastic measures the location of a closing price relative to its price range over a specific period.
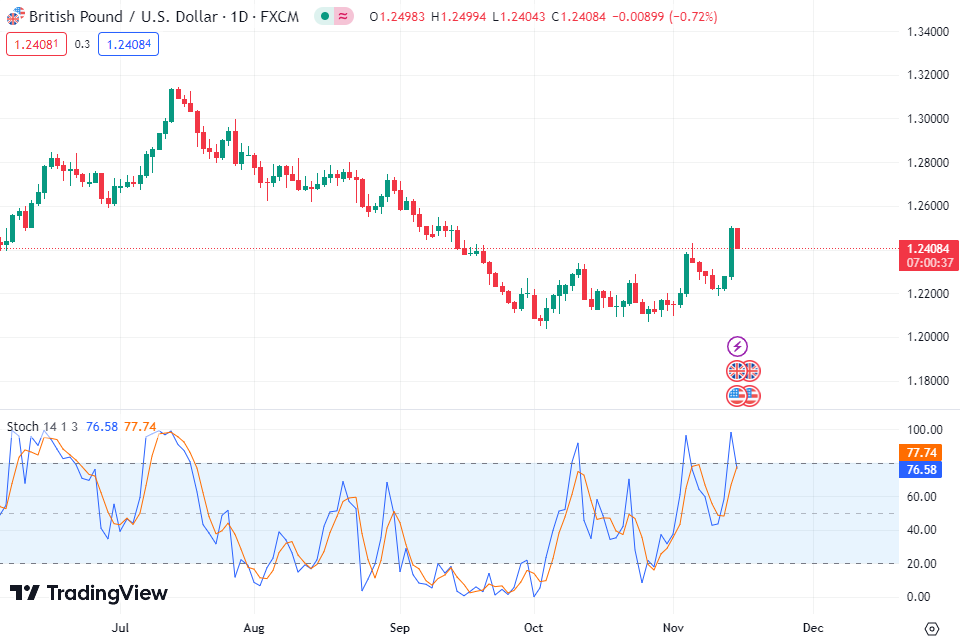
Use Case: Readings above 80 suggest overbought conditions, while readings below 20 suggest oversold conditions. These numerical indications from the Stochastic oscillator furnish traders with crucial insights into the ebb and flow of market sentiment
#7 Fibonacci Retracement
Based on Fibonacci ratios, this tool helps identify potential reversal levels.
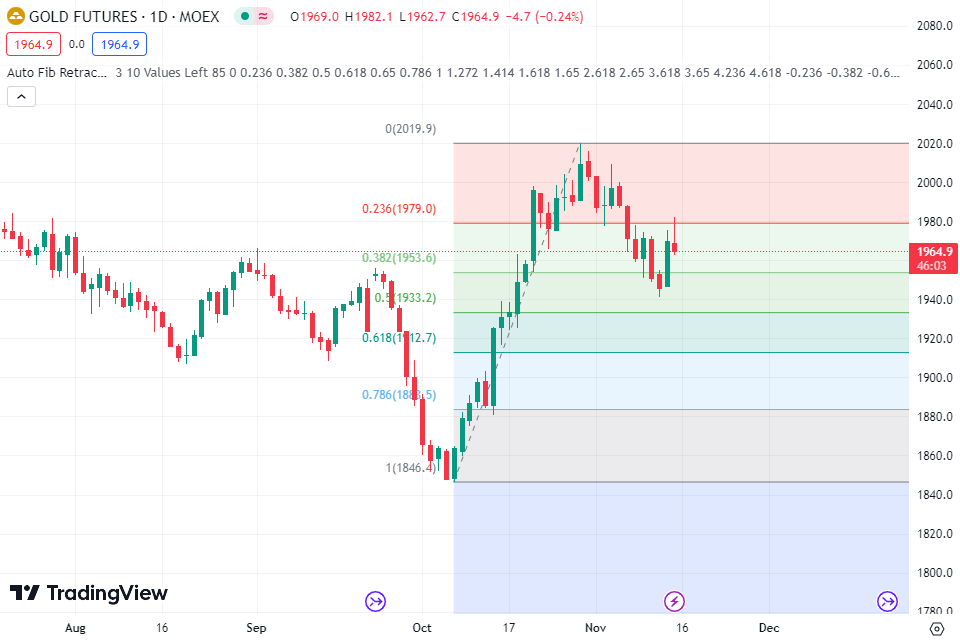
Use Case: Traders use Fibonacci levels to set potential support and resistance areas. The application of Fibonacci retracement and extension levels empowers traders to discern strategic price levels where assets may exhibit a propensity to reverse or continue their prevailing trend. This technique adds a layer of precision to technical analysis, assisting traders in anticipating potential price movements.
#8 Average True Range (ATR)
ATR measures market volatility, aiding in setting stop-loss and take-profit levels.
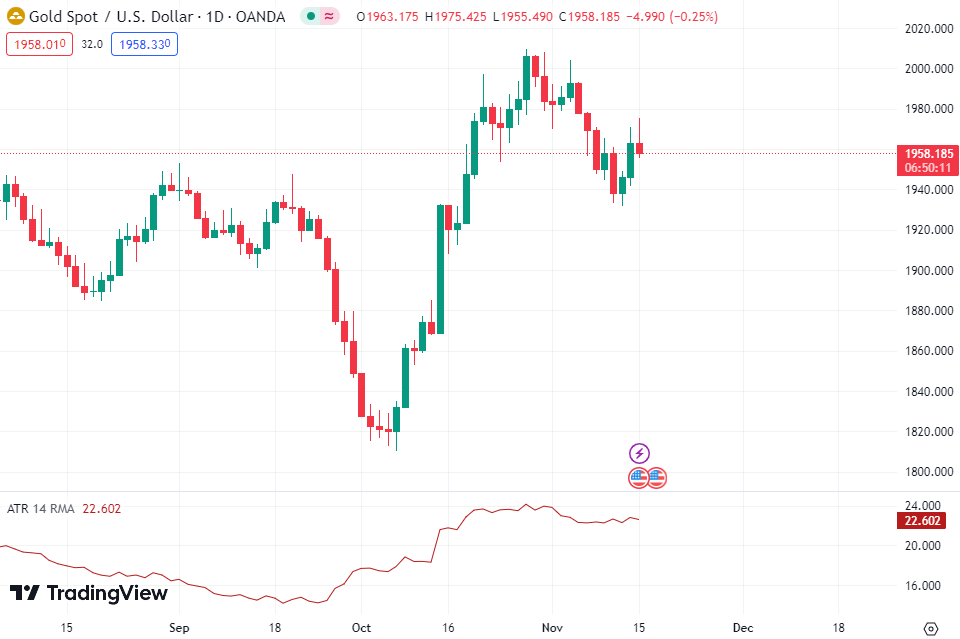
Use Case: Increasing ATR values suggest rising volatility, potentially indicating a stronger trend. Monitoring the trajectory of ATR provides traders with valuable insights into the evolving market conditions, enabling them to adapt their strategies accordingly. This dynamic tool serves as a compass, navigating traders through the fluctuations of volatility and aiding in the identification of opportune moments for entering or exiting positions.
#9 Aroon Oscillator
This indicator helps traders identify the strength of a trend and potential reversal points by measuring the time between highs and lows.
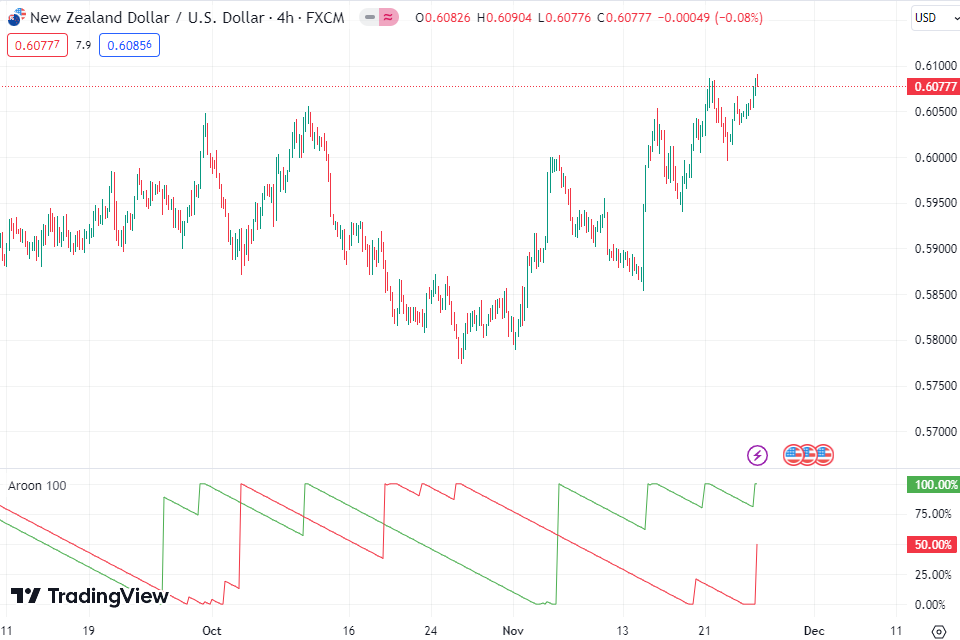
Use Case: In a bullish scenario, the Aroon Oscillator can provide valuable insights. When the Aroon Up (green line) is consistently higher than the Aroon Down (red line), it indicates a strong upward trend. Traders can look for potential entry points during pullbacks or consolidations, aligning their trades with the prevailing bullish momentum. Conversely, in a bearish trend, when the Aroon Down is dominant, traders may consider short positions or tightening their stop-loss levels during brief upward movements.
#10 On-Balance Volume (OBV)
Reflects the cumulative trading volume and helps identify potential trend reversals by comparing volume with price movements.
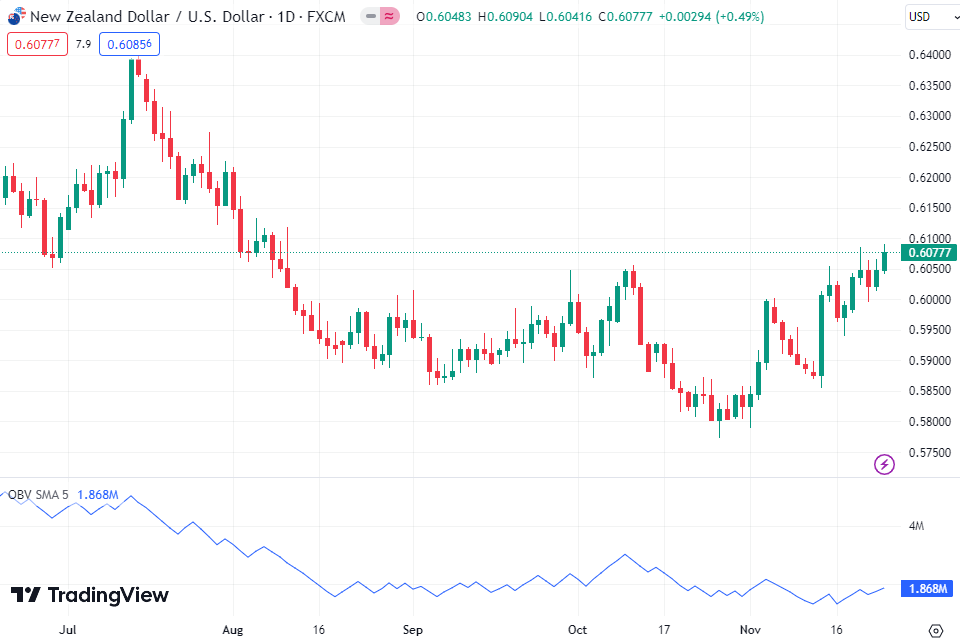
Use Case: On-Balance Volume is a Trading Ally and a versatile tool that aids traders in confirming trends, recognizing divergences, identifying volume breakouts, and managing risks effectively. It serves as a reliable confirmation tool and finds application across different assets and timeframes, enhancing trading decisions.
Are Indicators free?
Many indicators on TradingView come in both free and paid versions. The platform offers a variety of indicators for free use, contributed by the community of traders and developers. However, some indicators, often with advanced features or specific functionalities, may have premium versions that require payment.
It’s advisable to explore the TradingView library, where you’ll find a mix of free and paid indicators. Additionally, you can filter indicators based on your preferences and budget, ensuring you find the best fit for your trading needs. Always check the details of each indicator to understand its pricing model and features.
How to find and add Indicators to your chart?
In the dynamic realm of TradingView, adding indicators is a breeze. Once you’ve logged in and selected your preferred asset, just navigate to the “Indicators” button on the toolbar. There, a world of analytical tools awaits. Choose the one that suits your strategy, tweak its settings.
Refining your chart is easy too. Adjust colors, time periods, and any other settings to match your preferences. Once you’ve crafted the perfect setup, save it as a template for future use. If you ever want to modify or remove an indicator, a simple right-click does the trick.
Сan I customize the Indicator?
For those seeking more advanced customization, each indicator has a gear icon that unveils additional settings. Configuring indicators on TradingView is vital for tailoring them to your specific trading preferences. Access the indicator settings, where you can adjust parameters like periods, colors, and styles. Tweak these settings to match your strategy, ensuring a personalized and effective trades.
Don’t forget to save your chart to preserve your carefully curated indicator configurations.
Conclusion
TradingView stands as a comprehensive and versatile platform that empowers traders with advanced charting tools, extensive technical analysis capabilities, and a collaborative community.
In the dynamic world of trading, having the right indicators is like having a compass in uncharted waters. The Best 8 Indicators discussed here are not just tools; they are strategic allies. Integrate them into your TradingView platform and embark on a journey towards more informed and successful trading decisions.
Also always remember that trading involves inherent risks, and it’s crucial to exercise prudence and diligence in your approach. No indicator or combination of indicators guarantees profits or shields against losses. Traders must employ robust risk management strategies, including setting stop-loss orders, diversifying portfolios, and being mindful of leverage. Market conditions can change rapidly, and historical performance does not assure future results. Trade responsibly and only with funds you can afford to lose.
Experiment with these indicators to determine which ones align best with your trading style and preferences!


Comment (1)
Nice information. Is it possible to to import tradingview.com custom indicators scripts and adapt them to MT4 /MT5 platform?