

List of the Best TOP 7 Trend Forex Indicators
Navigating the Forex markets demands keen insights into trends, a critical factor that can make or break a trader’s success. In the dynamic world of currency trading, the right trend indicators act as guiding lights, helping traders decipher market movements and make informed decisions. In this comprehensive guide, we delve into the top 7 Trend indicators that have proven their mettle in the fast-paced realm of Forex. From classic tools like Moving Averages to sophisticated instruments like Ichimoku Cloud, we explore the features, use cases, and advantages of each, providing traders with a roadmap to identify and ride the waves of market trends. Whether you’re a seasoned trader looking to refine your strategy or a newcomer seeking reliable tools, this exploration of trend indicators is your key to mastering the art of trend analysis in Forex.
Table of Content
- Moving Average Ribbon Indicator
- Run Median Indicator
- RSI Extreme Zone Indicator
- PZ Bollinger Trend Indicator
- FXSSI.AutoTrendChannels
- OBV (On-Balance Volume) Indicator
- Super Trend Indicator
- Advanced ADX Indicator – (Bonus for NY2024)
All of the indicators discussed are suitable to MT4/5. Also, they are free to download and use. Each of these indicators brings a unique perspective to trend analysis, and the key is to experiment and find the combination that aligns with your trading style.
#1. Moving Average Ribbon Indicator
A fundamental yet powerful tool, MAs smooth out price data, providing a clear trend direction. Crosses between short-term and long-term MAs often signal potential trend start, continuations or finishing. Set up your periods between 5, 10, 20, 50, 100, 200 periods.
Number of Downloads: 26.4k
Score: 5
Timeframes: Suitable for all timeframes, especially effective on H1 and higher
Currency Pairs: Applicable to all major and minor pairs
Alerts: Yes
Buy Strategy
Confirm Trend Direction: Confirm a bullish trend with shorter MAs above longer MAs.
Price Above Ribbon: Ensure consistent trading above the Moving Average Ribbon.
Pullback Confirmation: Look for minor pullbacks where the price touches or approaches the ribbon.
Candlestick Confirmation: Use bullish patterns for added confirmation.
Buy Entry: Enter at the market price when all criteria align for a strong bullish trend.
Stop-Loss: Set below the recent swing low or the ribbon’s lower band for buy trades.
Take-Profit: Aim for a risk-reward ratio of at least 1:2. Set near the upper band or a significant resistance level.
Exit Strategy: Consider exiting on signs of reversal, like MA crossovers or a ribbon break in the opposite direction.
Sell Strategy
The same one, but mirror and opportune.
This strategy uses the Moving Average Ribbon’s visual cues to identify and trade trends effectively. Aligning the ribbon and monitoring price relationship provides a dynamic approach to trade execution.
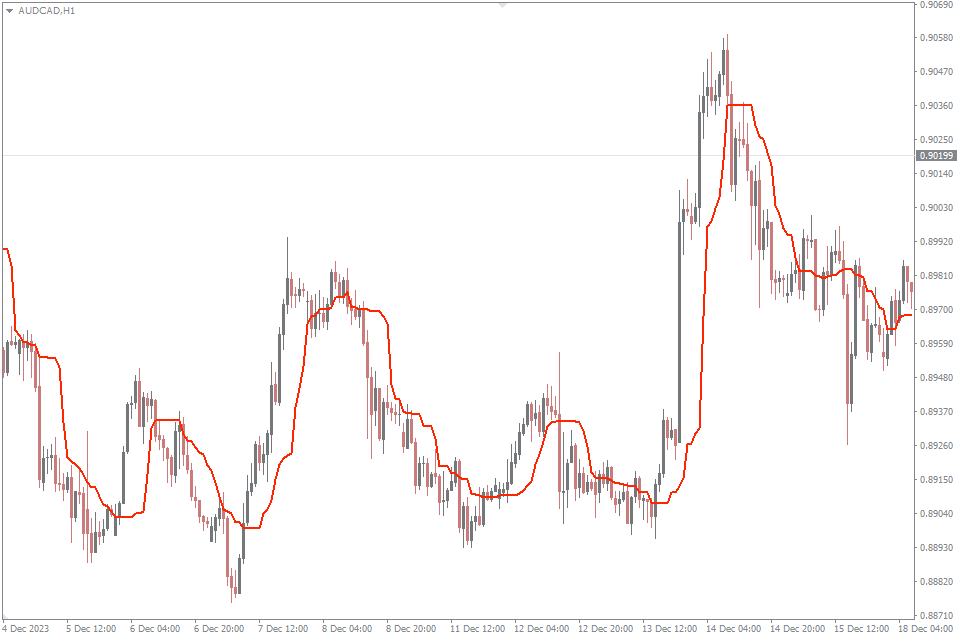
#2. Run Median Indicator
The Run Median Indicator, when used in trading strategies, is particularly effective in identifying the central tendency of price movements. It smoothens out fluctuations and provides a clearer view of the underlying trend.
Number of Downloads: 0.1k
Score: 5
Timeframes: Suitable for all timeframes
Currency Pairs: Applicable to all major and minor pairs
Alerts: Yes
Buy Strategy
Run Median Slope: Look for an upward slope in the Run Median, indicating uptrend.
Confirmation: Check for increased trading volume during the upward trend for additional confirmation.
Entry Point: Enter a buy trade at the market price when the price retest the upward median.
Stop-Loss: Set the stop-loss just below the recent swing low or a crossing median and price bar.
Take-Profit: Aim for a risk-reward ratio of at least 1:2. Set the initial take-profit level at the next resistance or based on the extension of the Run Median trend.
Exit Strategy: Exit the trade if there is a clear reversal signal, such as an upturn in the Run Median slope, or a significant decrease in buy volume.
Sell Strategy
The selling strategy is absolutely mirror and opposite to the buying strategy
The strategy involves observing the Run Median in conjunction with other trend indicators, such as RSI, Bollinger Bands, etc. Remember to backtest this strategy and adapt it to your risk tolerance and trading style.
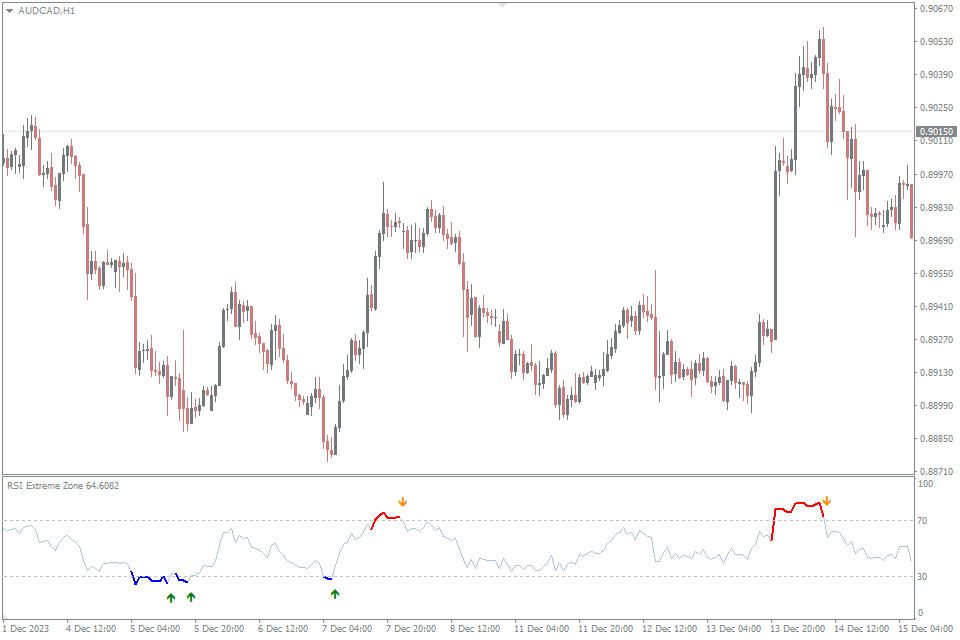
#3. RSI Extreme Zone Indicator
RSI measures the speed and change of price movements, helping identify overbought or oversold conditions. Traders often use RSI values above 70 or below 30 as key decision points.
Number of Downloads: 1.2k
Score: 5
Timeframes: Versatile, suitable for all timeframes
Currency Pairs: Applicable to all major and minor pairs
Alerts: Yes
Buy Strategy
Oversold Condition: Look for RSI trend values from the oversold zone to 30 and a rising price.
Confirmation: Confirm the signal from indicator and check for increased trading volume.
Wait for RSI Crossover: Enter when RSI crosses back above 30, signaling the upward trend.
Buy Entry: Execute a buy trade when all criteria align for a potential bullish trend.
Stop-Loss: Set below the recent swing low or a significant support level.
Take-Profit: Aim for a risk-reward ratio of at least 1:2. Set near the next resistance level or a predetermined target.
Exit Strategy: Consider exiting if there are signs of trend exhaustion or if RSI shows a potential reversal in overbuy zone.
Sell Strategy
The Sell strategy is similar and opposite to the buying strategy
The RSI Extreme Zone Indicator is a valuable tool for identifying overbought and oversold conditions, providing potential entry points for new trends. Combine it with other confirmatory signals for more robust trade decisions.
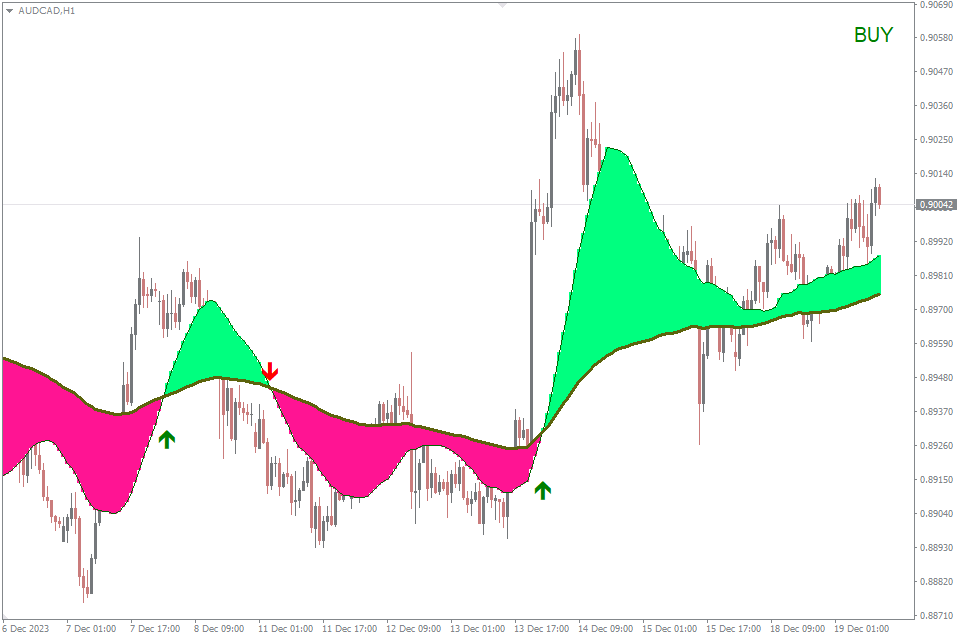
#4. PZ Bollinger Trend Indicator
Comprising a middle, upper, and lower band, Bollinger Bands adapt to volatility. Price touching the upper or lower band can signal potential overbought or oversold conditions, offering insights into market sentiment.
Number of Downloads: 0.9k
Score: 5
Timeframes: suitable for all timeframes, with a focus on H1 and higher for swing trading
Currency Pairs: Applicable to all major and minor pairs
Alerts: Yes
Buy Strategy
Confirm Trend Direction: Look for the price is over Low Bollinger Bands line and show bullish conditions.
Confirmation: Confirm the Indicator signal to Buy by ensuring that the price is above the band line.
Buy Entry: Execute a buy trade when all criteria align or enter a buy trade on a pullback or when the price touches the indicator trend line, suggesting a potential continuation of the uptrend..
Stop-Loss: Set below the lower Bollinger Band.
Take-Profit: Aim for a risk-reward ratio of at least 1:2. Set near the upper Bollinger Band or a predetermined target.
Exit Strategy: Consider exiting if there are signs of trend exhaustion or if the indicator give a signal to Sell.
Sell Strategy
The Sell strategy is the same like buy strategy but it is just opposite.
The PZ Bollinger Trend Indicator provides a systematic approach to identifying trends and potential end of trends. Combine it with other technical analysis tools for comprehensive trade decisions.
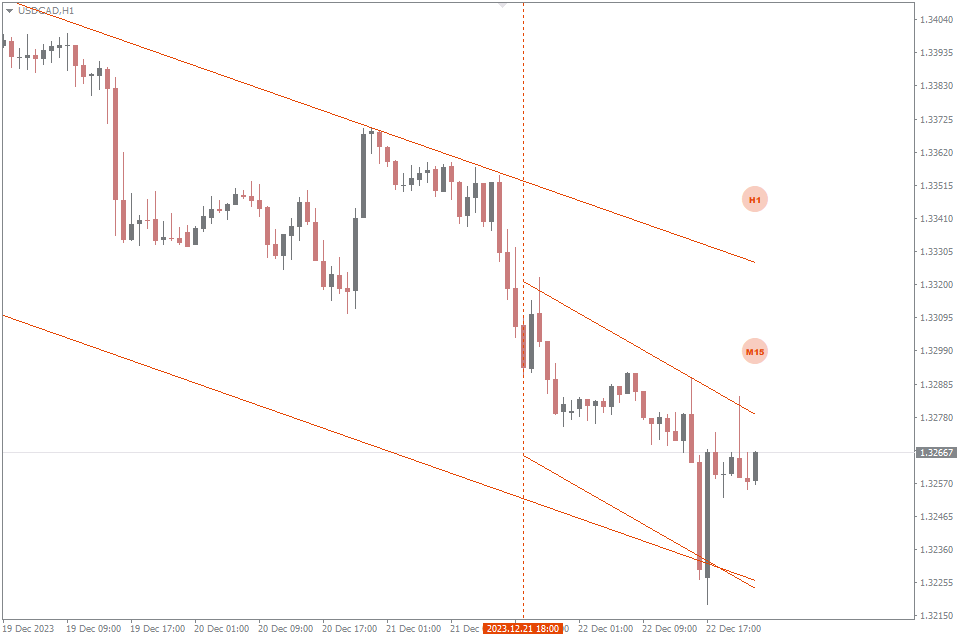
#5. FXSSI.AutoTrendChannels
The AutoTrendChannels indicator is a valuable tool for identifying trends and potential entry/exit points in the market. Here’s a trading strategy incorporating AutoTrendChannels.
Number of Downloads: 36.7k
Score: 4.3
Timeframes: Suitable for all timeframes
Currency Pairs: Applicable to all major and minor pairs
Alerts: Yes
Buy Strategy
Channel Slope: Look for an upward slope in the AutoTrendChannels, indicating a potential uptrend.
Confirmation: Confirm the strength of the trend using a momentum indicator like the Relative Strength Index (RSI) or Moving Average Convergence Divergence (MACD).
Candlestick Patterns: Look for bullish candlestick patterns, such as engulfing patterns or hammer patterns, to further validate the buy signal.
Entry Point: Open a buy trade at the market price when the price has re-pushed the lower uptrend line.
Stop-Loss: Set the stop-loss just below the lower channel line or the recent swing low.
Take-Profit: Aim for a risk-reward ratio of at least 1:2. Set the initial take-profit level at the upper channel line or a significant resistance level.
Exit Strategy: Exit the trade if there is a clear reversal signal, such as a downturn in the AutoTrendChannels slope, a crossover in the momentum indicator.
Sell Strategy
Similar to the buying situation but in reverse
Remember to backtest the strategy and adapt it to your risk tolerance and trading preferences.
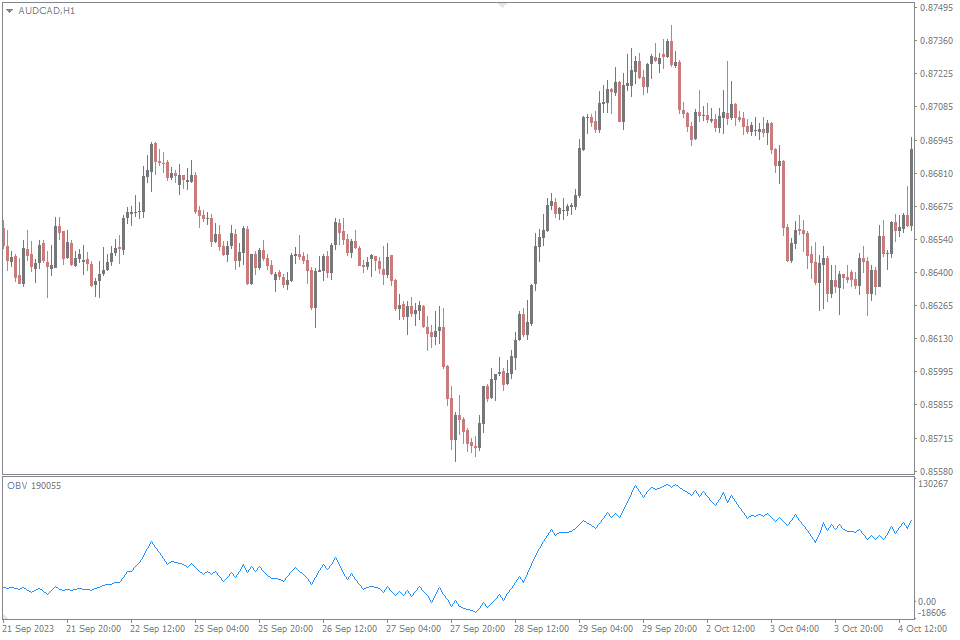
#6. OBV (On-Balance Volume) Indicator
The OBV (On-Balance Volume) indicator stands for balance volume, operates on the principle that price and volume exhibit a strong correlation, with volume leading price movements. The On-Balance Volume helps traders confirm the strength of a prevailing trend and identify potential trend reversals.
Number of Downloads: 12.4k
Score: 4.1
Timeframes: suitable for all timeframes, but particularly effective on daily charts for swing trading
Currency Pairs: Applicable to all major and minor pairs
Alerts: No
Buy Strategy
Confirm Trend Direction: Before considering a buy trade, confirm the direction of the bullish trend by chart analysing. The OBV works best when aligned with the broader market trend.
Look for Divergence: Identify situations where the price is making new lows, but the OBV is not confirming with new lows, indicating that despite the price reaching new lows, the buying volume is not diminishing.
Buy Signal: Enter a buy trade when you observe new high OBV is over previous high.
Confirmation with Price Action: Confirm the buy signal with supporting price action, such as a bullish candlestick pattern or a bounce off a key support level.
Stop-Loss: Place the stop-loss just below the recent swing low or the support level that aligns with your risk tolerance.
Take-Profit: Aim for a risk-reward ratio of at least 1:2. Set the initial take-profit level based on key support/resistance areas or the opposite end of the recent trend.
Exit Strategy: As the trade moves in your favor, consider using a trailing stop to lock in profits. Adjust the stop-loss based on significant price developments.
Sell Strategy
Same as in the case of buy strategy but the opposite
Remember, no strategy is foolproof, and it’s crucial to combine the OBV indicator with other forms of analysis for comprehensive decision-making.
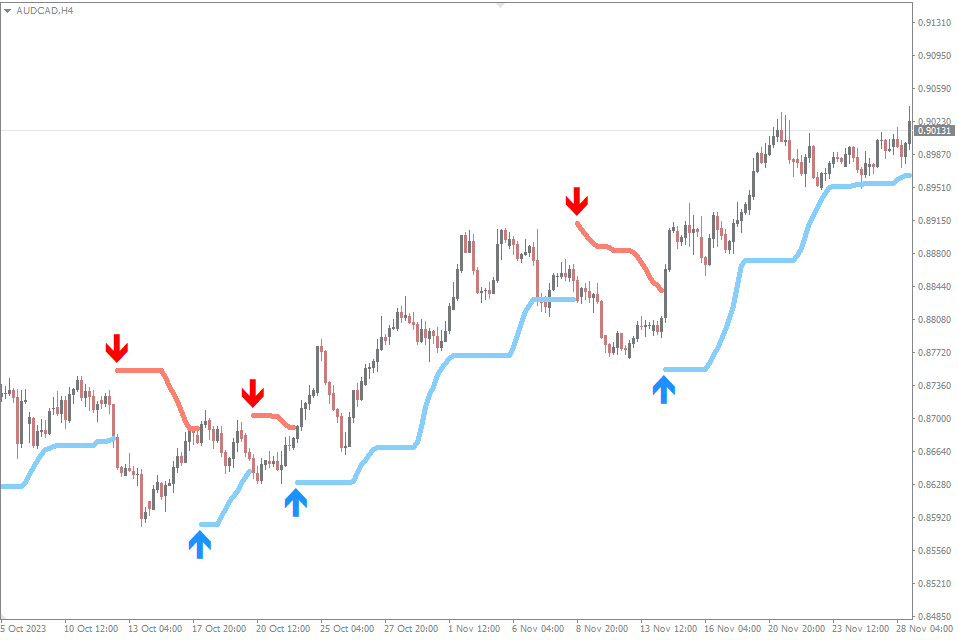
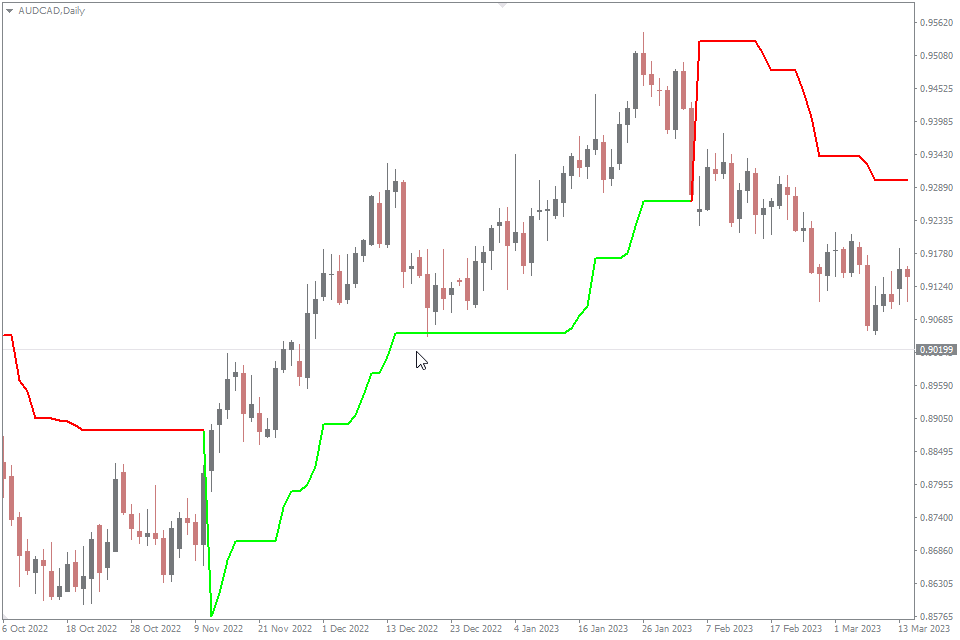
#7. Super Trend Indicator
This enhanced iteration of the Super Trend indicator provides insights into the prevailing trend status and facilitates an analysis of the potency or fragility of price movements. The Super Trend indicator is a powerful tool that helps traders identify the prevailing trend and potential entry and exit points
Number of Downloads: 5.4k
Score: 4.8
Timeframes: suitable for all timeframes
Currency Pairs: Applicable to all major and minor pairs
Alerts: No
Buy Strategy
Super Trend Below Price: Confirm that the Super Trend line is below the price candles and green. This indicates a bullish trend.
Pullback Entry: Look for a pullback in the price that touches or slightly crosses the Super Trend line. This could indicate a potential entry point
Confirmation (Optional): Optionally, use additional confirmation indicators like the Relative Strength Index or Moving Average Convergence Divergence to ensure the strength of the upward move.
Entry Point: Enter a buy trade at the market price or consider a pending order just above the recent price low.
Stop-Loss: Use the supertrend line as both the initial and trailing stop-level of your trade entries. Exit an order when the price breaks the trendline in an opposite direction to your trade entry.
Take-Profit: Aim for a risk-reward ratio of at least 1:2 or higher. Set the initial take-profit level near a significant resistance level.
Exit Strategy: Consider trailing your stop-loss to lock in profits as the trade moves in your favor. If the Supertrend line change color to red, consider closing the trade as it may indicate a potential trend reversal. If the price reaches your predefined take-profit level, close the trade.
Sell Strategy
Sell strategy is reversal
This Parabolic SAR strategy helps traders identify trend reversals and capture substantial price movements in the direction of the prevailing trend. Always remember to adapt the strategy to your risk tolerance and preferences.
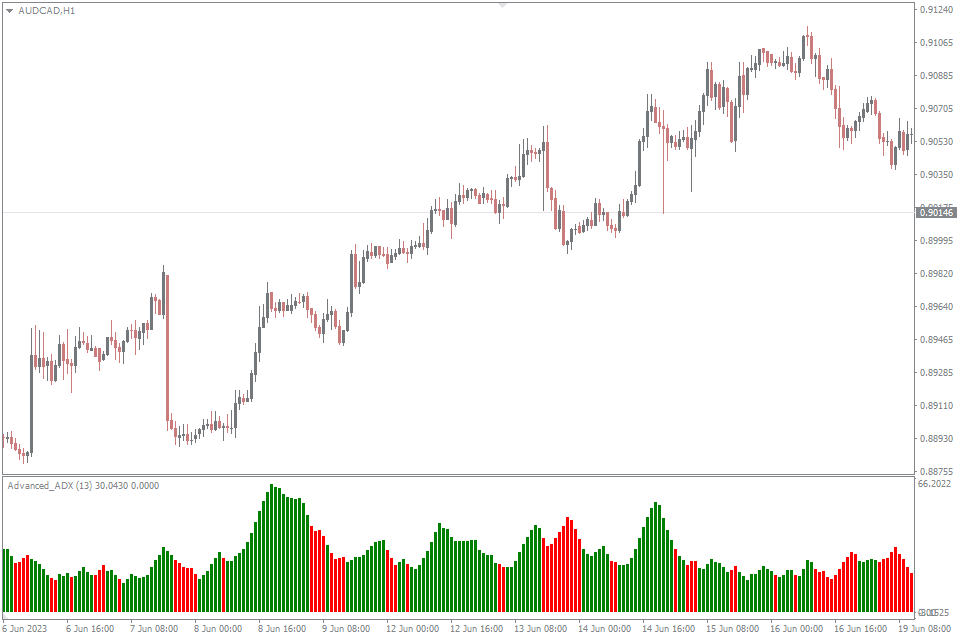
#8. Advanced ADX Indicator (Bonus for NY2024)
ADX quantifies trend strength, with readings above 25 indicating a strong trend. Traders use ADX to differentiate between trending and ranging market conditions.
Number of Downloads: 0.4k
Score: new updated
Timeframes: Suitable for all timeframes, but works exceptionally well on H1 and higher for a comprehensive view of the trend.
Currency Pairs: Applicable to all major and minor pairs
Alerts: No
Buy Strategy
Confirm Strong Uptrend: Look for the ADX green line to rise above 25, indicating the strength of the uptrend.
Pullback Entry: Enter a buy trade on a pullback when the price is near a support level or the 20-period EMA (Exponential Moving Average).
Stop-Loss: Set the stop-loss just below the recent swing low or the 20-period EMA.
Take-Profit: Aim for a risk-reward ratio of at least 1:2 or higher. Set the initial take-profit level at the recent swing high or a resistance level.
Exit Strategy: Consider exiting the trade if the ADX line starts to decline significantly, indicating a potential weakening of the trend. If the next line changed to red collor, it could signal a potential trend reversal.
Sell Strategy
Just reverse your buying strategy
It’s crucial to emphasize that this indicator doesn’t indicate the trend direction but rather the strength or weakness of a trend. However, it proves effective in tracking changes in trend strength and is particularly useful for identifying periods of sideways movement in the market.
Conclusion
In conclusion, mastering trend analysis in Forex requires a nuanced approach, and the use of effective indicators is paramount. The 8 trend indicators explored in this guide offer a spectrum of tools catering to various trading styles and preferences. However, achieving precision often involves a holistic strategy. Traders can enhance the reliability of their signals by employing combinations of these indicators. For instance, pairing Moving Averages with the new free to use and download Support&Resistant Indicator. This combination can provide a more comprehensive view of trend strength. Similarly, blending the power of Bollinger Bands with the Moving Average Convergence Divergence (MACD) can offer a robust confirmation mechanism.
Successful trading isn’t about relying on a single indicator; it’s about combinations. Remember, no indicator guarantees profits, and risk management remains paramount in successful forex trading. With these powerful trend indicators, you’re equipped to navigate the forex market with greater precision and confidence the synergy between them. So, experiment, refine, and discover the combination that aligns best with your trading objectives. Through strategic amalgamation, traders can bolster their decision-making process and navigate the ever-changing tides of the Forex market with greater confidence and accuracy.
Trend is your Friend!


Leave a Reply