

Most Popular Lagging Indicators
In the vast and ever-evolving landscape of forex trading, mastering the art of analysis and prediction is paramount for success. Traders employ various tools and techniques to decipher market trends, identify potential entry and exit points, and execute profitable trades. Among these tools, lagging indicators play a pivotal role, offering valuable insights into past price movements and helping traders make informed decisions about future market trend.
Lagging indicators, as the name suggests, lag behind price action and provide retrospective information about the Forex and others markets. Lagging indicators are often described as “output-oriented,” as they primarily serve to confirm patterns that have already occurred. Their forex signals significance lies in their ability to validate the presence of a trend or pattern, providing traders with confirmation rather than prediction. Unlike leading indicators that attempt to forecast future price movements, lagging indicators analyze historical data to confirm trend and signal potential entry or exit points. While lagging indicators may not predict market reversals with pinpoint accuracy, they offer valuable clues about the strength and direction of prevailing trend, enabling traders to devise effective trading strategies.
Table of Content
- Multi Time Frame Moving Averages Indicator
- PZ Bollinger Trend Indicator
- Tipu MACD Indicator
- RSI Extreme Zone Indicator
- FXSSI.ProfitRatio
- Advanced ADX Indicator
- SAR Color Indicator
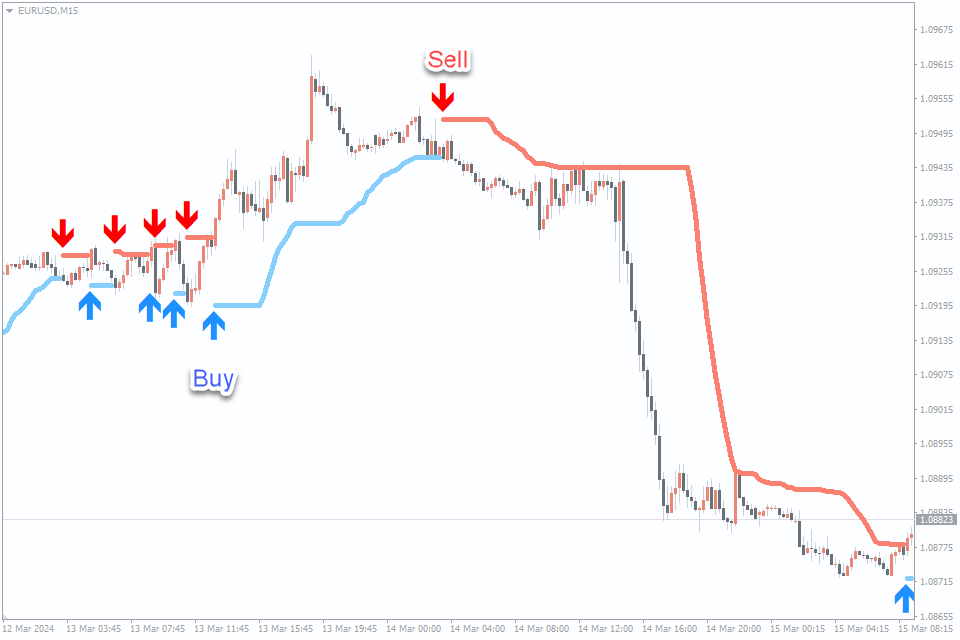
#1 Multi Time Frame Moving Averages Indicator
The Multi Time Frame Moving Averages (MTF MA) indicator is a powerful tool for traders seeking to analyze price trends across different timeframes simultaneously. By overlaying multiple moving averages of varying periods on a single chart, the MTF MA provides a comprehensive view of the market’s direction and momentum. Traders can customize the periods of the moving averages to align with their preferred trading timeframes, enabling them to spot trends and potential reversal points with precision for long or short positions.
Number of Downloads: 0.2k
Score: New
Timeframes: All
Repaints: No
Alerts: No
In trading platform MT4 / MT5, traders can use the Multi Time Frame Moving Averages to identify trend continuations and confirmations across multiple timeframes. For instance, they might observe the alignment of moving averages across different timeframes, such as the M30 period and H1 and H4 period moving averages, to confirm the strength of a trend. This confirmation can be crucial for making trading decisions, such as entering or exiting positions.
For entering positions, traders might look for instances where the shorter-term moving averages both cross above the longer-term ones, indicating a bullish trend, or vice versa for a bearish trend. Additionally, traders might wait for price to pull back to the moving averages before entering a trade, using the moving averages as dynamic support or resistance levels.
To manage risk, traders can set stop-loss orders below (for long positions) or above (for short positions) the moving averages to protect against adverse price movements or previous swing highs/lows.
Similarly, traders can set take-profit orders at predefined levels based on support and resistance zones or previous swing highs/lows.
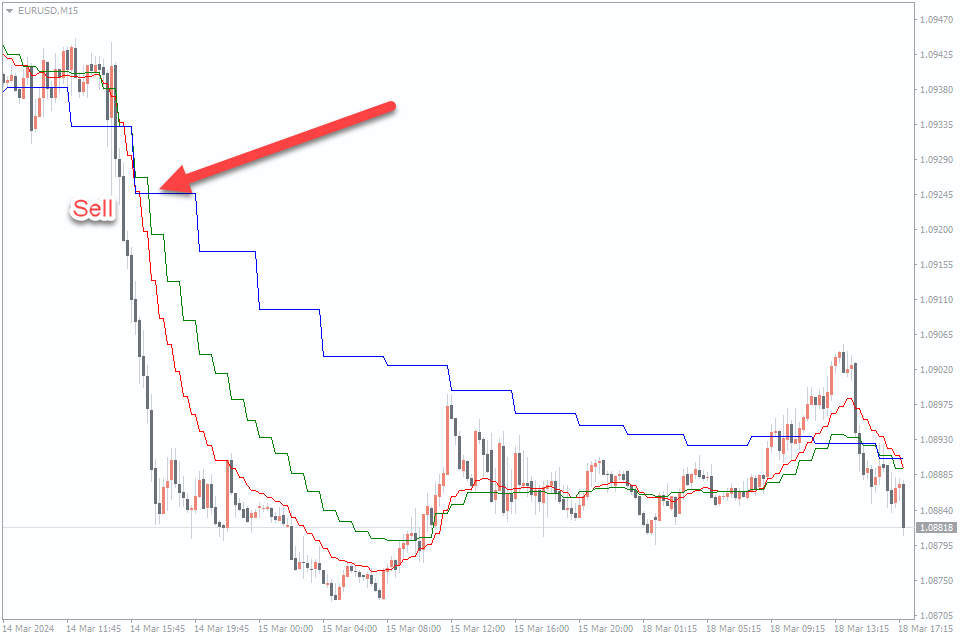
#2 PZ Bollinger Trend Indicator
The PZ Bollinger Trend Indicator is a versatile tool that utilizes Bollinger Bands to identify trends in the market. Its application involves analyzing price movements relative to the Bollinger Bands to determine trend direction and strength. Traders can use this indicator to enter trades when the price breaks out of the bands, signaling a potential continuation of the trend. Conversely, they may consider exiting positions when the price reverts back to the bands, indicating a possible reversal or consolidation.
Number of Downloads: 1.2k
Score: 5
Timeframes: All
Repaints: No
Alerts: Yes
For entering positions, traders can wait for the price to break out of the upper or lower Bollinger Band, depending on the direction of the trend. A breakout above the upper band suggests a bullish trend, while a breakout below the lower band suggests a bearish trend. Additionally, traders can look for confirmation signals, such as increased volume or momentum, to strengthen their entry decisions.
To manage risk, traders can set stop-loss orders above (for short positions) or below (for long positions) the recent swing high or low, respectively. This helps limit potential losses in case the market moves against the anticipated trend direction. As for take-profit levels, use risk-reward ratio more over 1:2. Also traders can target predefined levels based on support and resistance zones, Fibonacci extensions, or previous swing highs/lows to secure profits.
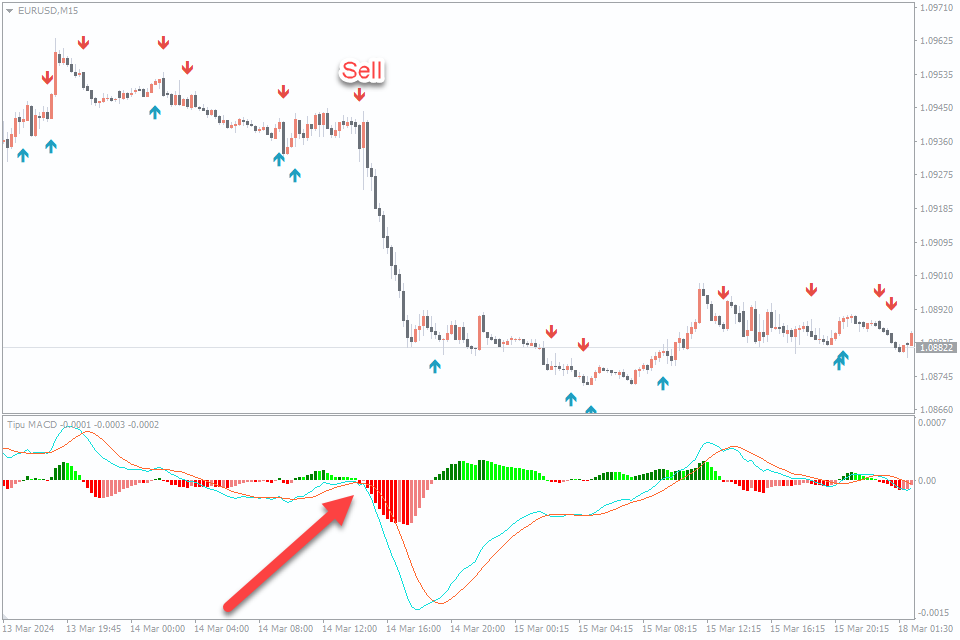
#3 Tipu MACD Indicator
The Tipu MACD (Moving Average Convergence Divergence) Indicator is a widely used tool for identifying trends and momentum in the market. Its application involves analyzing the convergence and divergence of two moving averages to determine potential entry and exit points for trades. Traders often utilize the MACD histogram and signal line to confirm trend direction and strength.
Number of Downloads: 0.4k
Score: 2
Timeframes: All
Repaints: No
Alerts: Yes
For entering positions, traders can look for bullish trading signal when the MACD line crosses above the signal line, indicating a potential uptrend. Conversely, bearish arrow occur when the MACD line crosses below the signal line, signaling a potential downtrend. Additionally, traders may consider entering trades when the MACD histogram bars increase in size, suggesting growing momentum in the market.
To manage risk, traders can set stop-loss orders below the recent swing low (for long positions) or above the recent swing high (for short positions). This helps limit potential losses in case the market moves against the anticipated trend direction. As for take-profit levels, traders can target predefined levels based on key support and resistance zones, Fibonacci extensions, or previous swing highs/lows to secure profits.
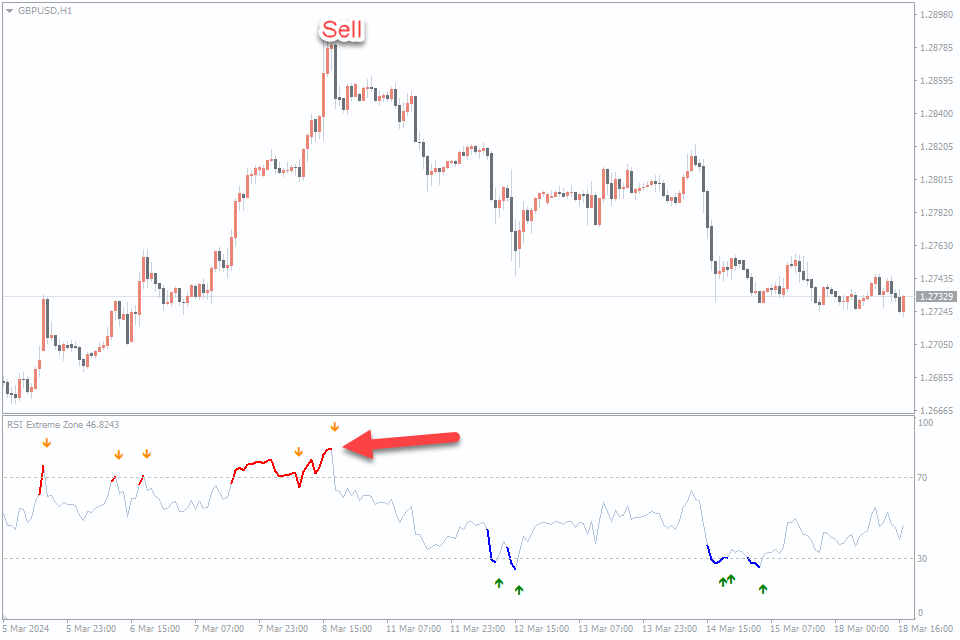
#4 RSI Extreme Zone Indicator
The RSI (Relative Strength Index) Indicator is a popular tool among traders for identifying overbought and oversold conditions in the market. Its application involves analyzing the RSI values to determine potential entry and exit points for trades. Traders often use the RSI to confirm trend reversals and assess the strength of price movements.
Number of Downloads: 1.6k
Score: 5
Timeframes: All
Repaints: No
Alerts: Yes
For entering positions, traders can look for bullish trading signal when the RSI crosses above the oversold threshold (typically 30), indicating a potential buying opportunity. Conversely, bearish signals occur when the RSI crosses below the overbought threshold (typically 70), suggesting a potential selling opportunity. Additionally, traders may consider entering trades when the RSI forms bullish or bearish divergence with price action, indicating a potential trend reversal.
To manage risk, traders can set stop-loss orders below the recent swing low (for long positions) or above the recent swing high (for short positions). This helps limit potential losses if the market moves against the anticipated trend direction. As for take-profit levels, traders can target predefined levels based on key support and resistance levels, Fibonacci retracements/extensions, or previous swing highs / lows to secure profits.
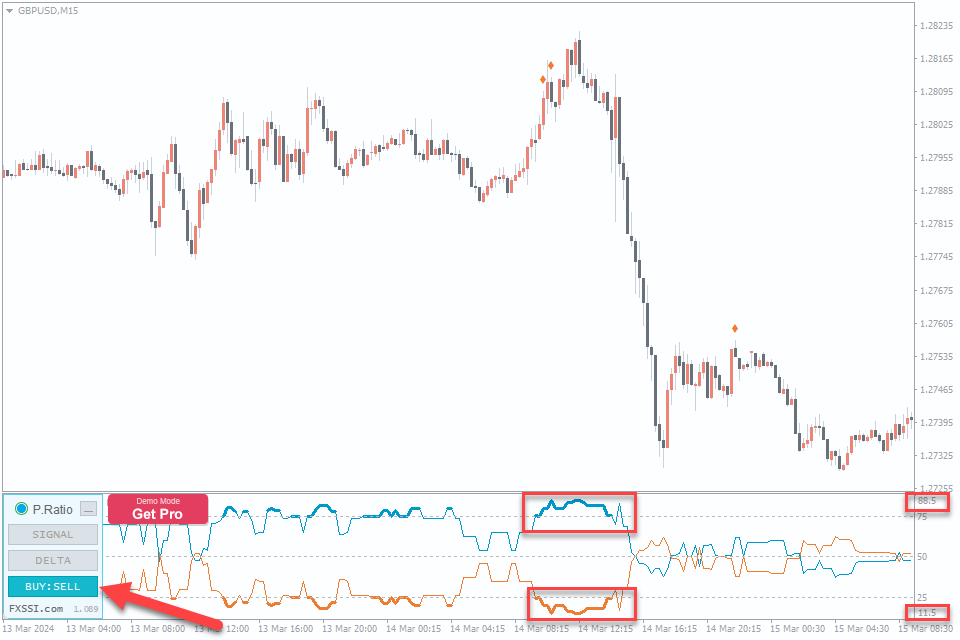
#5 FXSSI.ProfitRatio
The updated Profit Ratio Indicator now boasts a signal line feature, significantly enhancing its capacity to assess market volatility and provide valuable insights for traders. For optimal utilization of the Profit Ratio Indicator, it’s crucial to make use of its navigation tabs, such as “Signal,” “BUY: SELL,” and “DELTA,” ensuring that each function is applied appropriately.
Number of Downloads: 17k
Score: 4.1
Timeframes: All
Repaints: No
Alerts: Yes
To initiate or close a trade position, traders should await a signal from the orange peak within the trend reversal “Signal” segment. Furthermore, in the “BUY : SELL” section, confirming the trend’s strength aids in bolstering confidence when entering a trade.
Additionally, confining the indicator’s use to established currency pairs fosters dependable and precise outcomes. To mitigate risk, traders can implement stop-loss orders positioned below the most recent swing low for long positions or above the recent swing high for short positions. This strategic approach serves to curtail potential losses should the market deviate from the anticipated trend direction.
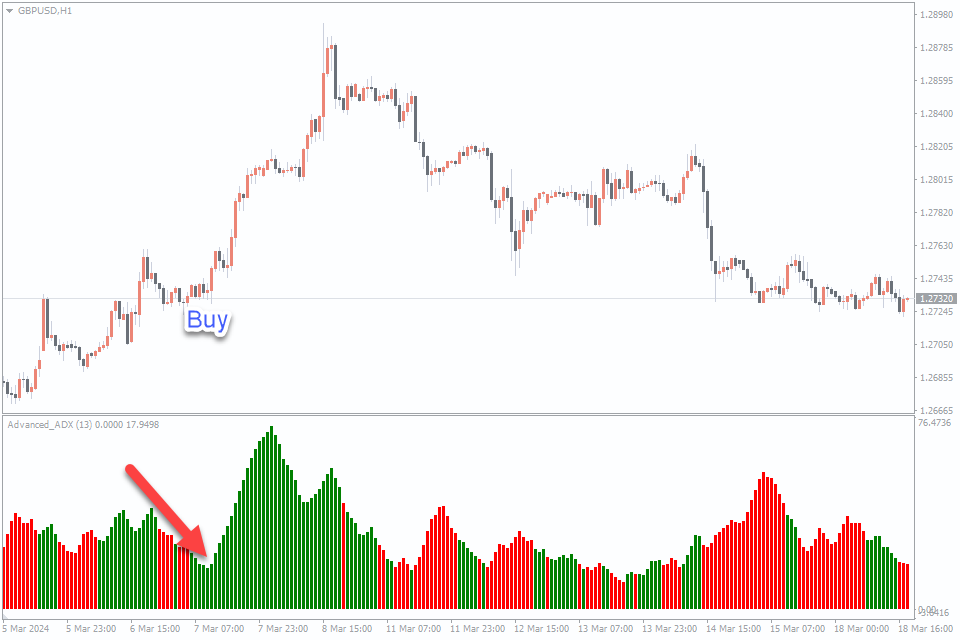
#6 Advanced ADX Indicator
The ADX (Average Directional Index) Indicator is a valuable tool for traders seeking to assess the strength of a trend in the market. Its application involves identifying the strength of the trend and potential entry and exit points for trades. Traders typically use the ADX to confirm the presence of a trend and assess its strength before entering a position.
Number of Downloads: 4.6k
Score: 5
Timeframes: All
Repaints: No
Alerts: No
For entering positions, traders may look for opportunities when the ADX indicates a strong trend by crossing above a predefined threshold level, typically set at 25 or higher. This suggests that the trend is gaining momentum, making it an opportune time to enter a trade in the direction of the prevailing trend. Additionally, traders may consider entering trades when the ADX line is rising, indicating increasing trend strength.
To manage risk, traders can set stop-loss orders below the recent swing low (for long positions) or above the recent swing high (for short positions). This helps limit potential losses if the market moves against the anticipated trend direction. As for take-profit levels, traders can target predefined levels based on key support and resistance zones, Fibonacci retracements/extensions, or previous swing highs/lows to secure profits or trend following.
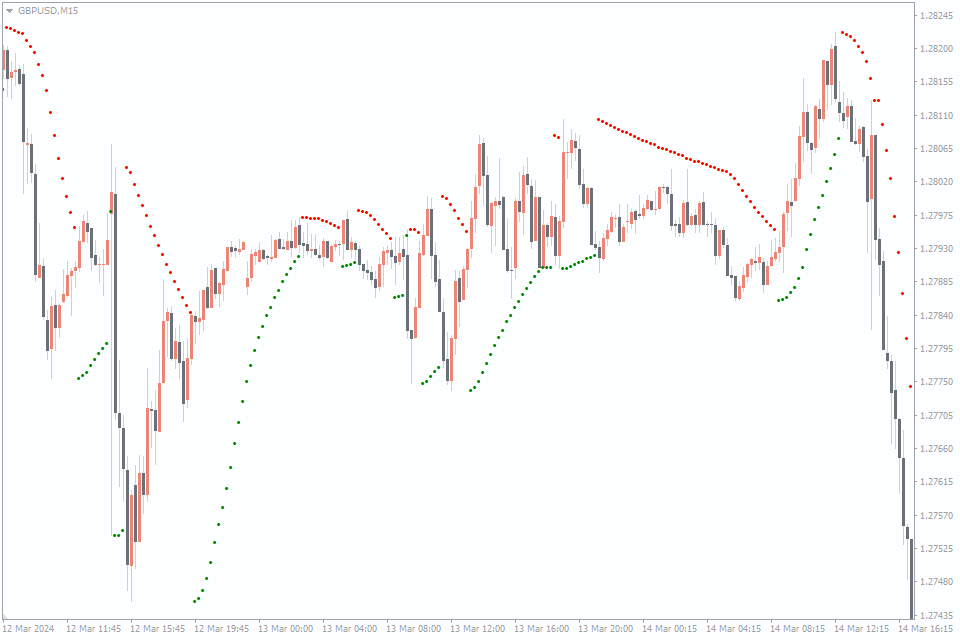
#7 SAR Color Indicator
The Parabolic SAR (Stop and Reverse) Indicator is a popular tool used by traders to identify potential trend reversals in the market. Its application involves providing entry and exit points, as well as setting stop-loss and take-profit levels for trades. Traders typically use the Parabolic SAR to confirm the direction of the prevailing trend and determine optimal entry points.
Number of Downloads: 0.4k
Score: New
Timeframes: All
Repaints: No
Alerts: No
For entering positions, traders may consider buying when the Parabolic SAR dots switch from being above the price to below it, indicating a potential bullish reversal. Conversely, traders may consider selling when the dots transition from below the price to above it, signaling a possible bearish reversal. This strategy helps traders enter trades in the direction of the prevailing trend momentum.
To manage risk with your maney managment, traders can set stop-loss orders below the recent swing low (for long positions) or above the recent swing high (for short positions), based on the Parabolic SAR dots. This helps limit potential losses if the market moves against the anticipated trend direction. As for take-profit levels, traders can target predefined levels based on key support and resistance levels, Fibonacci retracements/extensions, or previous swing highs/lows to secure profits.
Conclusion
The accessibility of trading tools is a crucial aspect of the forex market, and many traders rely on various indicators to enhance their buy and sell positions. Fortunately, most of the lagging indicators discussed in this article are readily available for download and use, with many of them offered for free for metatrader platfoems. Additionally, someone may require a nominal fee for access, but the investment is often minimal compared to the potential benefits they offer.
Ultimately, the debate between lagging and non-lagging indicators isn’t about which type is superior, but rather about how we leverage them in our trading strategies. Different traders may interpret the same indicator differently, leading to varying outcomes in their profit and loss (PnL) statements. All of them good for swing trading, day trading or scalping.
Lagging indicators advocate for a more conservative yet secure trading strategy. Instead of entering the market preemptively before a price shift, traders exercise patience and wait for the price movement to occur before making their investment decisions.
Emphasize the Importance of Lagging Indicators: Lagging indicators play a pivotal role in technical analysis, offering valuable insights into market trends and price movements. Their widespread popularity among traders underscores their effectiveness in identifying potential entry and exit points, as well as determining the strength of trends.
Highlight the Diverse Applications: Throughout the article, we’ve explored a variety of lagging indicators, each with its unique characteristics and applications. From the MACD to the RSI and Bollinger Bands, these indicators cater to different trading styles and preferences, providing traders with a versatile toolkit for analyzing forex market dynamics.
Encourage Further Exploration and Experimentation: As traders delve deeper into the world of lagging indicators, it’s essential to encourage ongoing exploration and experimentation. By continuously refining their strategies and incorporating new insights gained from lagging indicators, traders can enhance their trading performance and adapt to evolving market conditions.
Ultimately, the journey of mastering lagging indicators is one of continuous learning and refinement, leading to greater success in the forex market. To mitigate risk and make informed trading decisions, it’s advisable to use a combination of indicators to confirm trends before executing trades.


Leave a Reply