

10 Best Indicators for Gold Trading
Gold has long been revered as a symbol of wealth and stability, serving as a timeless store of value and a safe haven asset in times of economic uncertainty. In the world of trading, gold holds a special place, attracting investors and traders seeking to capitalize on its unique properties and price movements. To navigate the complexities of gold trading and make informed decisions, traders often rely on a variety of technical indicators. These indicators provide valuable insights into market trends, momentum, volatility, and potential reversal points, helping traders formulate effective trading strategies. In this comprehensive guide, we’ll explore the ten best indicators for gold trading, offering insights and strategies to help traders maximize their profits and minimize their risks in the dynamic world of precious metals trading. Whether you’re a seasoned trader or a newcomer to the gold market, these indicators will serve as invaluable tools in your quest for trading success.
Table of Content
- Hull Moving Average Arrows Indicator
- RSI Demarker Superposition Indicator
- MACD Divergence Indicator
- Bollinger Bands Bicolor Indicator
- Elliot Fibonacci Indicator
- FXSSI. Auto Trend Channels
- ATR Stop Indicator
- Auto Support and Resistance Zones Indicator
- FXSSI. Better Volume
- FXSSI. Supply and Demand
Numerous indicators are free accessible for download and integration into the MT4/MT5 platforms, making them a wise option for maneuvering through the complexities of the Gold trading. Known for their straightforwardness and intuitive interfaces, these indicators streamline the setup process and enable easy utilization, guaranteeing a smooth and hassle-free trading journey.
#1 Hull Moving Average Arrows Indicator
The Hull Moving Average (HMA) Arrows Indicator is a useful tool for gold trading, providing clear signals to identify trends and potential reversal points.
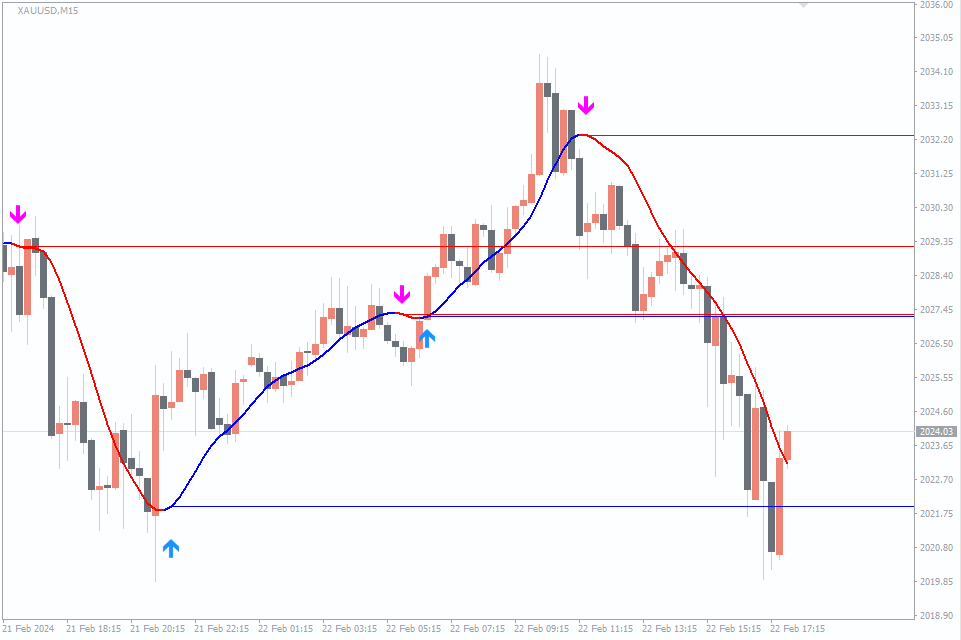
Strategy for Hull Moving Average Arrows Indicator
Trend Following: Use the direction of the arrows to follow the trend in the gold market. When upward arrows are displayed, consider buying gold or holding long positions. Conversely, when downward arrows are displayed, consider selling gold or holding short positions.
Reversal Trading: Pay attention to changes in the direction of the arrows as potential signals for trend reversals. When the arrows change from upward to downward, it may indicate a reversal from a bullish to a bearish trend, and vice versa. Consider entering or exiting positions based on these reversal signals.
#2 RSI Demarker Superposition Indicator
The RSI is a popular indicator for gold trading due to its ability to identify overbought and oversold conditions in the market. Here’s how you can apply the RSI indicator and develop a strategy for gold trading.
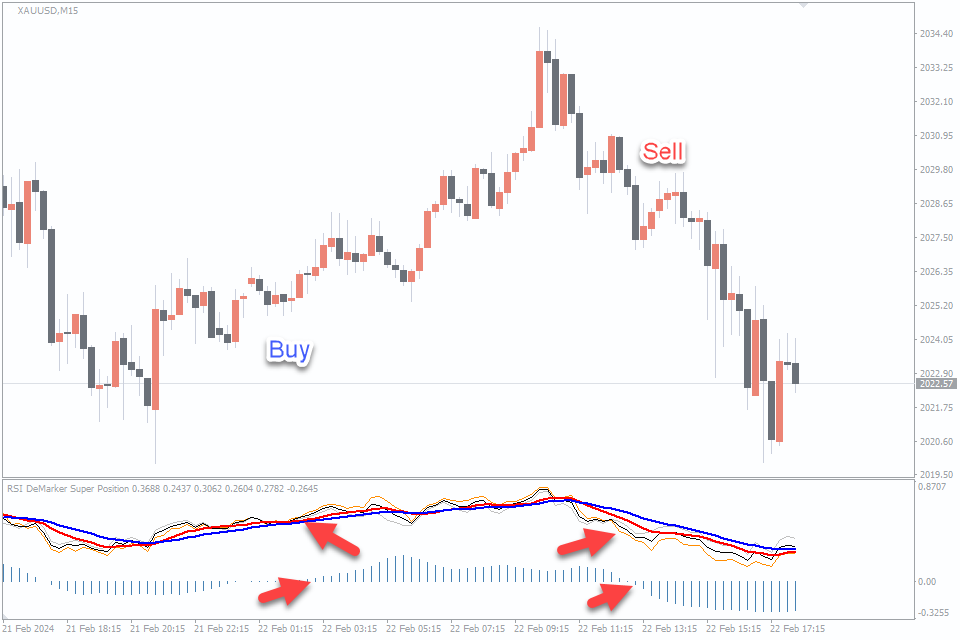
Strategy for RSI Demarker Superposition Indicator
Overbought and Oversold Levels: Look for opportunities to buy gold when the RSI is oversold (below 30) and sell when the RSI is overbought (above 70). When the RSI crosses above 30 from below, it may signal a buying opportunity, and when it crosses below 70 from above, it may indicate a selling opportunity.
Divergence Analysis: Pay attention to divergences between the RSI and the price of gold. Bullish divergence occurs when the price of gold makes lower lows while the RSI makes higher lows, suggesting a potential bullish reversal. Bearish divergence occurs when the price of gold makes higher highs while the RSI makes lower highs, indicating a potential bearish reversal.
Trend Confirmation: Use the RSI to confirm the strength of a trend in the gold market. In an uptrend, the RSI tends to stay above 50, while in a downtrend, it tends to stay below 50. Look for opportunities to buy when the RSI remains above 50 during an uptrend and sell when it remains below 50 during a downtrend.
#3 MACD Divergence Indicator
Its applicability lies in its ability to identify trends and potential trend reversals in the gold market. Traders can use the MACD to confirm the direction of the trend and determine entry and exit points.

Strategy for MACD Divergence Indicator
Trend Confirmation: Use the MACD to confirm the direction of the trend in the gold market. When the MACD line crosses above the signal line, it indicates a bullish trend, suggesting opportunities to buy gold. Conversely, when the MACD line crosses below the signal line, it signals a bearish trend, suggesting opportunities to sell gold.
Divergence Analysis: Look for divergences between the MACD and the price of gold. Bullish divergence occurs when the price of gold makes lower lows while the MACD makes higher lows, suggesting a potential bullish reversal. Bearish divergence occurs when the price of gold makes higher highs while the MACD makes lower highs, indicating a potential bearish reversal.
Entry and Exit Points: Use the MACD histogram to identify entry and exit points. When the histogram bars are increasing in size, it indicates strengthening momentum in the trend, suggesting a favorable entry point. Conversely, when the histogram bars are decreasing in size, it suggests weakening momentum, signaling a potential exit point.
#4 Bollinger Bands Bicolor Indicator
Bollinger Bands are versatile tools in gold trading, offering insights into volatility, trend direction, and potential reversals. By tracking the width and positioning of the bands relative to price movements, traders can gauge market conditions and make informed decisions.
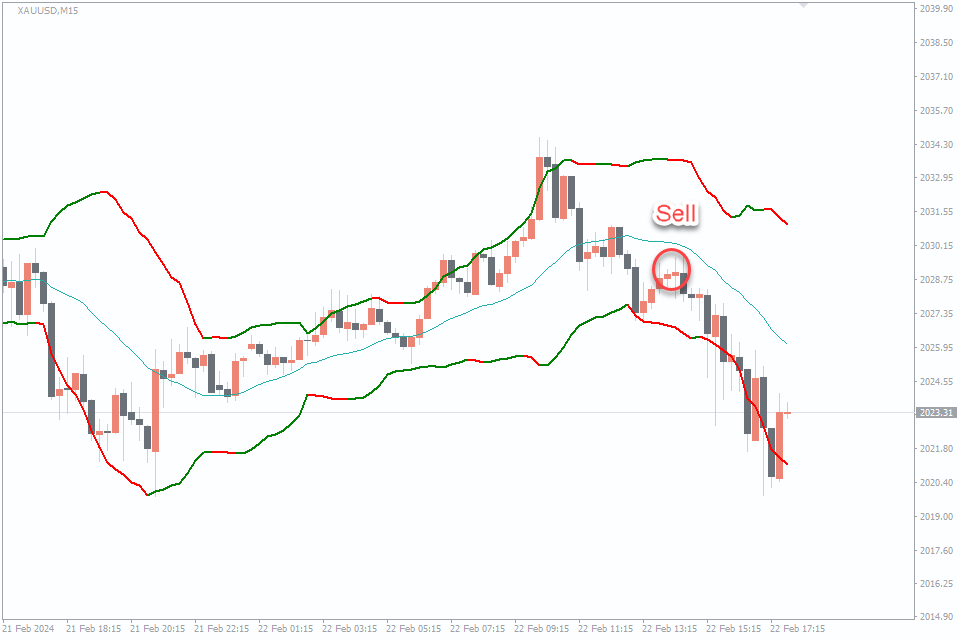
Strategy for Bollinger Bands Bicolor Indicator
Riding the Trend: Use the direction of the price relative to the middle band to ride the trend in the gold market. When the price is consistently trading above the middle band, consider buying gold or holding long positions. Conversely, when the price is consistently trading below the middle band, consider selling gold or holding short positions.
Bollinger Band Squeeze: Monitor periods of low volatility characterized by the contraction of the Bollinger Bands (known as a squeeze). A Bollinger Band squeeze often precedes a significant price movement, signaling a period of consolidation before a breakout or breakdown. Consider entering positions when the bands begin to expand again, indicating the potential start of a new trend.
Reversal Trading: Watch for price action near the upper or lower bands for potential reversal signals. Look for candlestick patterns or other technical indicators that confirm the potential reversal, such as divergence with oscillators like the Relative Strength Index (RSI) or the Moving Average Convergence Divergence (MACD).
#5 Elliot Fibonacci Indicator
The Fibonacci retracement tool is a powerful indicator for gold trading, providing valuable insights into potential price levels based on key Fibonacci ratios. Traders often use Fibonacci retracements to identify support and resistance levels, as well as to anticipate potential reversal points in the market.
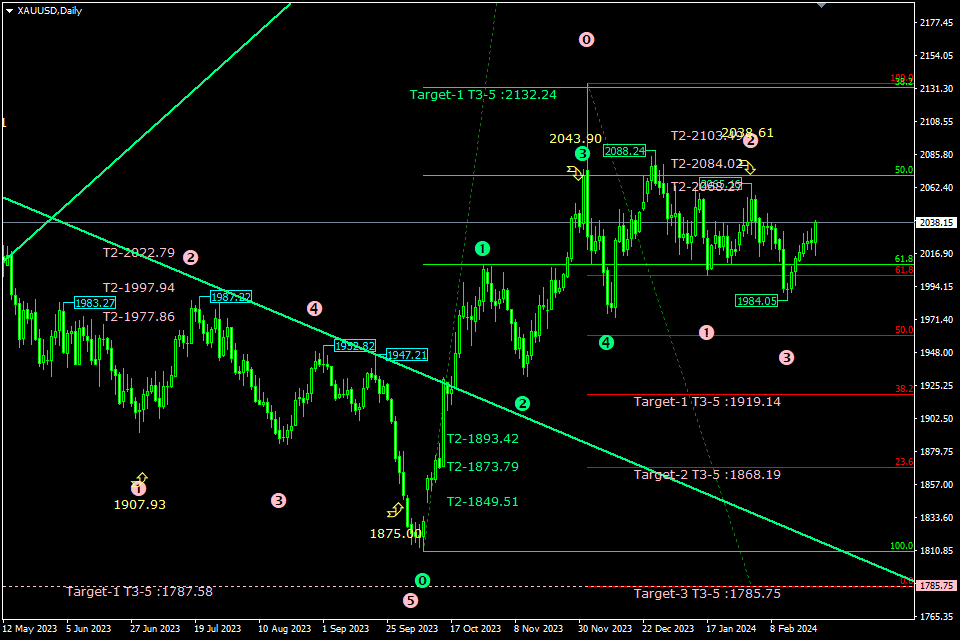
Strategy for Elliot Fibonacci Indicator
Identify Trend: Before applying the Fibonacci retracement tool, it’s essential to identify the prevailing trend in the gold market. This can be done using other technical indicators or chart patterns. In an uptrend, traders look for opportunities to buy near support levels, while in a downtrend, they focus on selling near resistance levels.
Select Swing Points: Once the trend direction is determined, identify significant swing points on the price chart. These swing points should represent the extremes of the recent price movement, such as a recent high in an uptrend or a recent low in a downtrend.
Apply Fibonacci Levels: With the swing points identified, apply the Fibonacci retracement tool to the price chart. The tool will automatically plot key Fibonacci retracement levels, such as 23.6%, 38.2%, 50%, 61.8%, and 100%.
Analyze Price Reaction: Once the Fibonacci retracement levels are plotted, observe how the price reacts around these levels. In an uptrend, traders look for buying opportunities near the Fibonacci support levels, while in a downtrend, they watch for selling opportunities near the Fibonacci resistance levels.
Confirm with Other Indicators: To increase the reliability of Fibonacci retracement levels, consider confirming signals from other technical indicators or candle patterns. This could include trendlines, moving averages, or momentum oscillators. A convergence of signals can strengthen the validity of potential trade setups.
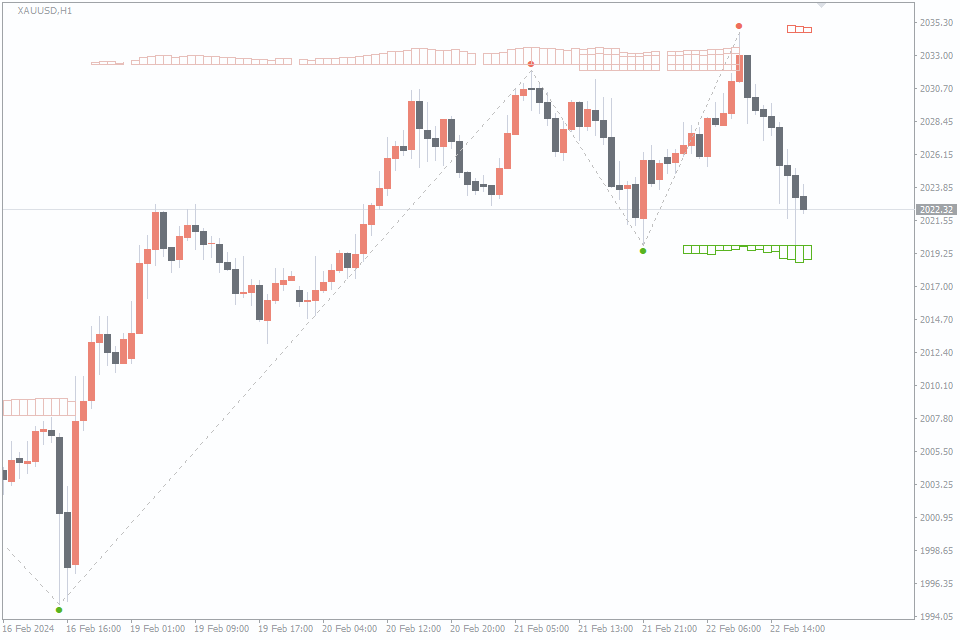
#6 FXSSI. Auto Trend Channels
The Auto Trend Channels indicator is a valuable tool for gold trading, providing traders with visual representations of trend channels that can help identify potential entry and exit points in the market. This indicator automatically plots trendlines based on recent price action, making it easier for traders to visualize trend direction and potential areas of support and resistance.
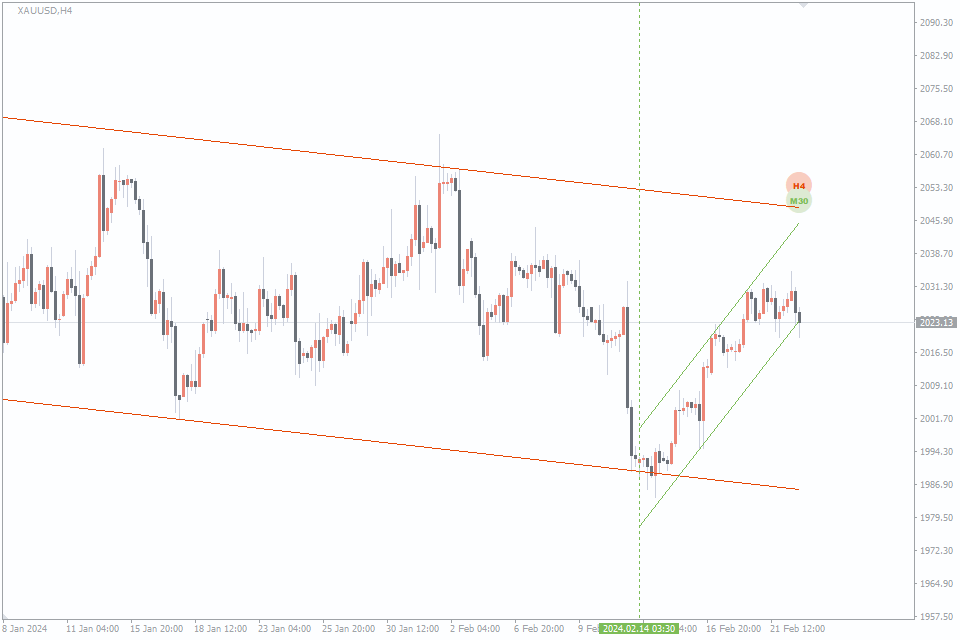
Strategy for FXSSI. Auto Trend Channels
Identify Trend Direction: The first step in using the Auto Trend Channels indicator is to identify the prevailing trend direction in the gold market. Traders can do this by observing the slope of the trendlines plotted by the indicator. An upward sloping trendline suggests an uptrend, while a downward sloping trendline indicates a downtrend.
Look for Channel Breakouts: Once the trend direction is identified, traders can look for potential trading opportunities when the price breaks out of the trend channel plotted by the indicator. A breakout above the upper trendline may signal a bullish continuation, while a breakout below the lower trendline may indicate a bearish continuation.
Wait for Confirmation: Before entering a trade based on a trend channel breakout, it’s important to wait for confirmation from other technical indicators or chart patterns. This could include signals from momentum oscillators, such as the Relative Strength Index (RSI) or the Moving Average Convergence Divergence (MACD), or confirmation from candlestick patterns.
#7 ATR Stop Indicator
The ATR Stop Loss indicator is a powerful tool for managing risk and setting stop-loss levels in gold trading. It utilizes the Average True Range (ATR) to dynamically adjust stop-loss levels based on market volatility, helping traders protect their positions from adverse price movements while allowing for potential profit maximization.
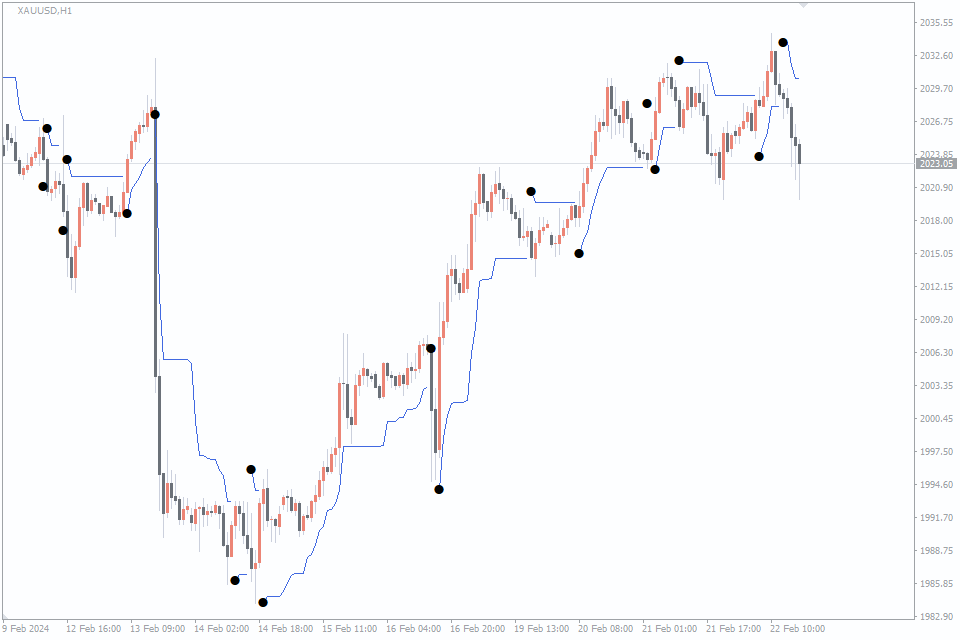
Strategy for ATR Stop Indicator
Determine ATR Period: The first step in using the ATR Stop Loss indicator is to determine the appropriate ATR period based on the timeframe of your gold trading strategy. A longer ATR period will result in wider stop-loss levels, suitable for longer-term trading, while a shorter ATR period will result in tighter stop-loss levels, suitable for shorter-term trading.
Set Initial Stop Loss: Once the ATR period is determined, traders can calculate the initial stop-loss level by multiplying the current ATR value by a predefined multiplier. For example, if the current ATR value is 10 and the multiplier is 2, the initial stop-loss level would be set at 20 points away from the entry price.
Trail Stop Loss: As the trade progresses in the desired direction, traders can use the ATR Stop Loss indicator to trail their stop-loss levels to lock in profits and protect against potential reversals. This involves continuously recalculating the stop-loss level based on the latest ATR value and adjusting it accordingly.
Adjust for Volatility: One of the key advantages of the ATR Stop Loss indicator is its ability to adapt to changes in market volatility. During periods of high volatility, the ATR value will increase, resulting in wider stop-loss levels to accommodate larger price swings. Conversely, during periods of low volatility, the ATR value will decrease, resulting in tighter stop-loss levels.
Combine with Other Indicators: To increase the effectiveness of the ATR Stop Loss indicator, consider combining it with other technical analysis tools such as trend indicators, support and resistance levels, and candlestick patterns. This can help confirm trade setups and improve overall trading accuracy.
#8 Auto Support and Resistance Zones Indicator
Auto Support and Resistance Zones indicator is a powerful tool for gold trading, offering valuable insights into key price levels where buying and selling pressure is likely to emerge. These support and resistance zones are automatically plotted on the price chart based on historical price data, making it easier for traders to identify potential reversal points, entry and exit levels, and areas of price congestion.
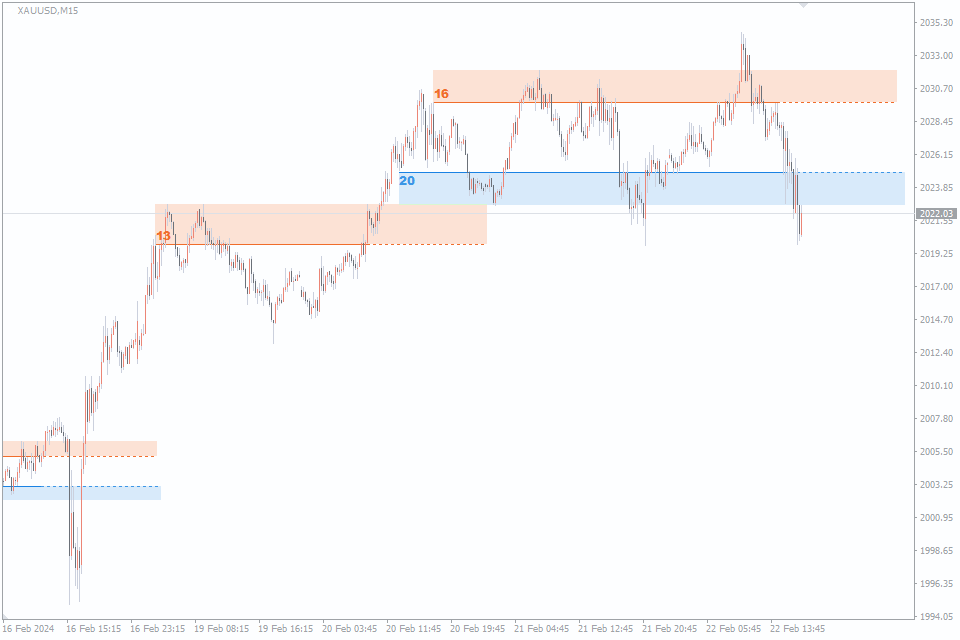
Strategy for Auto Support and Resistance Zones Indicator
Identifying Key Price Levels: The Auto Support and Resistance Zones indicator identifies significant price levels where the market has previously experienced buying or selling pressure. These levels act as barriers that can influence the direction of price movements. In gold trading, traders can use these support and resistance zones to identify potential entry and exit points, as well as areas to set stop-loss and take-profit orders.
Trading Breakouts: Breakout trading is a popular strategy in gold trading, and the Auto Support & Resistance Zones indicator can help traders identify breakout opportunities. When the price of gold breaks above a resistance zone or below a support zone with strong volume and momentum, it signals a potential trend continuation. Traders can enter long or short positions accordingly, aiming to capitalize on the momentum generated by the breakout.
Confirming Trend Reversals: Support and resistance zones can also help traders identify potential trend reversals in the gold market. When the price of gold approaches a support zone during a downtrend or a resistance zone during an uptrend, traders can look for signs of price rejection or reversal patterns, such as candlestick patterns or divergence signals from oscillators. Confirmation of a reversal at these key price levels can provide high-probability trading opportunities.
Setting Stop-loss and Take-profit Levels: The Auto Support and Resistance Zones indicator can assist traders in setting effective stop-loss and take-profit levels for their gold trades. By placing stop-loss orders below support zones for long positions and above resistance zones for short positions, traders can limit their potential losses and protect their capital in case the market moves against them. Similarly, take-profit orders can be set near key support or resistance zones to capture profits as the price approaches these levels.
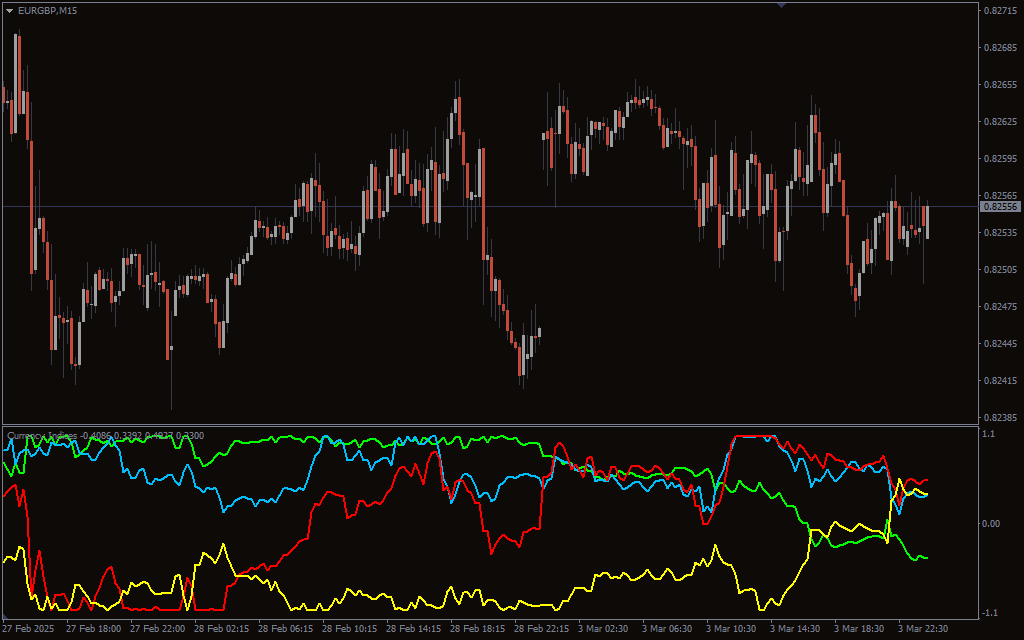
#9 FXSSI.Better Volume
The Volume indicator can be a valuable tool for gold trading, providing insights into the strength and validity of price movements. While gold trading is often associated with lower volume compared to other markets like stocks, analyzing volume patterns can still offer valuable information to traders.
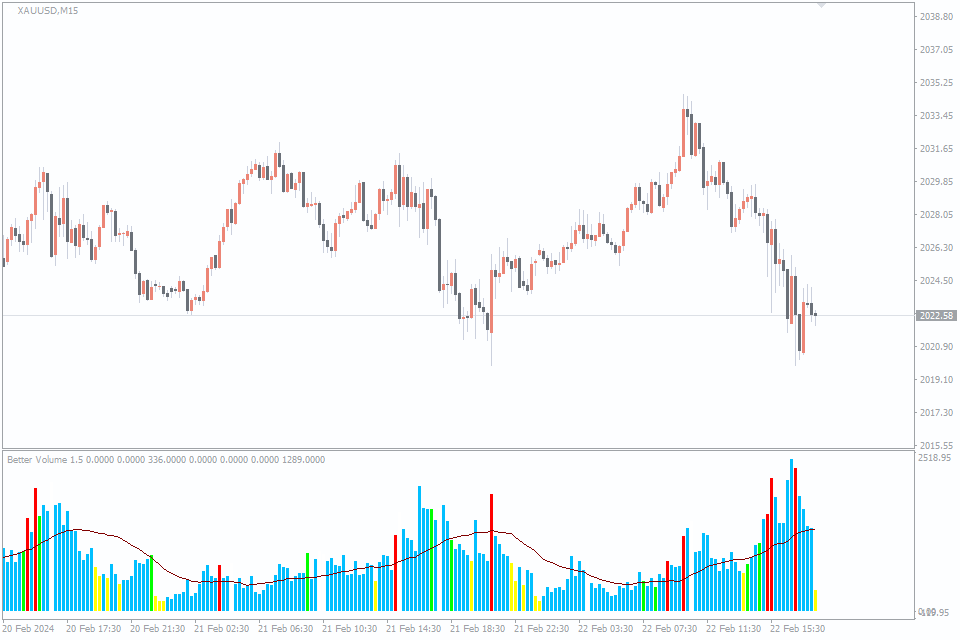
Strategy for FXSSI.Better Volume
Confirming Breakouts: One way to utilize the Volume indicator in gold trading is to confirm breakout patterns. When the price of gold breaks above or below key support or resistance levels, traders can look for confirmation through an increase in trading volume. A surge in volume during a breakout suggests strong market participation and increases the likelihood of a sustained price movement in the breakout direction.
Analyzing Reversals: Volume can also be useful in identifying potential trend reversals in gold trading. When the price of gold approaches a significant support or resistance level and volume begins to decline, it may signal a lack of conviction among market participants. This divergence between price and volume can serve as an early warning sign of a potential trend reversal, prompting traders to exercise caution or consider taking contrarian positions.
Evaluating Trend Strength: Additionally, traders can use volume to assess the strength of trends in gold trading. During an uptrend, increasing volume on upward price movements confirms the strength of the trend and suggests continuation. Conversely, decreasing volume during upward price movements may indicate weakening momentum and potential trend exhaustion. Similarly, in a downtrend, increasing volume on downward price movements validates the downtrend, while decreasing volume signals potential trend reversal or consolidation.
Filtering False Signals: Volume can help traders filter out false signals and distinguish between genuine price movements and market noise. When a price movement occurs on low volume, it may lack conviction and be more susceptible to reversal. Conversely, price movements accompanied by high volume are more likely to be sustained and indicative of genuine market sentiment.
Combining with Other Indicators: To enhance the effectiveness of the Volume indicator, traders can combine it with other technical analysis tools such as moving averages, trend lines, and momentum oscillators. By integrating volume analysis with other indicators, traders can gain a more comprehensive understanding of market dynamics and improve their trading decisions.
#10 FXSSI. Supply and Demand
The Supply and Demand Indicator is a special powerful tool for gold trading, enabling traders to identify key areas of supply and demand imbalance in the market. These zones represent levels where significant buying or selling pressure has occurred in the past, providing valuable insights into potential reversal points, entry and exit levels, and areas of price congestion.
Strategy for FXSSI.Supply and Demand
Identifying Supply and Demand Zones: The Supply & Demand Indicator automatically plots supply and demand zones on the price chart based on historical price data. Supply zones are areas where selling pressure exceeds buying pressure, leading to potential reversals or price declines. Demand zones, on the other hand, are areas where buying pressure exceeds selling pressure, leading to potential reversals or price advances. Traders can use these zones to anticipate price movements and plan their trades accordingly.
Trading Reversals: One of the most common strategies when using the Supply & Demand Indicator is trading reversals at supply and demand zones. When the price of gold approaches a supply zone during an uptrend or a demand zone during a downtrend, traders can look for signs of price rejection or reversal patterns, such as candlestick patterns or divergence signals from oscillators. Confirmation of a reversal at these key zones can provide high-probability trading opportunities.
Trading Breakouts: Another strategy is trading breakouts from supply and demand zones. When the price of gold breaks above a supply zone or below a demand zone with strong volume and momentum, it signals a potential trend continuation. Traders can enter long or short positions accordingly, aiming to capitalize on the momentum generated by the breakout. It’s important to wait for confirmation of the breakout to avoid false signals.
Setting Stop-loss and Take-profit Levels: The Supply and Demand Indicator can assist traders in setting effective stop-loss and take-profit levels for their gold trades. By placing stop-loss orders below demand zones for long positions and above supply zones for short positions, traders can limit their potential losses and protect their capital in case the market moves against them. Similarly, take-profit orders can be set near key supply or demand zones to capture profits as the price approaches these levels.
Combining with Other Indicators: To enhance the effectiveness of the Supply & Demand Indicator, traders can combine it with other technical analysis tools such as trend lines, moving averages, and momentum oscillators. By integrating multiple indicators, traders can gain a more comprehensive understanding of market dynamics and improve their trading decisions.
Conclusion
In conclusion, the ten best indicators for gold trading offer a diverse array of tools to analyze and interpret market dynamics. Each indicator brings its unique insights into price movements, trends, and potential reversal points in the gold market. However, mastering gold trading requires more than just relying on individual indicators. It involves understanding how to effectively combine these indicators to confirm signals and increase trading accuracy.
Furthermore, risk management remains paramount in gold trading. While indicators provide valuable information, they are not foolproof and can sometimes produce false signals. Therefore, traders must implement robust risk management strategies, including setting stop-loss orders, diversifying their portfolio, and managing position sizes appropriately.
By incorporating the ten best indicators for gold trading into a comprehensive trading strategy and prioritizing risk management, traders can navigate the gold market with greater confidence and precision. It’s essential to experiment with different indicators, refine trading strategies, and adapt to changing market conditions to achieve long-term success in gold trading.


Leave a Reply