

Best Leading Indicators for Day Trading Forex with MT4/MT5: The Ultimate List
Forex day trading is a fascinating and potentially highly lucrative activity, but it requires a deep understanding of the markets and a solid strategy.
Among the tools that day traders rely on to make informed decisions, leading indicators hold a place of prominence. These technical indicators, designed to predict future price movements, can give traders a heads-up before a new trend or reversal occurs.
This article explores the intricacies of these crucial decision-making tools, offering insights into their pros and cons.
Understanding Leading Indicators
In the realm of technical analysis, indicators are divided into two main categories: leading and lagging.
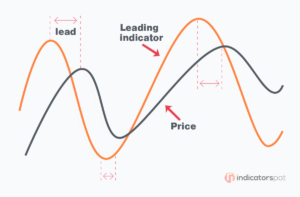
Leading indicators, as their name suggests, aim to forecast price movements ahead of time. They are used to predict potential changes in the market, giving traders the chance to strategize and potentially profit from upcoming trends. These indicators can be particularly valuable in the fast-paced world of Forex day trading, where understanding what lies ahead can make the difference between profit and loss.
Common types of leading indicators include Relative Strength Index (RSI), Stochastic Oscillator, Commodity Channel Index (CCI), and Money Flow Index (MFI). These are based on mathematical formulas that consider various factors, such as price levels and trading volumes, and they generate signals to buy or sell before a new trend becomes apparent in the price action.
The Pros and Cons of Leading Indicators
Pros
One of the main benefits of using leading indicators is the potential for early trend detection. By giving traders a glimpse into the future, these tools can help in making timely investment decisions. They can allow you to capitalize on price movements before they become apparent to the broader market.
Furthermore, leading indicators can be incredibly useful during periods of sideways trading, or consolidation. In such situations, lagging indicators might struggle to provide valuable signals because they rely on trend confirmation, which might not exist in a ranging market.
Cons
Despite their apparent attractiveness, leading indicators are not without their drawbacks. The most notable among these is the issue of false signals. Because they aim to predict future price movements, leading indicators are inherently susceptible to inaccuracies. They might indicate a forthcoming trend change that never materializes, potentially leading traders into unprofitable positions.
Moreover, leading indicators can sometimes be overly sensitive to short-term price changes. This can result in an overabundance of signals, some of which may contradict each other, creating confusion and indecision for traders.
Top 20 Leading Indicators for Forex Day Trading
- Spearman Correlation Indicator
- Wave Trend Oscillator Indicator
- Profit Ratio indicator
- DTOSC Indicator
- Brooky KST Advanced Analysis V3 Indicator
- Double Stochastic RSI Indicator
- Solar Wind Joy Histogram Indicator
- TRIX.Crossover Indicator
- Power Trend Indicator
- Heiken Ashi Oscillator Indicator
- Woodies CCI Arrows Oscillator Indicator
- Schaff Trend Cycle Indicator
- RSI 3TF Alert Indicator
- DAT MACD Indicator
- Commodity Channel Index (CCI) Indicator
- Chande Momentum Oscillator Indicator
- RSI on MA Indicator
- Colored Stochastic Indicator
- Real Woodie CCI Indicator
- Inverse Fisher Transform Of RSI Indicator
Spearman Correlation Indicator

Downloads: 2.0k
Score: 4.0 /5.0
Timeframes: M5-H1
Signal frequency: 8-12 per day
The Spearman Correlation Indicator for MetaTrader is a leading tool that efficiently detects potential trend reversal zones. It applies the Spearman correlation principle to gauge the strength and possible reversal points of a trend by identifying previous highs and lows. The indicator features two oscillating lines that identify overbought and oversold levels, accompanied by price bars and signal arrows indicating potential reversal points and buy/sell entries.
This responsive, almost lag-free indicator is suitable for trending markets, offering accurate signals and enhancing trade setup success rates. It caters to novice and experienced traders and accommodates various trading styles, including scalping, day/intraday, and swing trading. This helps traders pinpoint precise price reversals, improving the precision of their trades.
Wave Trend Oscillator Indicator

Downloads: 2.2k
Score: 4.75 /5.0
Timeframes: M15-H4
Signal frequency: 4-8 per day
The Wave Trend Oscillator for MetaTrader is another leading forex technical indicator designed to identify and follow market trends. This indicator, noted for its sensitivity to price changes, monitors diminishing price momentum to predict potential trend reversals. It features overbought and oversold levels, or ‘exhaustion terminals’, signaling probable price reversals, thus aiding in trade setup anticipation.
Designed for scalping, day, and swing trading, the Wave Trend Oscillator is suited to both novice and experienced traders. It excels in identifying divergence for trading setups, thanks to its separate window placement from the main chart. While efficient, for optimal results, it’s recommended to be used in combination with other indicators or price action to increase win rates.
Profit Ratio indicator

Downloads: 12.5k
Score: 4.1/5.0
Timeframes: M15-M30
Signal frequency: 5-10 per day
The Profit Ratio indicator, a leading market sentiment tool, provides vital data about retail traders’ open positions on the forex market.
This MT4 or MT5 indicator gives accurate signals prior to trend reversals, facilitating well-timed market entry. By displaying the ratio of winning to losing trades currently open, it can predict reversal points before a price change, aiding in efficient daytrading.
This versatile tool assists in identifying price reversals, recognizing short and medium-term trends, and distinguishing between true and false movements. It also includes a “Delta” histogram to confirm signals, and a signal line based on the moving average for volatility monitoring.
Further, its “BUY:SELL” mode helps in spotting trends. It presents information in a user-friendly format, with highlights for best reversal points, and automatically updates for optimal user experience. The Profit Ratio indicator, leveraging real market data, is an indispensable aid for traders aiming to capitalize on trend reversals.
DTOSC Indicator

Downloads: 1.2k
Score: 5.0 /5.0
Timeframes: M1-H1
Signal frequency: 10-15 per day
The Dynamic Trader OSCillator (DTOSC) is a leading indicator that combines the features of the Stochastic and RSI oscillators, identifying overbought and oversold conditions in the forex market.
This indicator is particularly adept at recognizing extreme levels, providing reliable buy and sell signals through the crossover of signal lines, making it an efficient tool for crossover trading strategies.
It’s user-friendly, beneficial for both novice and advanced traders, and compatible with all chart timeframes, making it useful for multi-timeframe strategies. By acting as a trend-following indicator, DTOSC offers optimal entry points by leveraging overbought and oversold trading conditions, although it tends to perform better in higher timeframes.
Brooky KST Advanced Analysis V3 Indicator

Downloads: 1.6k
Score: 4.0 /5.0
Timeframes: M15-H4
Signal frequency: 4-8 per day
The Brooky KST Advanced Analysis V3 indicator, a leading tool for daytrading, is an advanced version of Martin Pring’s KST oscillator, redesigned for forex trading. It blends the Stochastic and Relative Strength Index (RSI) to deliver actionable insights about trends, divergences, momentum, and potential trend reversals through signal crossovers. As a comprehensive hybrid technical tool, it is suitable for forex traders of all experience levels, including scalpers and swing traders.
The indicator is user-friendly; crossed-over signal lines indicate potential trend changes while price position and histogram bars validate the signal’s direction. In essence, Brooky KST Advanced Analysis V3 offers an improved mechanism for analyzing forex market dynamics and optimizing trading strategies.
Double Stochastic RSI Indicator

Downloads: 1.2k
Score: 4.5/5.0
Timeframes: M5-H4
Signal frequency: 5-10 per day
The Double Stochastic RSI Indicator is a leading technical analysis tool that merges two classic oscillators, Stochastic (Stoch) and Relative Strength Index (RSI), into one comprehensive indicator.
It automatically analyses price dynamics to identify overbought (potential reversal downwards) and oversold (potential reversal upwards) zones. It achieves this through the main line that oscillates between 0 and 100, and two dynamic overbought and oversold levels.
The indicator’s accuracy lies not in guaranteeing profitable buy and sell signals but in its ability to accurately highlight potential reversal zones. It works best in combination with other technical analysis methods and can be used across different markets and timeframes.
Solar Wind Joy Histogram Indicator

Downloads: 200
Score: 4.75/5.0
Timeframes: M15-H4
Signal frequency: 3-5 per day
The Solar Wind Joy Histogram Indicator is a leading technical analysis tool that leverages past price action data to predict potential trend reversal zones. It’s a trend-following tool for MetaTrader, showcasing trend direction via histogram bars and detecting potential changes in trend direction.
Reading the indicator is straightforward; above or below the zero line indicates bullish or bearish tendencies, while the short golden line signals a possible change in the trend. Lime green/red histogram bars represent bullish/bearish sentiments respectively.
This indicator not only simplifies the understanding of market trends but also enhances accuracy when harmonized with price action, thereby helping filter out false signals. It’s suitable for traders of all experience levels and trading styles.
TRIX.Crossover Indicator

Downloads: 1.4k
Score: 4.75 /5.0
Timeframes: M1-M30
Signal frequency: 5-10 per day
The TRIX.Crossover Indicator, also known as “Trix,” is a leading tool on MT4 that automatically constructs a triple exponential moving average (TEMA) for trend and flat market distinction. This updated Moving Average trend indicator aims to filter market noise and minimize false entry points.
Built on standard moving averages, Trix offers advantages such as clear visibility by plotting in a separate window and marking trade signals with dots when the fast-moving average crosses the slow one. It identifies the overbought zone above and oversold zone below a default horizontal line with the value “0″.
By relying solely on market price data, the Trix indicator enhances the probability of successful trades, especially when combined with other forex market indicators. It contributes to a comprehensive trading strategy, providing buy and sell signals via green and red dots, respectively.
Power Trend Indicator

Downloads: 4.6k
Score: 4.8 /5.0
Timeframes: M5-H4
Signal frequency: 5-10 per day
The Power Trend indicator for MT4 is a leading technical tool that helps forex traders identify and assess the strength of trends. By displaying trend strength in visual colors, the indicator enables traders to recognize weak trends, potential new trends, and strongly established trends. This information is crucial for determining optimal entry and exit points. The indicator’s colored histogram provides clear visual cues, allowing both new and experienced traders to effectively ride the trend and maximize profits. Traders can plan advanced strategies based on the various trend strength levels indicated by the histogram’s colors. The Power Trend indicator is a valuable tool in the arsenal of trend traders and is available for free download.
Heiken Ashi Oscillator Indicator

Downloads: 3.2k
Score: 4.0 /5.0
Timeframes: M5-H4
Signal frequency: 8-15 per day
The Heiken Ashi Oscillator Indicator for MT4 is a dynamic leading tool for day trading. It enhances the default Heiken Ashi Metatrader indicator by incorporating a moving average to the oscillator, allowing for smoother transitions and a more prolonged adherence to bullish or bearish trends. The histogram visualizes the strengthening or weakening of the trend, while buy and sell signals are interpreted using several methods according to trader discretion.
This free-to-download, easy-to-install tool proves indispensable in auto-trading strategies and for both novice and experienced forex traders. Combining an average price bar from Heiken Ashi with a moving average oscillator, it provides a clear identification of bullish and bearish trends, enhancing buy/sell decision-making.
Woodies CCI Arrows Oscillator Indicator

Downloads: 3.5k
Score: 4.83 /5.0
Timeframes: M5-H4
Signal frequency: 5-10 per day
The Woodies CCI Arrows Oscillator for MT4 is a vital leading indicator for forex traders implementing the Woodies patterns and strategy. It’s a momentum tool based on a 14-period CCI – Commodity Channel Index MT4 indicator, enabling the identification and trading of various CCI-based patterns. Its unique selling point is the provision of arrow signals, pinpointing optimal entry points for both trend and counter-trend trading strategies.
The indicator displays red and green arrows, signaling sell and buy positions respectively, and serves both new and experienced forex traders by simplifying technical analysis and enhancing trading strategy. Offering an easy-to-interpret system, it enhances forex trading by leveraging the core CCI function while providing a straightforward representation of trading signals.
Schaff Trend Cycle Indicator

Downloads: 7.1k
Score: 4.2 /5.0
Timeframes: M15-H4
Signal frequency: 2-4 per day
The Schaff Trend Cycle MT4/MT5 Indicator is an evolved overbought and oversold indicator that integrates MACD and Stochastic for a reduced noise, lag-free oscillator that offers early trading signals. This innovative leading indicator aids traders in early identification of new trends and supports prolonged adherence to the trend direction.
Displayed in a separate window, this oscillator ranges between 0 and 100, marking 75 as overbought and 25 as oversold. Buy and sell positions are determined based on oscillator crossings over these levels, supplemented by candlestick patterns for further confirmation.
Beneficial for both novice and advanced traders, the Schaff Trend Cycle Indicator can be combined with other trend-following indicators to enhance profitable strategies, especially in higher time frames. This blend of MACD and Stochastic in one tool elevates trading efficiency, making it a preferable alternative to the standard MACD.
RSI 3TF Alert Indicator

Downloads: 2.3k
Score: 4.8 /5.0
Timeframes: M5-H1
Signal frequency: 10-20 per day
The RSI 3TF Alert Indicator for MT4 is an effective tool that blends multiple RSI indicators to generate buy and sell signals with additional confirmations for high probability trades. It provides versatile alerts, permitting the trader to opt for all or only high probability notifications.
Displayed in distinct colors, it denotes RSI of 3 timeframes and marks trading signals with yellow arrows. It also outlines key levels (7, 50, 93) with dark gray lines, aiding decision-making.
This leading indicator excels in all intraday and higher chart time frames. Trades are confirmed based on the relative position of red and aqua lines with respect to the 50 level, improving precision and reliability. Moreover, corroborating the indicator signals with price action and proximity to support and resistance levels can enhance trading outcomes.
Easy to install and free to download, the RSI 3TF Alert Indicator for MT4 boosts trading efficacy, especially for those utilizing multiple RSI-based strategies.
DAT MACD Indicator

Downloads: 1.8k
Score: 4.75 /5.0
Timeframes: M1-M30
Signal frequency: 5-10 per day
The DAT MACD Indicator, a leading technical tool, combines smoothed moving averages, utilizing a Triple Exponential Average (TRIX) to deliver accurate trading signals and reduce market noise. It features slow and fast-moving averages that oscillate around a zero line, providing buy or sell alerts based on their crossover points.
Moreover, it functions as a momentum indicator, with positive values indicating increasing momentum and negative values suggesting reduced momentum. It is versatile, suitable for all time frames, short-term and long trades, across various currency pairs.
DAT MACD indicates buy signals when moving averages cross above the zero line with the fast average above the slow one. Conversely, sell signals occur when the fast average drops below the slow one and both lines cross below zero. The lines’ color change (green for uptrend, red for downtrend) further aids in trend identification.
Commodity Channel Index (CCI) Indicator
 Indicator")
Downloads: 1.8k
Score: 4.5 /5.0
Timeframes: M5-H1
Signal frequency: 8-15 per day
The Commodity Channel Index (CCI) MT4 Indicator, developed by Donald Lambert, is a versatile tool highly valuable for forex traders. It specializes in identifying emerging trends and spotting divergence between price and the indicator, signaling impending trend reversals. This leading oscillator also pinpoints potential overbought and oversold conditions.
Displayed in bold red lines, the CCI indicator marks overbought and oversold levels at +200 and -200, while the zero line is shown in pale green. It also indicates the +50 and -50 values with royal blue lines, and the Turbo CCI with a red oscillator line.
Trading signals are generated when Turbo CCI and CCI values surpass the +50 level for buying, or drop below the -50 level for selling. Positions can be held until the CCI values cross the zero line.
Ideal for daytrading, this indicator simplifies trend identification for new traders and offers experienced traders a reliable tool for spotting divergences and timing entries. The CCI indicator, an unbound oscillator, can be applied to all trading instruments despite its name. Caution is advised when identifying oversold and overbought levels, as conditions can persist longer than expected due to the indicator’s unbounded nature.
Overall, the CCI MT4 Indicator helps traders gauge the strength or weakness of the current price change relative to its history, facilitating the creation of profitable trading strategies. Price action, however, should be used to confirm the indicator signals for the best outcomes.
Chande Momentum Oscillator Indicator

Downloads: 1k
Score: 4.5 /5.0
Timeframes: M15-H4
Signal frequency: 4-8 per day
The Chande Momentum Oscillator (CMO), developed by Tushar Chande, is a leading technical indicator that measures momentum on up and down days without smoothing the results.
It is used to identify strong momentum in the market, making it valuable for day trading. The CMO oscillates between +100 and -100, with overbought conditions above +50 and oversold conditions below -50.
Traders can use the CMO to analyze any instrument and any time frame, but it works best in trending markets. By monitoring the indicator line, traders can identify bullish or bearish momentum and make informed decisions on opening long or short positions. Adding a moving average to the CMO line can further confirm trading signals.
RSI on MA Indicator

Downloads: 1.4k
Score: 4.5 /5.0
Timeframes: M5-H4
Signal frequency: 3-6 per day
The RSI on MA (Moving Average) indicator combines the power of Moving Average crossovers with the Relative Strength Index (RSI) to provide leading trading signals.
The indicator displays two lines that oscillate between 0 and 100, indicating both the trend and momentum. It can be applied to various markets such as currency pairs, metals, commodities, and stocks, and is suitable for different time frames.
A buy signal occurs when the faster-moving average (crimson line) crosses above the slower-moving average (lime green line), indicating rising momentum. Conversely, a sell signal is generated when the crimson line crosses below the lime green line, indicating declining momentum. Traders can enhance signal accuracy by combining the RSI on MA indicator with other trend-following tools.
Colored Stochastic Indicator

Downloads: 1.4k
Score: 4.0 /5.0
Timeframes: M5-M30
Signal frequency: 5-10 per day
The Colored Stochastic Indicator for MetaTrader 4, a leading tool for daytrading, is an intuitive and user-friendly modification of the standard stochastic indicator. It employs a red and lime color-coded line system for seamless visualization of price extremes, facilitating easy identification of potential trend reversal zones.
Ideal for both novice and experienced traders, this indicator signals overbought zones with a red line and oversold zones with a lime line, corresponding to sell and buy signals respectively. Although it can be used independently, it’s advisable to combine it with other technical indicators or price action for more accurate trading decisions.
Primarily, the Colored Stochastic Indicator excels in detecting market extremes within trending markets.
Real Woodie CCI Indicator

Downloads: 1.1k
Score: 4.0 /5.0
Timeframes: M1-M30
Signal frequency: 10-20 per day
The Real Woodie CCI is a versatile MT4 indicator optimized for daytrading, presenting itself as an upgraded version of the traditional Commodity Channel Index (CCI). With oscillations between -100 and +100, this leading indicator uses a single moving average line and a signal line to highlight overbought and oversold conditions, providing timely buy and sell signals.
Suitable for any timeframe, it excels in longer ones to mitigate the occurrence of false signals. Buy signals are generated when the signal line surpasses +100, whereas sell signals arise below -100.
While it primarily mirrors the traditional CCI in determining overbought and oversold levels, the optimal settings of the Real Woodie CCI are contingent on individual trading strategies. This indicator is a practical, user-friendly tool available for free download.
Inverse Fisher Transform Of RSI Indicator

Downloads: 0.6k
Score: 4.5 /5.0
Timeframes: M15-H4
Signal frequency: 4-8 per day
The Inverse Fisher transform of RSI indicator for MT4 is a leading technical tool that identifies optimal entry points for daytrading. By smoothing prices using a moving average and applying the Fisher filter to RSI values, the indicator helps traders make successful BUY and SELL decisions.
It can be used across various intraday and longer-term price charts, allowing for multi-timeframe trading strategies. New traders can rely on the overbought and oversold signals for profitable trades, while advanced traders can combine this indicator with others for confluence.
The indicator’s clear visualization of entry points, along with the option to plot it on current price charts, make it valuable for traders of all experience levels.
Final Thoughts on Leading Indicators
While leading indicators play a crucial role in Forex day trading, they should not be used in isolation. As they can generate false signals, it’s imperative to use them as part of a broader trading strategy that involves other tools and considerations, such as lagging indicators, fundamental analysis, and risk management practices.
Furthermore, just as with any tool, proficiency in using leading indicators comes with practice and experience. There’s no one-size-fits-all indicator, and the effectiveness of these tools can depend on various factors, including the asset being traded, the timeframe, and the trader’s own risk tolerance and trading style.
In conclusion, leading indicators can provide valuable insights into potential future market movements and help in devising trading strategies. However, they should be used with caution, a thorough understanding of their mechanisms, and a robust trading plan that incorporates diverse information sources. The key to successful Forex day trading lies not only in the indicators you choose but in the way you use them.


Leave a Reply