
Best Indicator for Intraday Trading: Top Picks for Successful Traders
The quest of every forex intraday trader is to get hold of the best indicator for intraday trading. Though there are a plethora of MT4 indicators often traders feel the need to look for better indicators. In most cases traders use a combination of indicators for technical analysis and prepare a trading system of their choice.
Generally, indicators are based on support and resistance, pivots, divergence, oscillators, channels to name a few. On the other hand, there are indicators that provide understanding beyond these areas into the special areas like the order books. In this article we will try to explore some of these indicators that help intraday forex traders to achieve best trading results.
Let’s look at each indicator separately. The main advantages and basic information you need to know in order to create a profitable strategy. We should note that we have analyzed the indicator data as of June 2023.
Table of Content
- Volume Profile Indicator
- FXSSI Order Book
- Lucky Reversal Indicator
- Supply And Demand Zones Indicator
- Order Block Breaker Indicator
- MACD 2 Line Indicator
- Auto Trendline Indicator
- Auto Support & Resistance Zones Indicator
- FXSSI Stop Loss Clusters
- Currency Power Meter Indicator
- VWAP Bands Indicator
- Keltner Channel Indicator
- Pivot Points All In One Indicator
- RSI Divergence Indicator
- Forex Trading Sessions Indicator
- Advanced ADX Indicator
- Stochastic Divergence Indicator
- Better Volume New Alerts Indicator
- Aroon Indicator
- OBV Divergence Indicator
#1 Volume Profile Indicator
 Downloads: 34.8k
Score: 4.5/5.0
Timeframes: M15-H1
Repaints: No
Alerts: No
Signal frequency: 1-5 per day
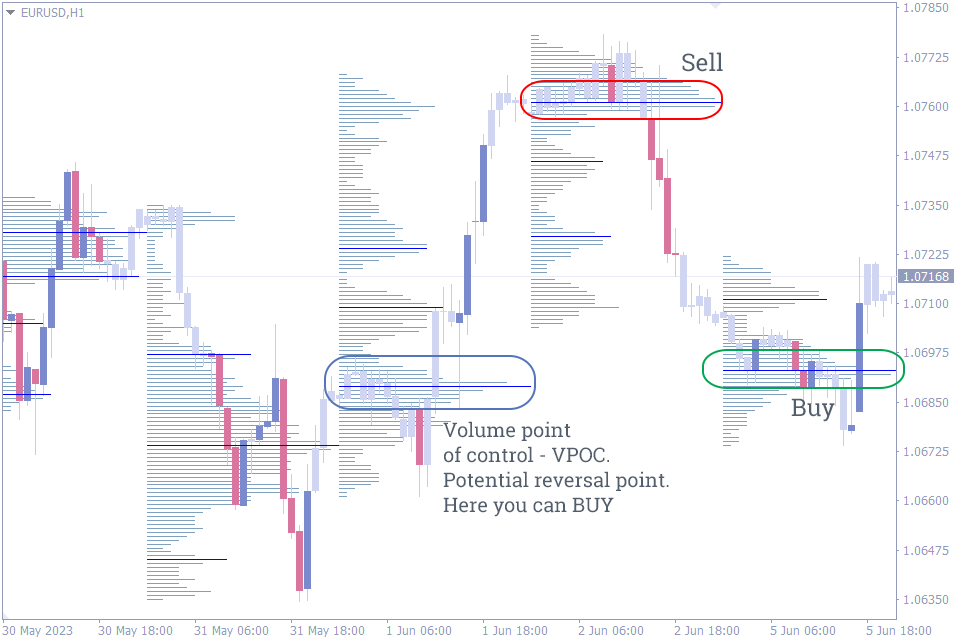
This indicator uses trading volumes to provide a complete outlook of the support and resistance levels. Volume profile indicator is based on the idea that trading volumes peak at potential reversal areas, which in turn act a support and resistance. Once a trader identifies these areas, they can use them to enter the market at excellent conditions.
The volume point of control – VPOC or commonly known as POC is very helpful to identify intraday reversal points. As a result they act as visual clues for both entry points and exit points. The indicator works well in all chart time frames as it is based on the volumes.
#2 FXSSI Order Book
 Downloads: 50.2k
Score: 4.5/5.0
Timeframes: M15-H1
Repaints: No
Alerts: No
Signal frequency: 1-5 per day
Most of the indicators provide information after the price movement, but what if we could get an insight before a potential price movement. How is it possible to stay on the right side of the market? Are most of the traders bullish or bearish in the market currently? In which direction forex traders are placing order? And most importantly where is the stop loss of most of the market participants?
If we could get this information wouldn’t it be an advantage over the forex traders. Yes, the FXSSI –Order book provides data regarding the orders which otherwise is not available to most of the forex traders and helps traders to enter and exit with profitable trading positions.
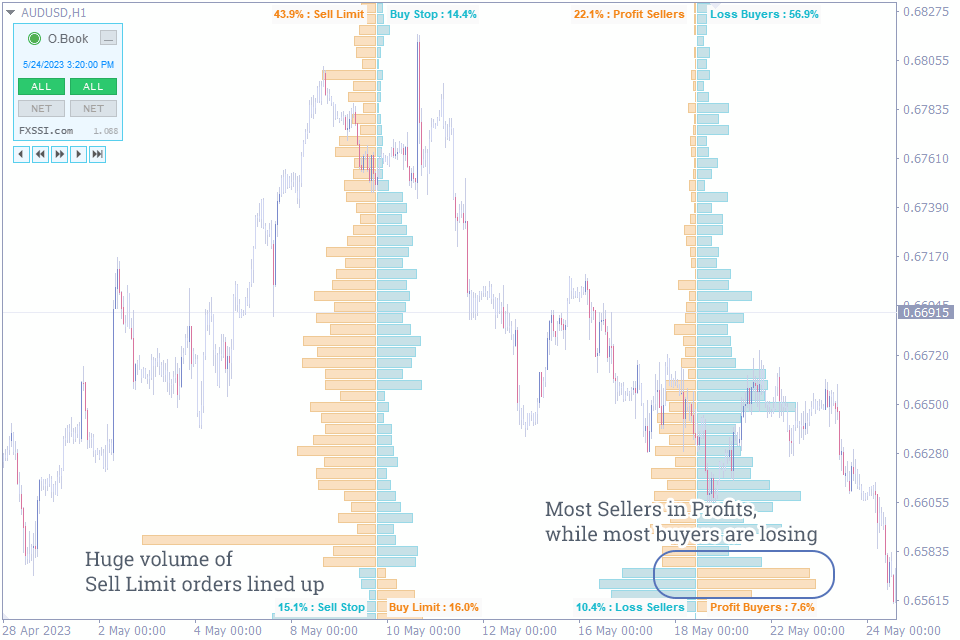
The order book does not provide forex trading signals like other indicators; rather it provides insight which traders could understand pretty easily. There are 2 major parts the Left-side order book and the Right-side order book. The left one shows pending order of the market, the stop loss and the take profits.
However, the right side shows the current open trades. Furthermore, to provide additional clarity the order book displays order types such as Sell limit, Buy limit, Sell stop, Buy stop and profit sellers or loss buyers and loss sellers or profit buyers.
The information is extremely useful as a trader and can be used in multiple ways. If there is major stop loss cluster of sellers, then we can anticipate the price to move higher and look for BUY positions. Similarly, if we identify a major stop loss formation of buyers, then it is prudent that the price will attract and move towards this cluster making way for a SELL trade.
Placing a stop loss is tricky for most of the traders, but since the FXSSI – Order book shows the potential clusters traders can place stop loss at a better position than others. In this way there is better chance of escaping the stop hunt.
Another approach is to find if most of the current buyers or sellers are profitable. This enables the trader to understand if they should take a bullish or bearish position.
In summary, the FXSSI – Order book provides an interesting and profitable insight which most other traders are deprived off and this provides an edge.
#3 Lucky Reversal Indicator
 Downloads: 34.7k
Score: 4/5.0
Timeframes: M15-H1
Repaints: Yes
Alerts: No
Signal frequency: 1-5 per day
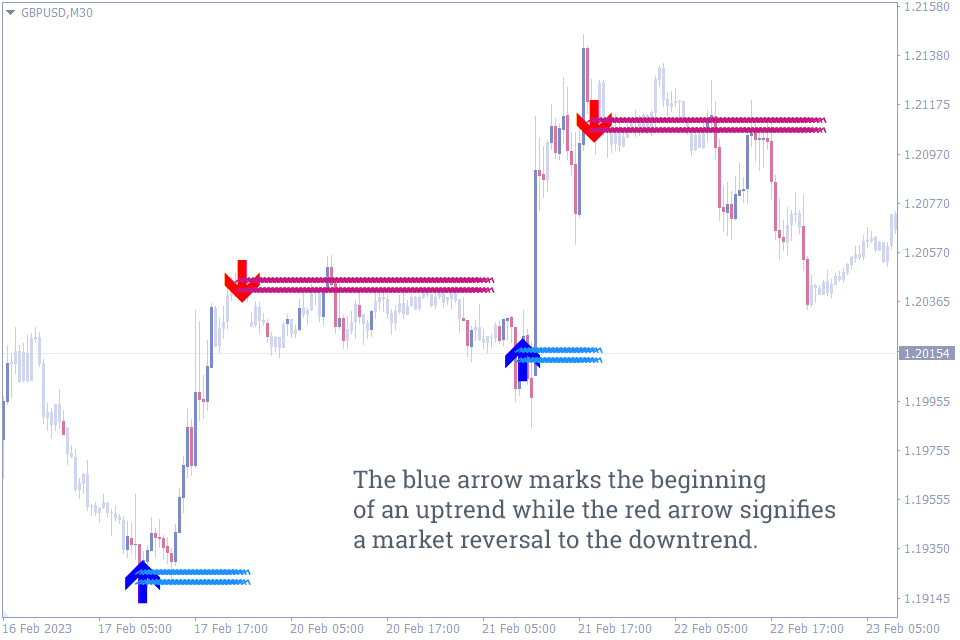
Lucky reversal indicator automatically scans for any trend reversal signals and provides an arrow based buy and sell forex trading signal. However, the indicator is a lagging indicator and uses ZigZag to identify the trend reversals. The indicator provides best results in combination with an exponential moving average.
The indicator works on all time frames, however smaller time frames provide multiple signals due to the ZigZag. Another important feature is the white square that appears once a trend reversal in confirmed. As a result, the indicator acts as a trend reversal identifier and also provides confirmation of the reversal.
#4 Supply And Demand Zones Indicator
 Downloads: 30.5k
Score: 4.25/5.0
Timeframes: M15-H1
Repaints: Yes
Alerts: Yes
Signal frequency: 2-7 per day
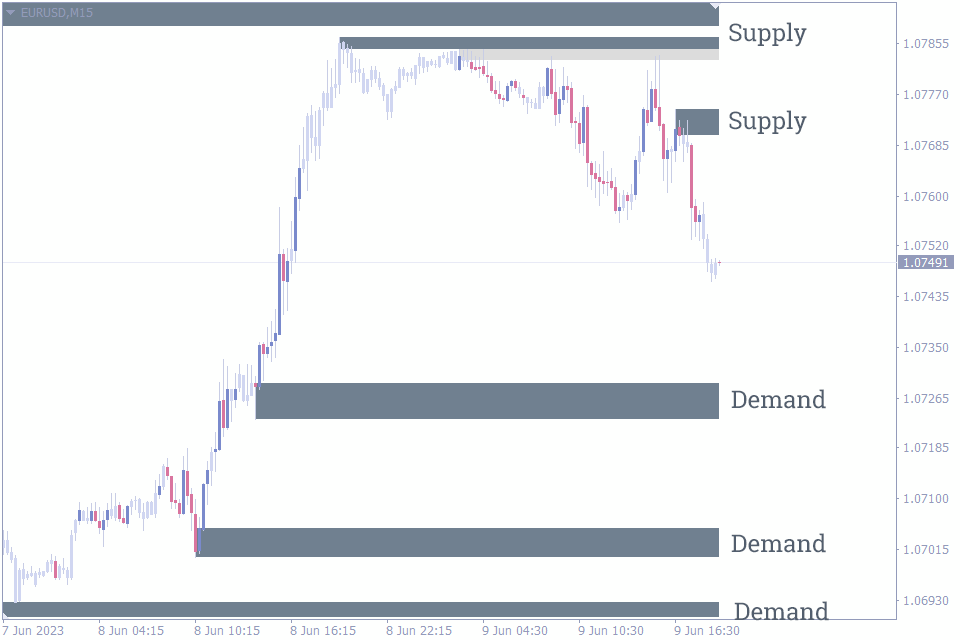
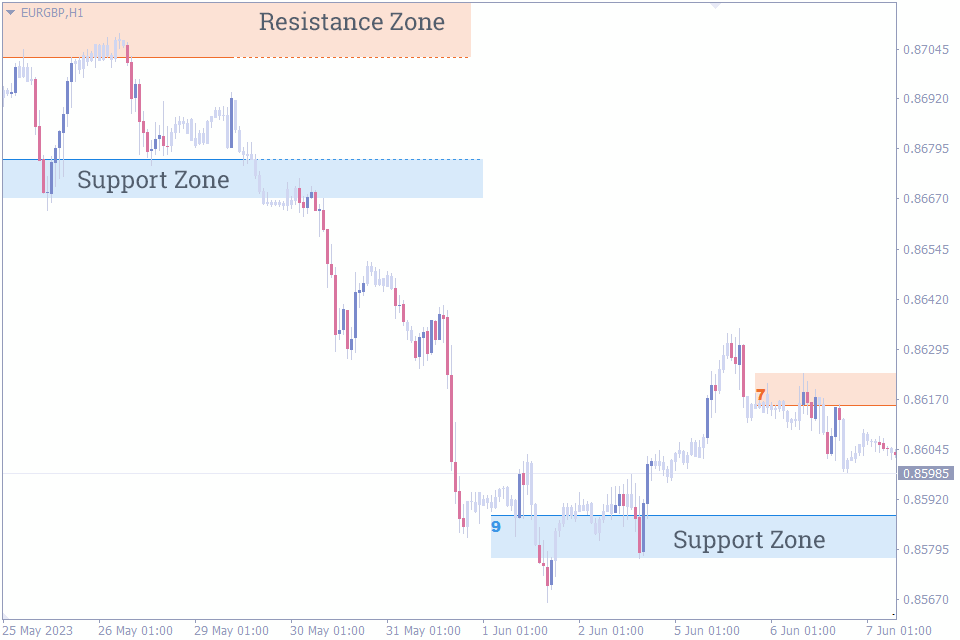
The supply and demand zones indicator for MT4 automatically scans for supply and demand zones and plots them on the price chart. Since supply and demand zones double down as support and resistance zones the indicator provides best entry points. Another important feature it the identification of the retouched zones in light gray.
The light gray zones act as additional confirmation of the support and resistance. So, forex traders can buy and sell accordingly. Moreover, the indicator plots Fibonacci levels to in addition to the supply and demand zones. In simple terms the indicator comes handy for new trades to automatically plot the best entry zones.
#5 Order Block Breaker Indicator
 Downloads: 27.8k
Score: 4.0/5.0
Timeframes: M15-H1
Repaints: Yes
Alerts: Yes
Signal frequency: 5-10 per day
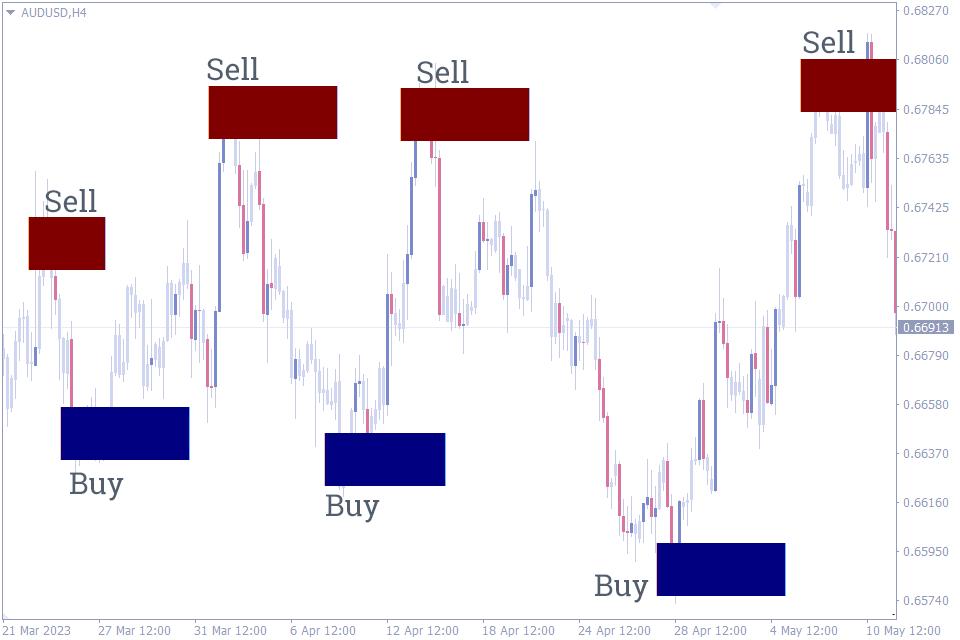
The order block indicator for MetaTrader4 automatically scans for the order blocks and plots them on the price chart. An order block is the last bearish candle before an up move and vice versa for a downward price movement. So, order blocks form a basis for price reversal. Forex traders anticipate price reversals at these order blocks.
Additionally, these order blocks may not work well during a trending market. So, it is necessary that traders combine the order block with other indicators. The lower the chart time frame, higher the trading signals. However, for quality signals the higher time frames are the best.
#6 MACD 2 Line Indicator
 Downloads: 23.8k
Score: 4.0/5.0
Timeframes: M15-H4
Repaints: No
Alerts: No
Signal frequency: 2-5 per day
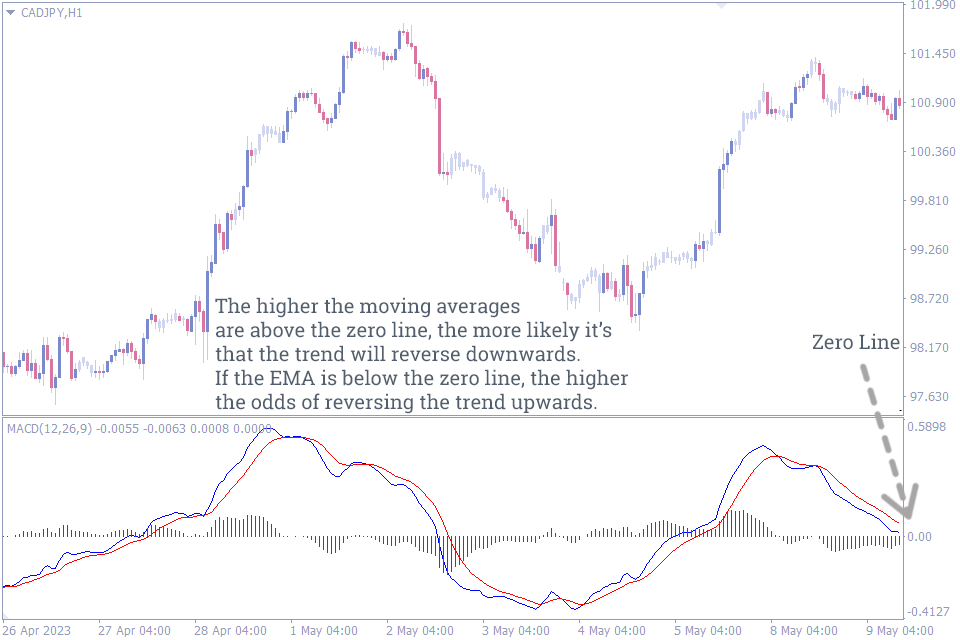
The MACD 2 line indicator is a modified version of the classic MACD indicator. Similarly, the indicator plots the EMA lines and the histogram. Though both indicators are similar the MACD 2 line indicator helps forex traders to identify the change in trend directions much easier than the classic indicator.
The MACD 2 Line indicator portrays both moving averages, specifically the Exponential Moving Average (EMA), and the volume histogram in an isolated section of the graph.
This indicator also incorporates a neutral line, referred to as the zero line. The area that exists above this line represents a market condition known as the overbought zone, while the area below the line signifies an oversold zone.
It is highly recommended that traders adjust the EMA – Exponential moving averages settings to find the settings according to the trader’s discretion.
#7 Auto Trendline Indicator
 Downloads: 19.7k
Score: 4.25/5.0
Timeframes: M5-H4
Repaints: No
Alerts: No
Signal frequency: 2-8 per day
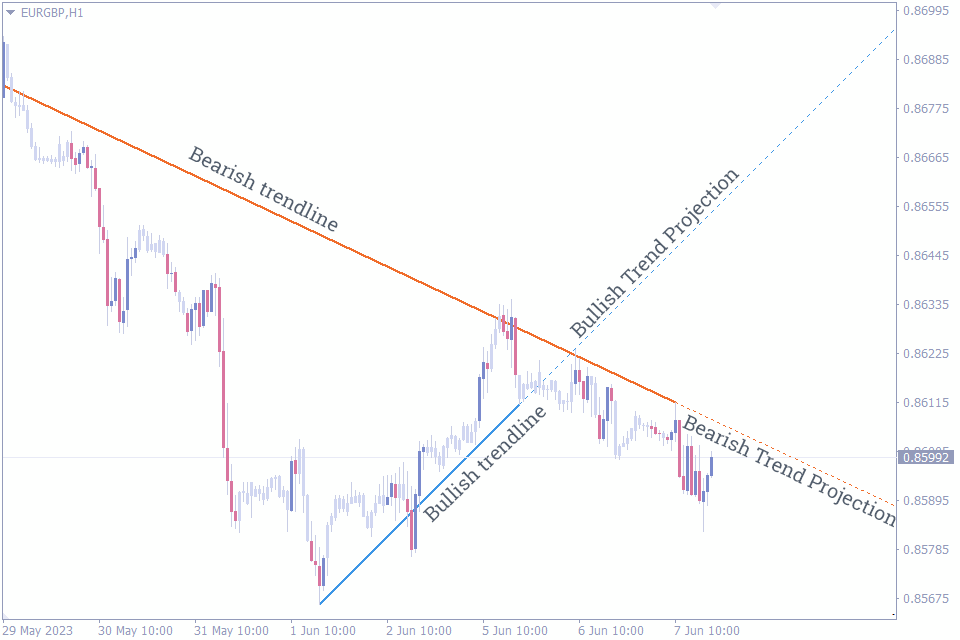
Let’s face it, most forex traders get confused from multiple trend lines on the chart and get frustrated. Trend lines are simplest form of identifying support and resistance so it is inevitable on a price chart. The Auto trend line indicator for MT4 automatically plots the trend lines and eliminates the older and invalid trend lines and makes the charts cleaner and simpler. This indicator operates based on a mathematical algorithm and numerous filters. These elements work together to reveal only the most influential lines on the graph, thereby enhancing its usefulness.
Though it is a boon for new forex traders, advanced traders can also use them and benefit from the automation. The indicator works well for scalpers, short term and long term forex traders and works effectively in all chart time frames.
#8 Auto Support & Resistance Zones Indicator
 Downloads: 18.3k
Score: 5.0/5.0
Timeframes: M1-D1
Repaints: Yes
Alerts: No
Signal frequency: 2-10 per day
There are multiple forms to identify the support and resistance of the price chart. However, the Auto Support and Resistance indicator uses the Fractals to identify them. According to the nature of fractals the indicator draws zones. These zones will be recalculated once the price breaches them and the support or resistance becomes invalid.
So, forex traders should be prepared to adjust the support and resistance and also to alter the trade plan accordingly. Smaller time frames do work, but may produce a higher number of zones which may not be suitable for trades other than scalping.
#9 FXSSI Stop Loss Clusters
 Downloads: 38.4k
Score: 4.5/5.0
Timeframes: M5-H1
Repaints: No
Alerts: No
Signal frequency: 2-10 per day
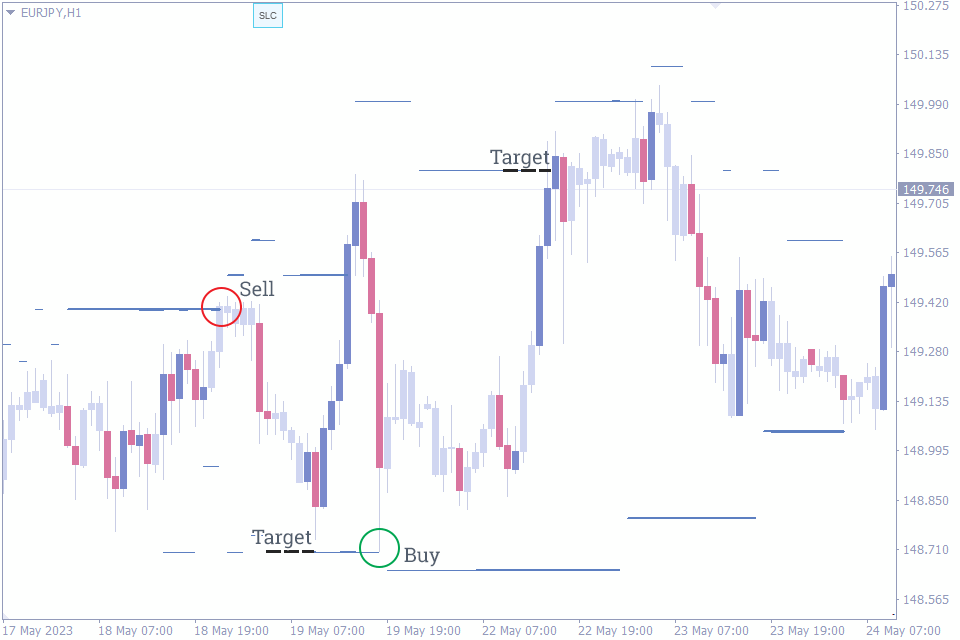
If there is one indicator that could significantly improve your trading results as immediately as possible, it is the FXSSI – Stop loss clusters indicator. No matter whatever indicator or trading strategy you use, this indicator can be used in confluence with them.
In simple terms, this indicator provides you stop loss clusters, where other traders have placed significant number of stop loss within a small price range. Additionally, the indictor thickens the line to indicate the volume of stop loss. So, during technical analysis forex traders can see the stop loss cluster and also find if the stop loss volume is higher compared to other stop loss.
In order to avoid confusion, the indicator looks for stop loss cluster with a significant volume and plots them above and below the current market price. Forex traders can interpret this valuable information in multiple ways as trading decisions.
The primary objective is to help traders place a better stop loss. If there is a stop loss cluster, it is imperative to place a stop beyond this cluster to reduce the likelihood of getting hit. Most importantly, this will protect the stop loss if there is a pull back during a trend.
The second objective is to place a better take profit. Since the stop loss cluster tend to attract the price it is better to place the take profit slightly at a better price to improve the chances of the take profit being executed.
The FXSSI – Stop loss clusters can help traders enter into the market with a better position. Stop loss clusters act a support and resistance, if there is a price rejection at these clusters it will act as an excellent entry point with a high risk to reward ratio.
For better results, traders can combine this indicator with the FXSSI – Order book indicator.
#10 Currency Power Meter Indicator
 Downloads: 12.9k
Score: 3.75/5.0
Timeframes: M1-D1
Repaints: No
Alerts: Yes
Signal frequency: 2-10 per day
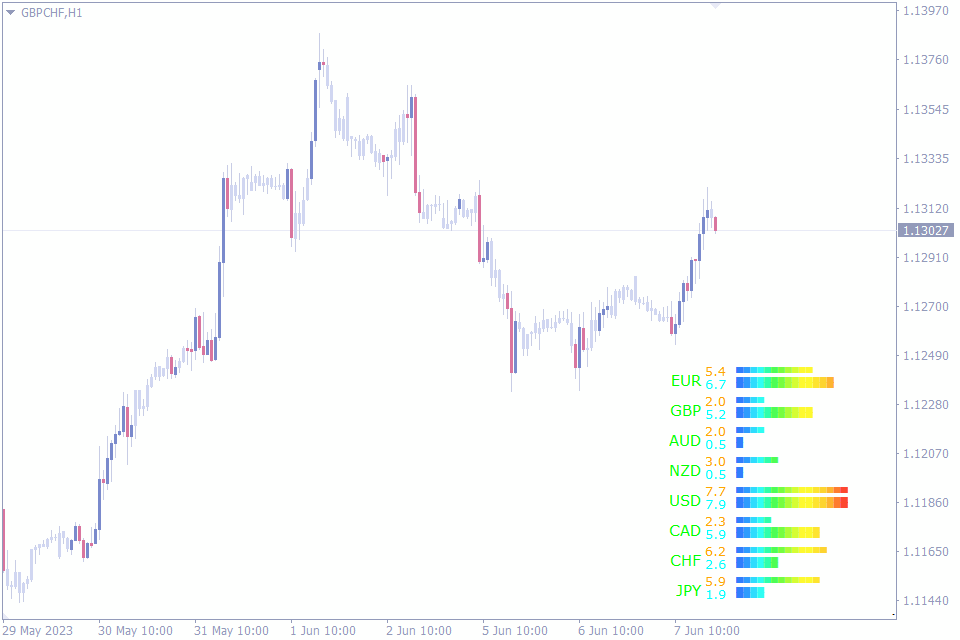
The basic understanding of trading using the Currency power meter or Currency strength meter is to identify the strongest and the weakest currency. By gaining this knowledge the trade will be in a better position to buy the strongest and sell the weakest currency. Thus the trade operation of the pair will have a much better possibility to become a profitable one.
However the Currency power meter shows the Daily currency strength of a currency together with the strength of the current chart time frame. So, it helps the forex trader to visualize the strength of the different time frames and buy or sell accordingly.
#11 VWAP Bands Indicator
 Downloads: 11.1k
Score: 5.0/5.0
Timeframes: M15-H4
Repaints: Yes
Alerts: No
Signal frequency: 3-8 per day
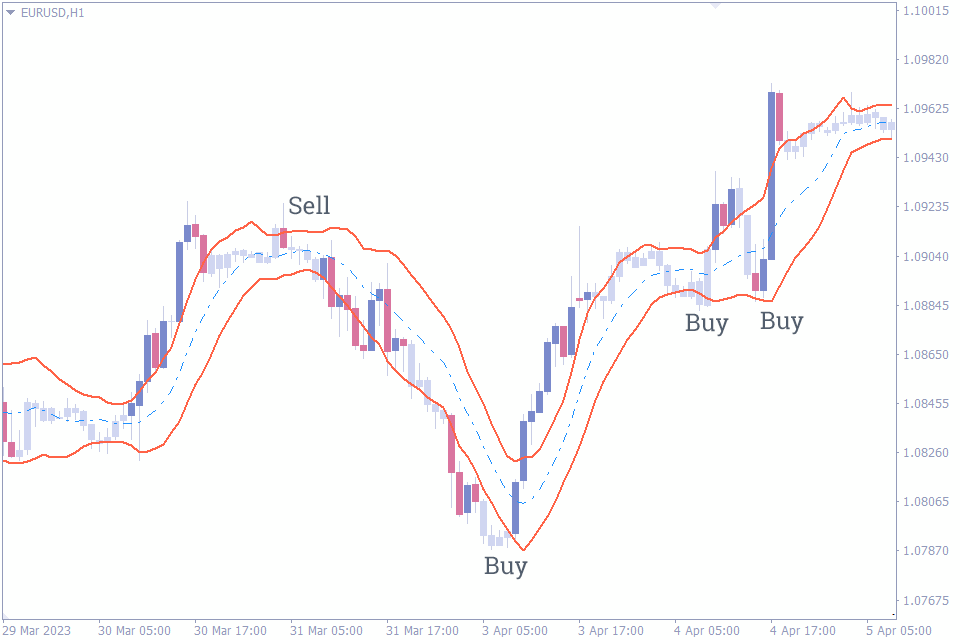
Volume plays an important role in forex trading, yet it is one of the most ignored parameter in technical analysis. The Volume weighted average price bands indicator plots the volume weighted average price. Moreover, it plots a band with standard deviation values of 1.0, 2.0 and 2.5. These bands act as overbought and oversold indicator.
Forex traders should wait for the price to reach these extreme conditions and buy or sell accordingly. This enables the trader to enter the markets with a better price with regard to the volume. Though traders will find it similar to the classic Bollinger bands indicator, they are constructed using different inputs.
#12 Keltner Channel Indicator
 Downloads: 10.9k
Score: 4.83/5.0
Timeframes: M15-H4
Repaints: Yes
Alerts: No
Signal frequency: 3-8 per day
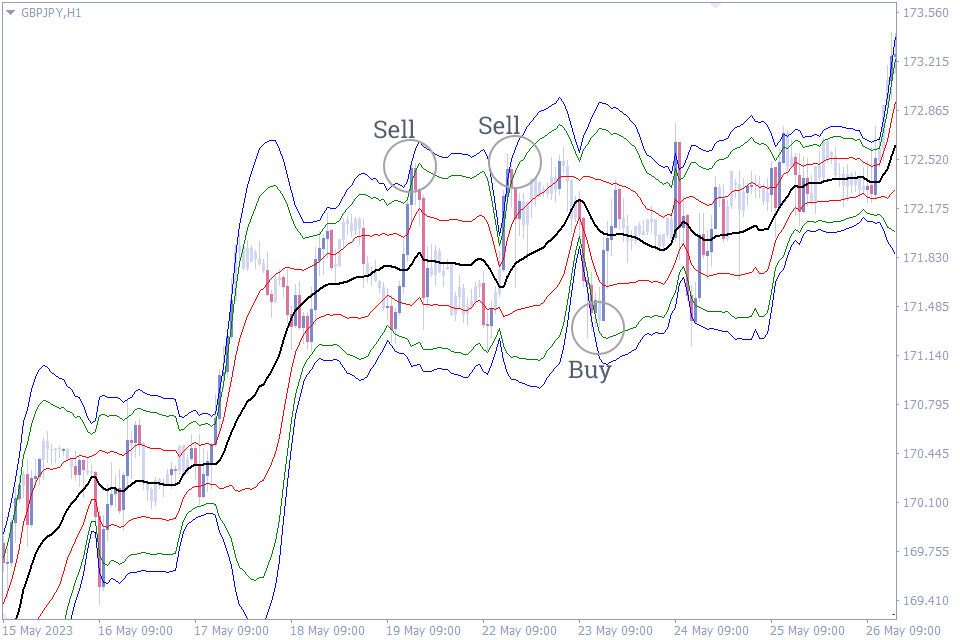
Trend followers will benefit the most from this Keltner channel indicator. Unlike many other trend channels, this indicator adjusts the channel width based on the average price movement over a certain period, meaning the channel width is not fixed. This unique feature aids technical traders to adapt according to market fluctuations.
Therefore, the dynamic channel offers traders flexible support and resistance levels. Traders can effortlessly buy and sell at the channel extremes or simply initiate trades by following the channel’s direction. The indicator is effective across all time frames and is highly beneficial for novice forex traders.
#13 Pivot Points All In One Indicator
 Downloads: 10.0k
Score: 3.0/5.0
Timeframes: M5-H4
Repaints: No
Alerts: No
Signal frequency: 3-5 per day
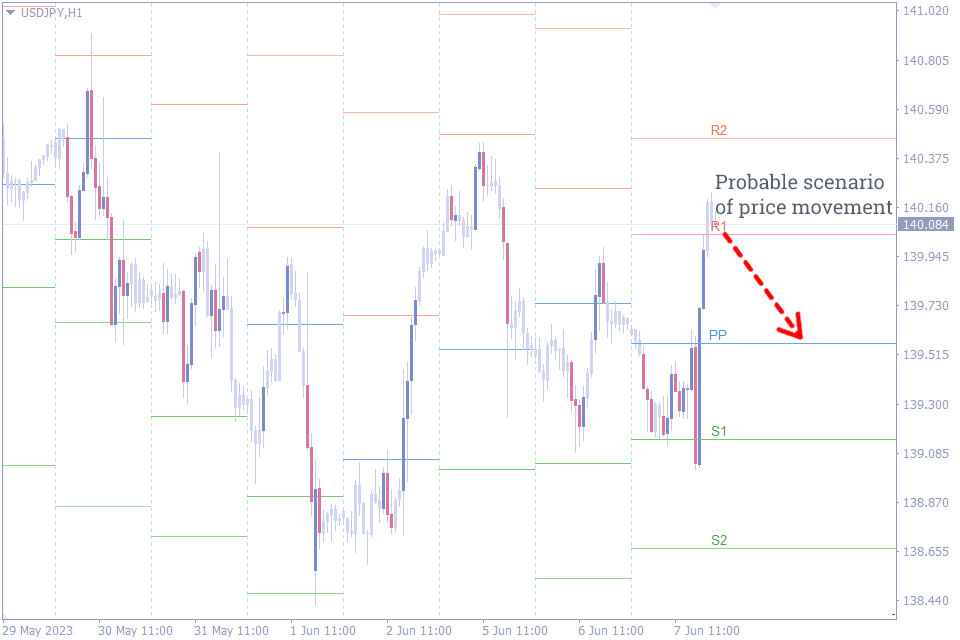
Pivot points form an integral part of most technical traders. Forex pivot points are calculated in multiple methods. However, the application of these is the same viz, to identify the support and resistance for the current day using the data of the previous day. Thus, the forex trader will have a predetermined support and resistance lines at the beginning of the day.
Since there are multiple methods for pivot calculation and to avoid installing multiple indicators to identify them we have the Pivot Points all in one indicator. Once installed the trader can their preferred method and the pivot will be automatically drawn on the price chart.
#14 RSI Divergence Indicator
 Downloads: 9.3k
Score: 4.91/5.0
Timeframes: M15-H1
Repaints: No
Alerts: Yes
Signal frequency: 3-5 per day
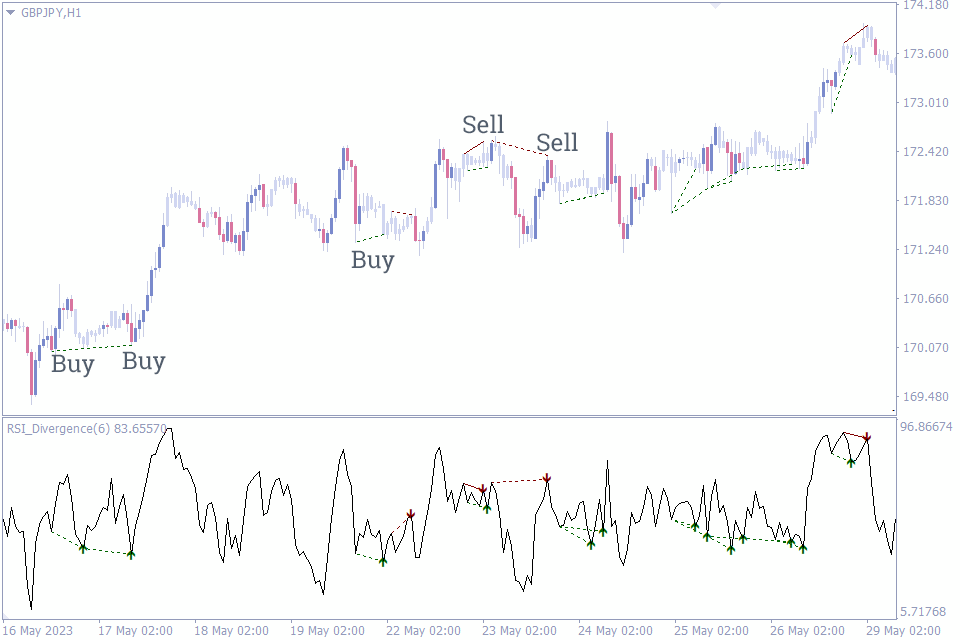
Divergence trading is a great trading strategy as it provides early entry in a trend. Divergence traders normally get in the market with the best possible price than most of other trend following forex traders. The RSI Divergence indicator for MetaTrader indicator plots the divergence lines on the price chart and the indicator window. Thus it helps traders to visually identify the divergence.
Though this indicator is effective in identifying the oversold and overbought conditions, the primary purpose of this indicator is to identity the convergence and divergence forex trading signals. New traders can benefit from the alerts.
#15 Forex Trading Sessions Indicator
 Downloads: 7.8 k
Score: 4.3/5.0
Timeframes: M15-H1
Repaints: No
Alerts: NO
Signal frequency: Nil
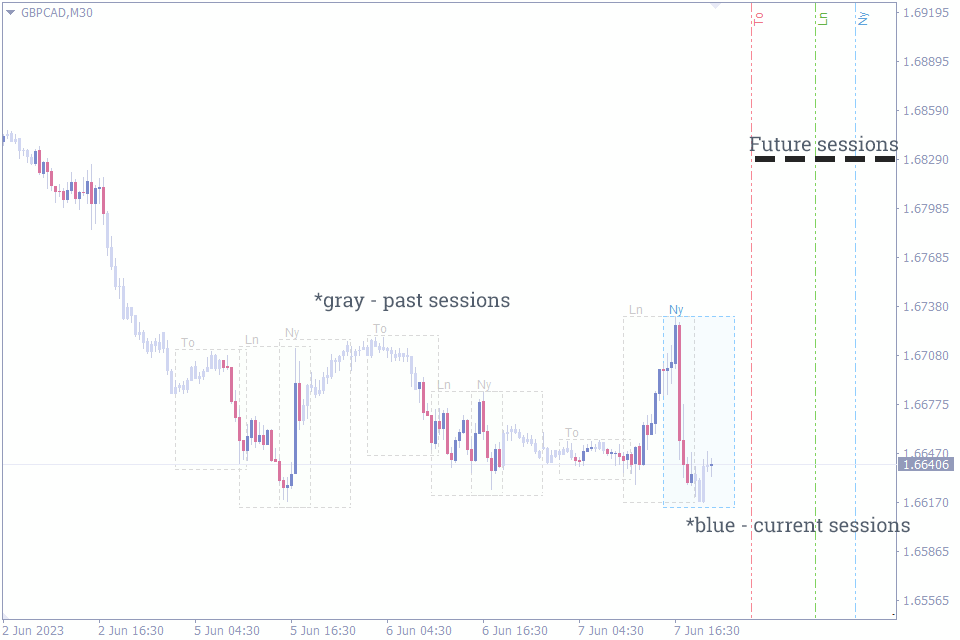
Generally, every trading session of the forex market has its own characteristics. So, most technical forex traders apply different trading strategies during each session, or simply use an entirely different set of indicators for different sessions. Most trading session indicators plot only the current session. However, the Forex Trading Session indicator for MT4 marks the past, current and future trading sessions.
Additionally, most fundamental new releases occur on top of the session. The indicator is highly customizable and handy for new and advanced forex traders. Once the indicator is on the chart it shows the sessions up to the H4 price chart.
#16 Advanced ADX Indicator
 Downloads: 3.7 k
Score: 0/5.0
Timeframes: M5-H1
Repaints: No
Alerts: No
Signal frequency: 2 to 5 per day
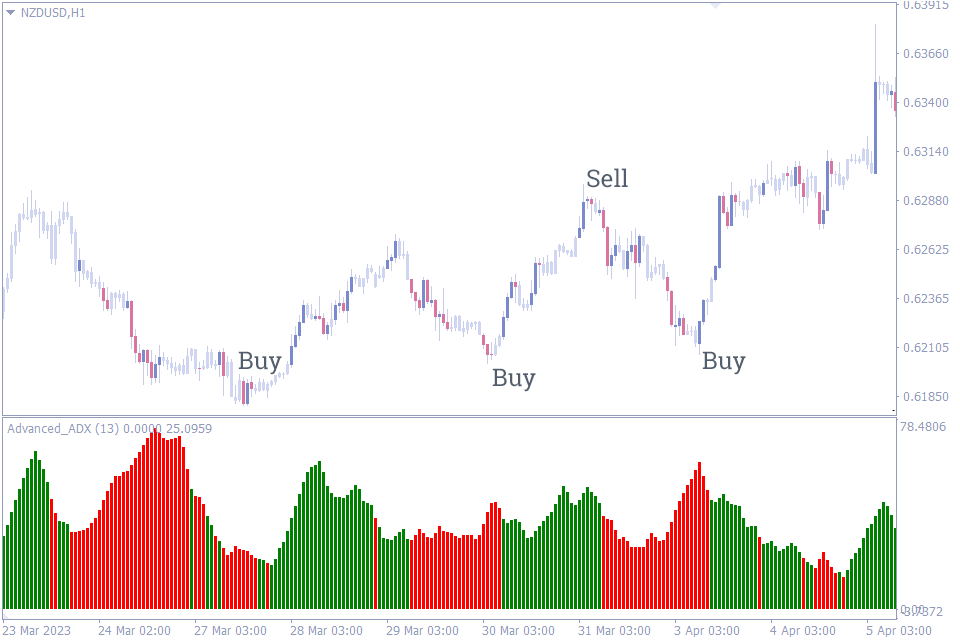
If the identification of the trend direction solves half the puzzle, the strength of the trend completes the rest of the puzzle of when to enter and exit a trade. The Advanced ADX indicator is slightly different from the classic built in indicator of MT4. This indicator plots the difference between D+ and D- as a histogram.
The trend strength is depicted by the length of the histogram. So, forex traders can visually understand if the trend is weakening and adjust the position accordingly. Thus the trader will have a early warning signal to exit the trade as the trend is weakening.
#17 Stochastic Divergence Indicator
 Downloads: 3.6 k
Score: 5.0/5.0
Timeframes: M15-H1
Repaints: No
Alerts: Yes
Signal frequency: 5 to 8 per day
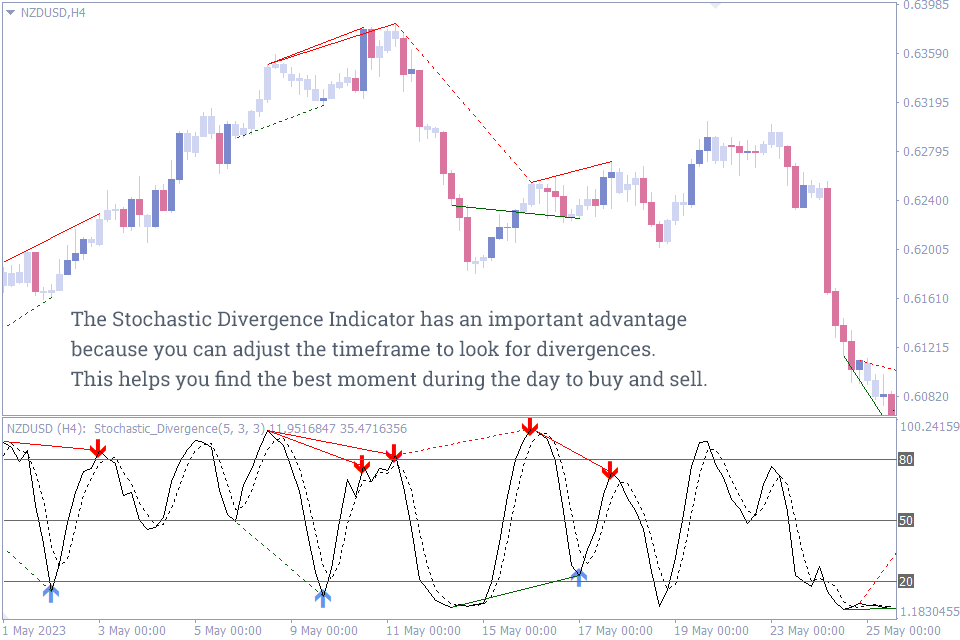
This is another divergence indicator using the classic stochastic indicator that provides profitable trading signals. The indicator provides arrow based buy and sell forex trading alerts. Additionally, traders can use multi time frame strategies using this indicator. Furthermore, the indicator plots the divergence lines on the price chart and on the indicator.
Though trading signals of the stochastic indicators form the basis for many auto trading strategies, it is recommended to use additional indicators for confirmation of the trading signals. The signals can be filtered using the higher time frame chart to help the forex trader stay in the direction of the higher time frame trend.
#18 Better Volume New Alerts Indicator
 Downloads: 2.2 k
Score: 5.0/5.0
Timeframes: M15-H1
Repaints: No
Alerts: Yes
Signal frequency: 5 to 8 per day
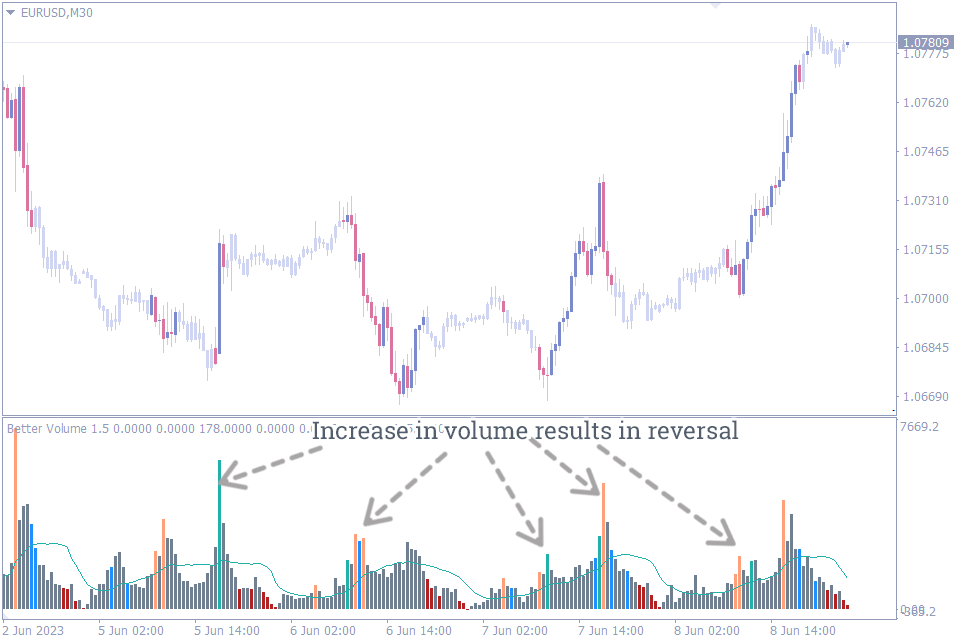
The Better volume new alerts indicator for MT4 helps forex traders to identify potential trend reversals using the volume. Additionally, it gives an insight about the price volatility and in turn assists the trader to understand the overall market volatility.
Intraday forex traders can get the best out of it by understanding the changes in volume during news releases and opening of trading sessions. A surge in trading volume is typically associated before a trend reversal. Moreover, the indicator plots the trading volumes as histogram. So, traders can visually understand the average volumes being traded and if there is any unusual activity on the volume before making a decision to be bullish or bearish.
#19 Aroon Indicator
 Downloads: 1.5 k
Score: 4.0/5.0
Timeframes: M15-H1
Repaints: No
Alerts: Yes
Signal frequency: 5 to 8 per day
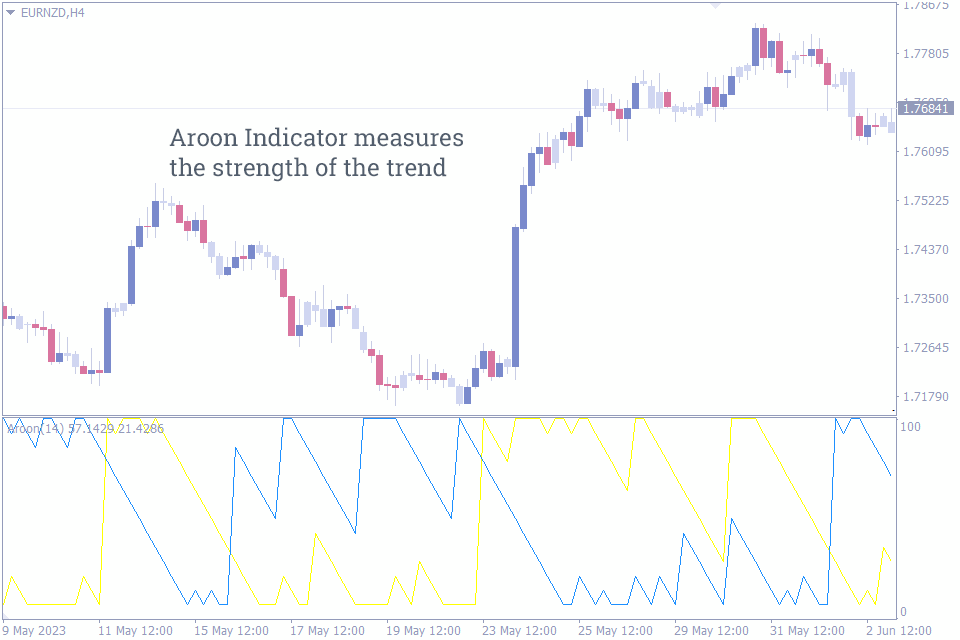
In both bullish and bearish market conditions, there is always a possibility of price reversal if the trend strength is weak. However, if the trend strength is strong it is prudent to stay in the trend direction as long as possible to benefit from the trend strength. The Aroon indicator measures the trend strength by using two lines one of uptrend strength and other for the downtrend strength.
As an oscillator any trend values higher than 50 indicate an opportunity to venture into the market. So, traders shall consider the indicator value higher than 50 or a crossover of the uptrend line above the downtrend line as a bullish signal and vice versa.
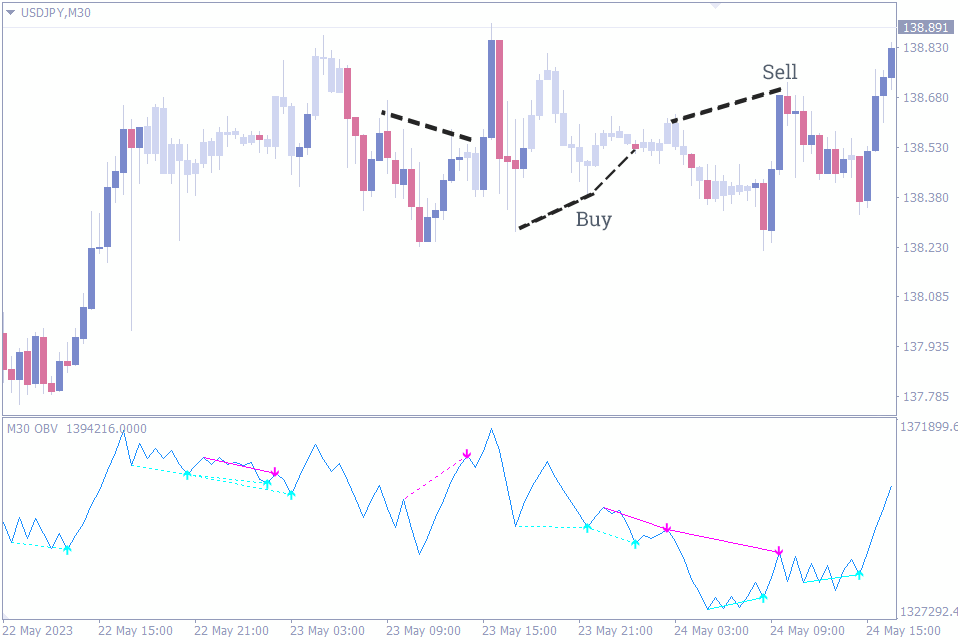
#20 OBV Divergence Indicator
 Downloads: 1.5 k
Score: 4.5/5.0
Timeframes: M15-H1
Repaints: No
Alerts: Yes
Signal frequency: 5 to 8 per day
The OBV – On Balance Volume Divergence indicator looks for divergence between price and volume as they are closely related. Additionally, the indicator is capable of detecting hidden divergences apart from the regular divergences. Furthermore, the indicator plots the divergences on the price chart and the indicator window simultaneously.
Additionally, the indicator provides an option to increase the sensitivity which provides more reliable trading signals.
Conclusion
To summarize, the best indicator for intraday trading depends upon the individuals own discretion. However, the FXSSI – Order book indicator and stop loss clusters indicators differ from the regular indicators. Furthermore they stand out in terms of quality in delivering profitable forex trading signals


Comment (1)
Excellent indicators for professional forex trading.. With the use of these custom indicators you listed, is their any need to set take profit target when using them or the trader need to exit the position by themselves when in profit..