

Top 10 Overbought Oversold Indicators for MT4 – Best for Your Forex Trading
This article discusses one of the most sought after technical analysis method by forex traders, using the overbought and oversold indicator conditions.
Most market reversals are anticipated to take place when market conditions reach either overbought or oversold. So, it’s obvious forex technical traders scan the charts to look for signs of these conditions. Generally, oversold and overbought indicators are oscillators formed by combining various inputs.
An oscillator helps forex traders to identify the bullish or bearish strength of the market. Oscillators are of two different types, some of them come with fixed high and low levels while others have no fixed high and low levels.
Generally, forex traders anticipate price reversals near these extreme levels. So, they look to enter the market with a buy trade once the oscillator reaches an oversold condition. Similarly, forex technical traders look to open a sell position once indicator values reach and overbought condition.
In many cases, price reversals may be associated with false reversal trading signals. Additionally, technical indicators may produce divergence or convergence trading signals. So, the most important factor is to look for confirmation of the price reversal using price action.
Trading at the extreme levels is highly rewarding, because these trades tend to reap a good risk to reward ratio. Forex traders entering at these price levels are at an advantage to enter the market much earlier than other traders.
Let’s now discuss about some of the best overbought oversold MT4 indicators and understand them much better.
Top-10 Overbought Oversold Indicators
- Overbought and Oversold Indicator
- Better Overbought Oversold Indicator
- Stochastic Cross Alert MT4 Indicator
- Clear Multi Timeframe Indicator
- Williams Percent Range Alert Indicator
- Tipu RSI Indicator
- RSI Extreme Zone Indicator
- De Marker Indicator
- Trend CCI Indicator
- Money Flow Index Indicator (MFI)
Overbought and Oversold Indicator
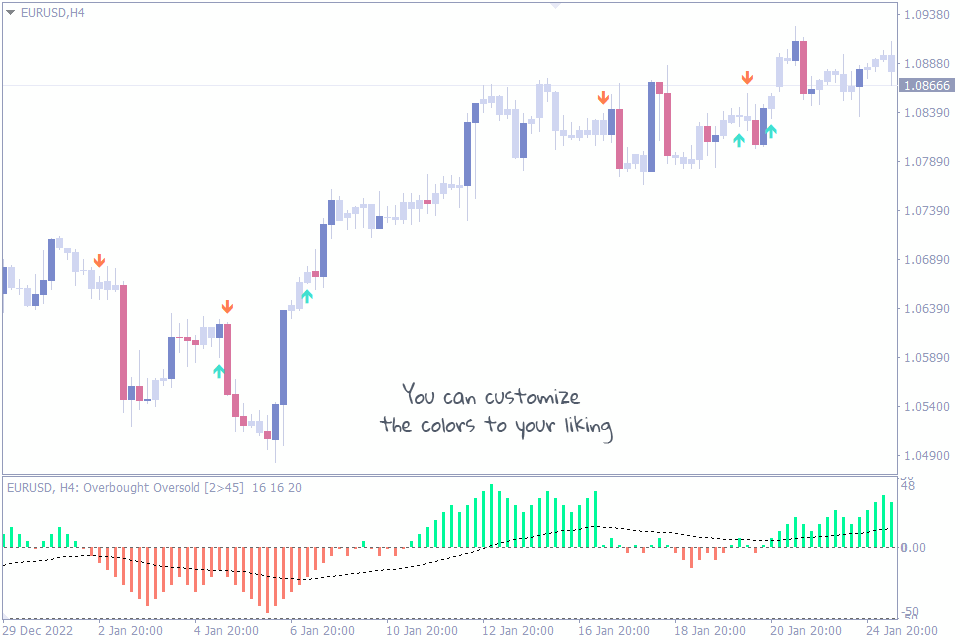
Let’s now discuss about the first indicator in our list of best Overbought and Oversold indicator. The overbought and oversold indicator combines multiple indicators like the moving average and CCI to generate the overbought and oversold histogram.
The histogram plays the major role in this indicator. It shows the market’s trend direction, histogram above the zero line is bullish and below the Zero line indicates a bearish trend. However, the histogram plots an upper level and lower level.
The upper and lower levels of the histogram indicate overbought and oversold conditions. Forex traders can anticipate price reversals once the indicator values reach these conditions. Generally, traders sold enter at one extreme level and target the opposite level.
For example, if a trader enters a buy position at an oversold level they should look to book profits at the next overbought level and vice versa. This helps the trade to ride the price reversal and benefit the most from the trend reversal.
Additionally, the indicator provides arrow based buy and sell signals using the crossover of the histogram and a signal line. Traders should ignore trading signals opposite to the trend direction as depicted by the histogram. These signals provide the trader with intraday trend trading signals.
In summary, the Overbought and Oversold indicator for MT4 provides excellent trading signals at the extreme conditions.
Better Overbought Oversold Indicator
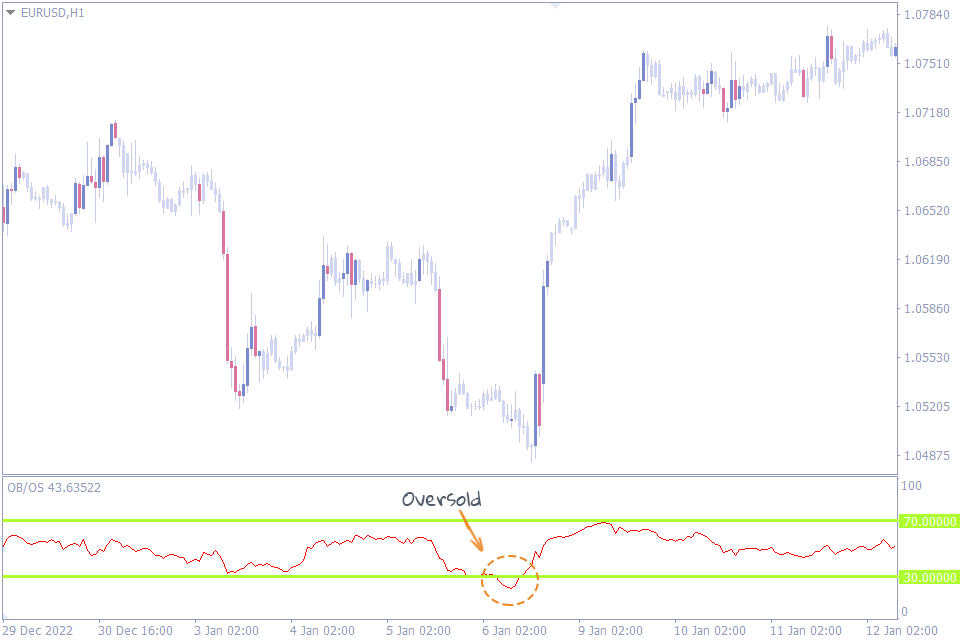
We will now move to the second indicator based on overbought and oversold conditions. The Better Overbought Oversold MT4 indicator provides trading signals based on the moving averages.
The indicator plots the moving average as an oscillator in a separate window. The upper and the lower levels of the oscillator are at 70 and 30 respectively. These levels are considered as extreme levels so forex traders should anticipate price reversals.
Forex trading is all about anticipating price movements in advance and placing the orders accordingly. Technical analysis is not for following the market
direction, but also to anticipate future price direction. Therefore, technical forex traders carefully monitor overbought and oversold market conditions.
The trading strategy for this indicator is pretty straight forward. If the indicator values rise and approach the 70 level, traders should look for selling the currency pair. Similarly, if the oscillator values move downwards and reach the 30 level traders should look for buying signals.
Another interesting fact about this indicator is the chart time frame. Since the indicator works based on moving averages it performs best at the higher time frames. So, it’s highly recommended to trade in a higher time frame chart using this indicator.
Some traders may find it difficult to sell while the price is moving upwards, as this is counter to the current market condition. However, traders should understand that overbought and oversold trading strategy is all about looking for price reversal signals.
Stochastic Cross Alert MT4 Indicator
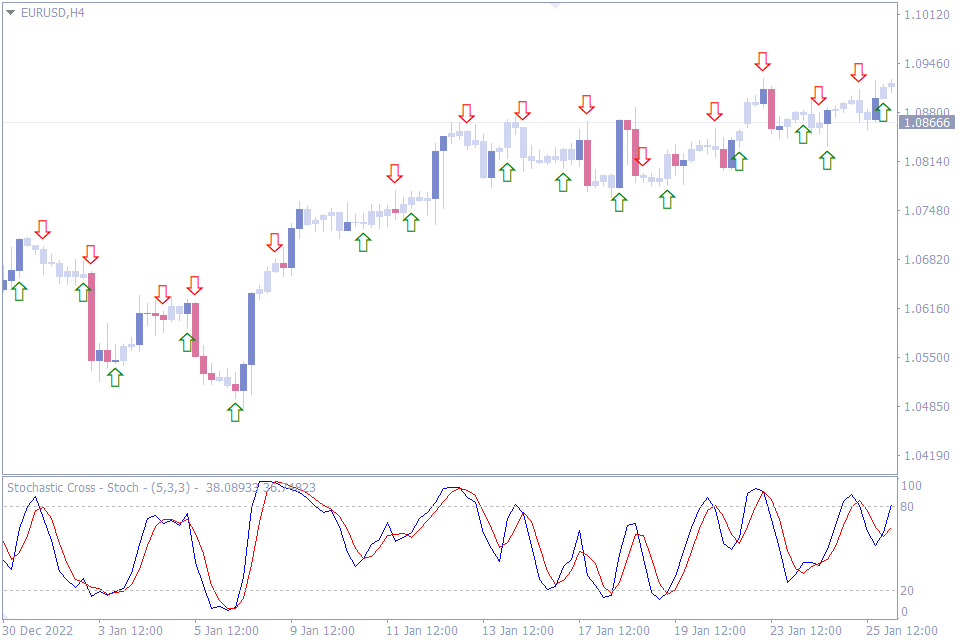
Let’s now discuss the third indicator in the list of best overbought and oversold indicators. The Stochastic Cross Alert indicator is based on the classic stochastic indicator and provides alerts if the price leaves and enters an overbought or oversold zone.
Stochastic oscillator is a very effective trading tool used by many forex traders. Additionally, the indicator is an essential component in many automated trading strategies. Most traders follow this indicator and apply it because it does not repaint.
Since it does not repaint the trading signals are of better quality. However, the trading signals of the stochastic oscillator are only valid if they occur at or above the oversold and overbought levels.
The classic stochastic indicator does not provide alerts. So forex traders should monitor the charts manually and follow the oscillator closely. However, the stochastic cross alert MT4 indicator solves that issue and helps traders to focus on trading rather than monitoring the charts.
The indicator provides signals if the main stochastic line enters the overbought or oversold zone or leaves the zone. Therefore, if the oscillator enters an oversold area forex trader should prepare a trade plan to buy. Once the oscillator leaves the oversold area and moves upwards then the trader should execute the buy order.
Similarly, if oscillator enters an overbought area trader should prepare a trade plan to sell. Once the oscillator leaves the overbought area the trader should execute the sell order.
Clear Multi Timeframe Indicator
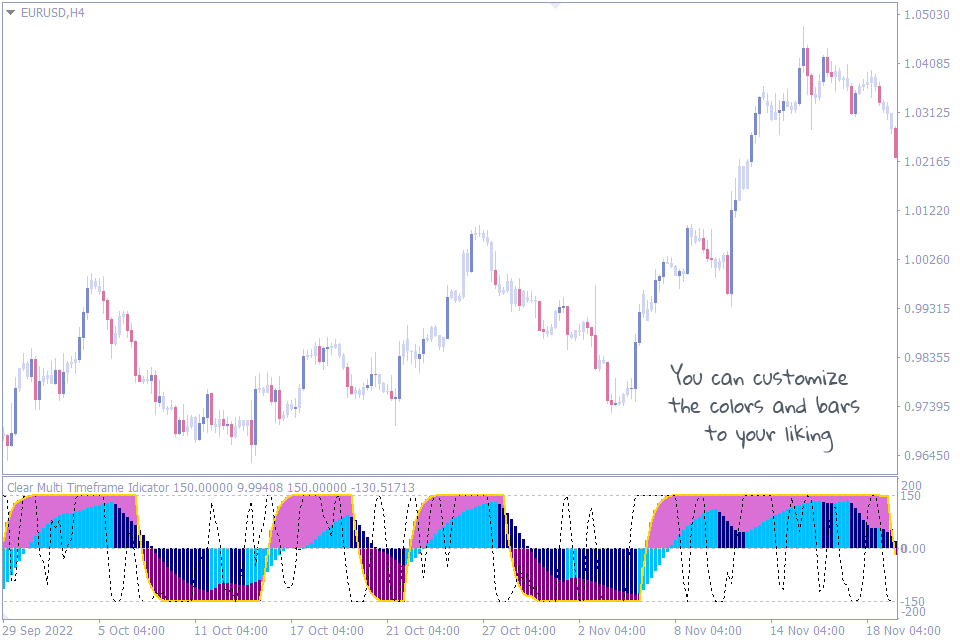
We will now move to the Clear Multi time frame indicator which is at the fourth place in our list of best overbought oversold indicators. This indicator provides forex trading signals by combining MACD, CCI and Laguerre Moving averages.
The indicator plots the CCI, MACD and Laguerre MA in a separate indicator window. Upper and lower levels are placed at +150 and -150. Once the indicator values reach these levels traders can consider the market to be overbought or oversold and anticipate trend reversals.
Another additional application of this indicator is its ability to confirm trend reversals. This helps traders to enter the market after confirmation for trend reversal and avoid false entry signals.
If the oscillator values move downwards and hits -150 traders should prepare a trade plan to place a buy trade. Since the indicator values are below -150 traders anticipate a price reversal. However the trader should now wait for a confirmation signal that indeed a reversal has taken place.
To confirm a trend reversal, traders should wait for the indicator values to move above the Zero line. Once the indicator values move higher the Zero lines it indicates a reversal has indeed taken place.
Thus the Clear Multi Time frame indicator not only helps forex traders to anticipate price reversals, but also helps to confirm trend reversals.
Williams Percent Range Alert Indicator
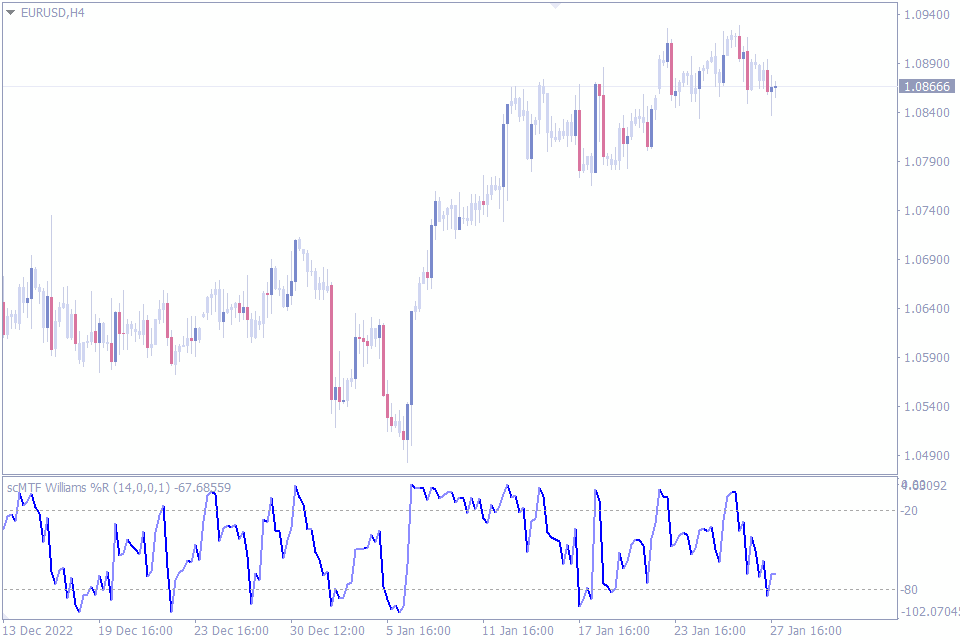
Let’s now discuss the fifth indicator, Williams Percent range alert indicator for MT4. This indicator provides alerts via multiple methods once the oscillator values hits the upper, lower or mid lines.
The Williams percent indicator is a momentum indicator, specifically designed to identify the oversold overbought market conditions. Though it is similar to the classic Stochastic oscillator indicator for MT4, it has a different approach to identify the oversold and overbought levels.
The indicator compares the closing prices with the highest and lowest price range for a predefined period, generally of 14 days. The upper level of the oscillator is at 80, while the lower level stands at 20. A value higher than 80 indicates an overbought condition and warrants a sell trade.
Similarly, oscillator values lower than 20 indicate an oversold condition and technical forex traders should look for buy signals.
The Williams percent range alert indicator helps the forex traders by providing alerts at various oscillator values. So, forex traders can enter the market based on the alerts. Traders can customize the alerts for overbought levels or oversold values or simply at a mid level.
The indicator provides emails the alerts, provides sound alerts and messages. Additionally, the indicator can send the messages to a mobile device.
In summary, the indicator is very handy for traders using the Williams percent indicator to identify the oversold and overbought price conditions.
Tipu RSI Indicator
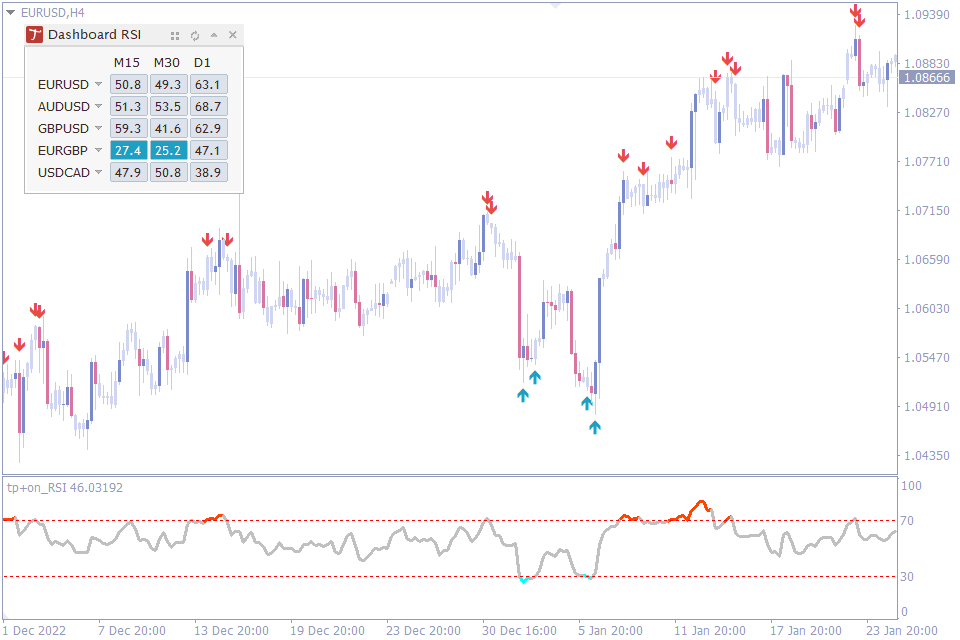
We are now moving towards the second half in the list of best oversold overbought indicators. The Tipu RSI indicator provides overbought and oversold levels based on the classic RSI indicator. Additionally, it provides a multi time frame dashboard and provides alerts.
RSI is the most sought after indicator used by many forex traders in technical analysis. RSI not only helps traders to identify the market trend direction, but also helps in identifying overbought and oversold market conditions.
The simple RSI calculations are a core in vast majority of automated forex trading strategies or expert advisors. RSI values do not change after candle close, hence the indicator does not repaint.
The Tipu RSI indicator for MetaTrader provides a dashboard that provides RSI values of multiple time frames of a particular currency pair. This helps the forex traders to stay in the direction of a higher time frame and enter the market using a lower time frame chart.
As a result, the Tipu RSI indicator helps the forex traders to execute multi time frame ( MTF ) trading strategies with ease.
Additionally, the indicator provides alerts once the price enters or exits an overbought or oversold zone. This enables the trader to focus on trading strategies rather than looking at the price charts. Furthermore, the indicator can deliver the alerts in multiple methods.
RSI Extreme Zone Indicator
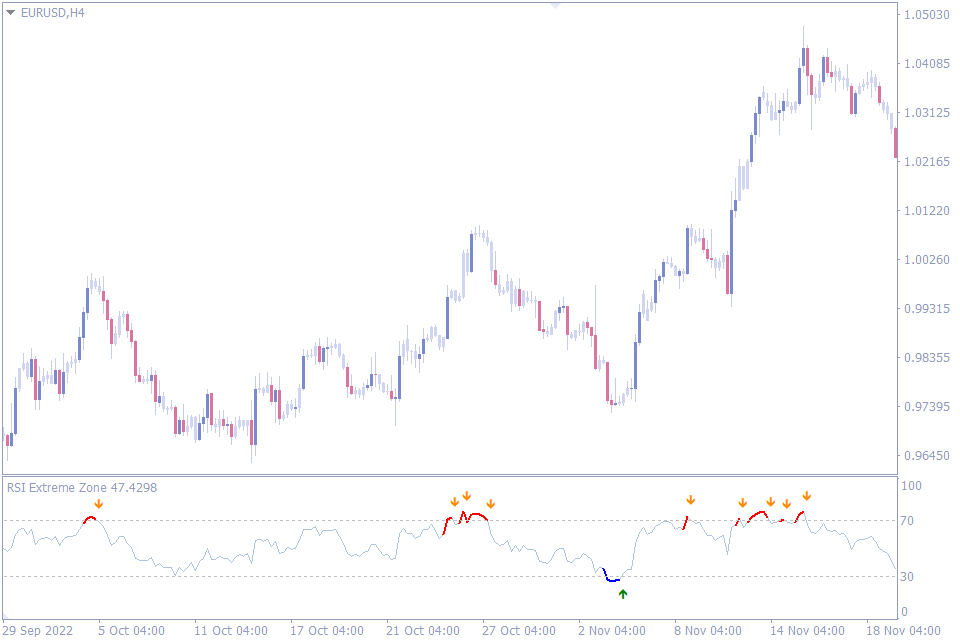
Our seventh indicator in the list of best overbought and oversold indicator is the RSI extreme zone indicator. This indicator uses the RSI – Relative strength index to determine the oversold overbought levels.
It’s imperative to see another RSI based indicator in our list of best oversold and overbought MT4 indicators. Relative strength index is a simple and reliable method to identify the oversold and overbought market condition.
The RSI extreme zone indicator changes the color of the oscillator once the RSI value enters the overbought or oversold levels. These visual clues combined with arrow trading signals help the forex trader to promptly identify every trading opportunity.
Additionally, the alerts at extreme levels further help the trader. During a bullish market condition the oscillator moves upwards and hits the upper level. Once the oscillator hits the upper level, the indicator line changes it color to RED and alerts with a Red arrow indicating a sell trading signal.
Similarly, in a bearish market condition the indicator line moves downwards and hits the lower level. Once the lower level is hit the indicator line color changes to blue and alerts with a green arrow trading signal.
In summary, the RSI extreme zone indicator helps the forex trader by providing visual and arrow trading signals.
DeMarker Indicator
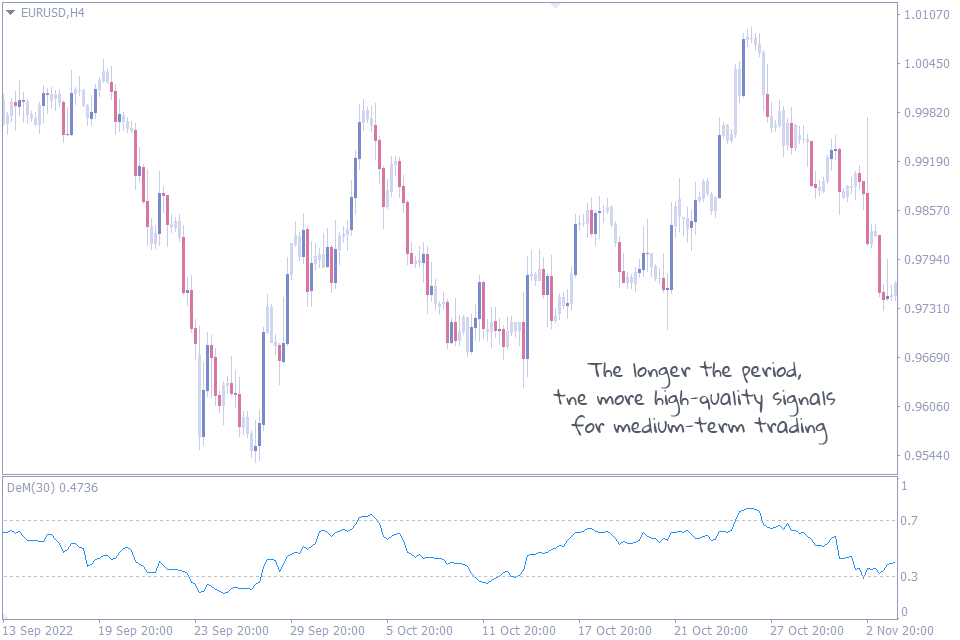
Our next indicator in the list is based on the classic DeMarker MetaTrader indicator. This indicator is a momentum indicator that provides overbought and oversold levels.
The De Marker indicator is a trend following indicator, however as an oscillator it helps to identify the oversold and overbought market conditions. The default upper and lower levels of the oscillator are at 0.7 and 0.3 respectively.
Another important aspect of the indicator is that it provides divergence and convergence trading signals along with oversold and overbought trading signals.
Traders should note that De Marker indicator works well in higher time frame price charts as it is a trend indicator in nature. So, traders should ignore trading signals at lower time frames as they tend to be choppy.
Trend CCI Indicator
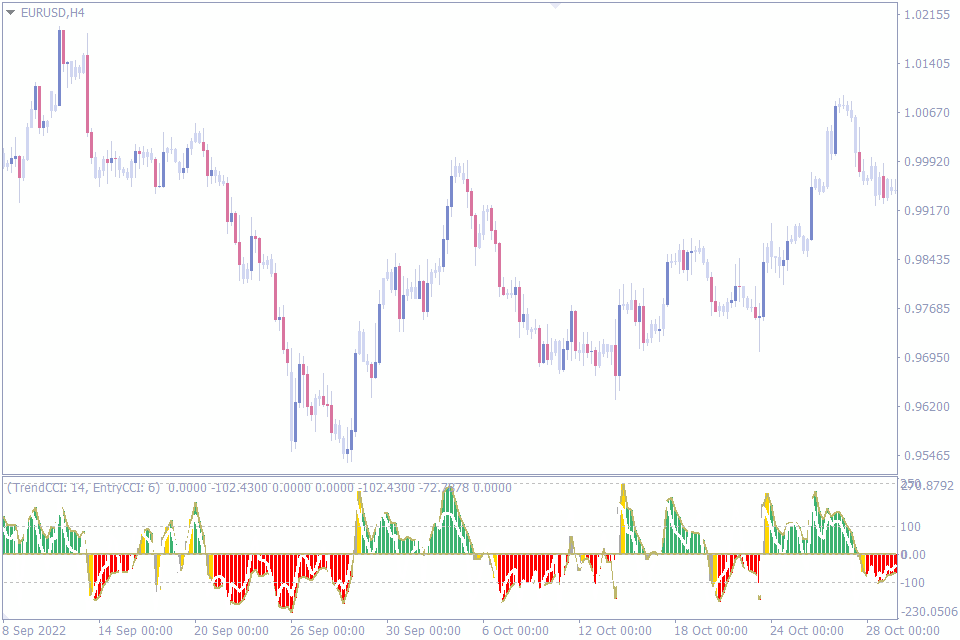
The ninth indicator in our list of best oversold and overbought MT4 indicator is the Trend CCI indicator. This indicator works based on the classic CCI – Commodity channel index MT4 indicator.
As the name suggests the indicator is a trend following indicator that works well across multiple time frames. However, the indicator also provides overbought and oversold levels effectively. By default the extreme levels of this indicator are set at +250 and -250.
At these extreme levels the indicator suggests a price reversal and in turn helps forex traders to anticipate price reversals. However, many forex traders tend to wait for the oscillator line to cross the Zero line as a confirmation of trend reversal.
In any case, the indicator provides the reversal signals at the overbought and oversold levels. It’s at the trader’s discretion to enter them at the overbought oversold levels or wait for reversal confirmation signal.
In summary, this trend following indicator provides overbought and oversold trading signals at the extreme levels. Furthermore, it provides trend reversal confirmation signals using the Zero line.
Money Flow Index Indicator (MFI)
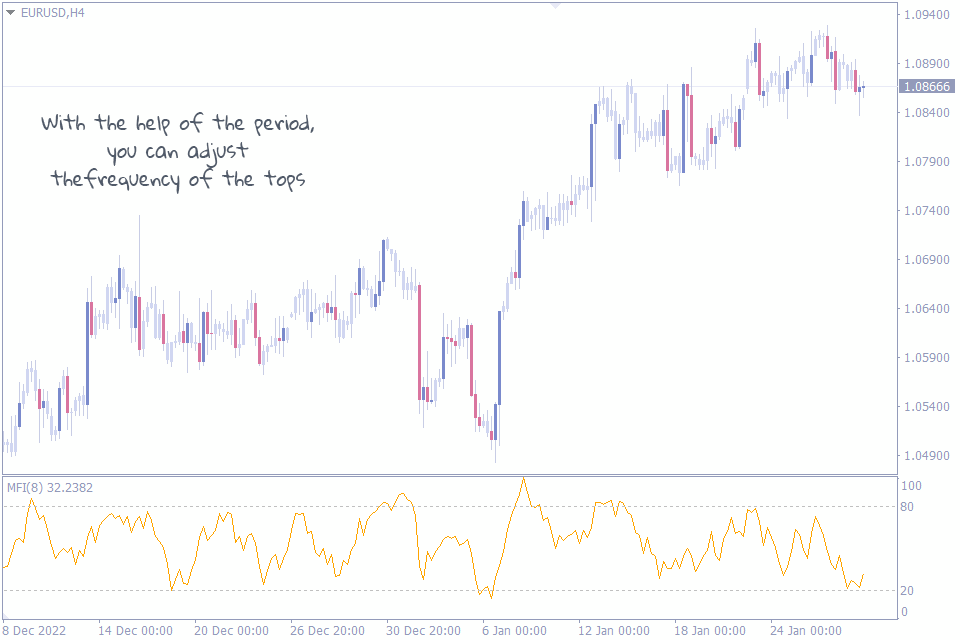
We have now reached the last indicator in the list of best overbought and oversold MT4 indicators. The Money Flow Index (MFI) MetaTrader indicator identifies the overbought and oversold trading conditions using an important parameter, the trading volume.
Trading volumes speak a lot about the current market condition and the interest of the current buyers and sellers. The demand and supply of any financial instrument or currency pair will be clearly identifiable using the trading volumes.
When trading volumes increase in a bullish market condition, traders anticipate the trend to continue. However, when trading volumes increase at a supply or demand level such as a support or resistance it signals a significant market condition.
For example let us consider during a bullish market condition price reaches a resistance. At this resistance level if the trading volumes increases with the presence of selling pressure we can anticipate a price reversal.
The Money flow index indicator is an oscillator that shows the trading volumes of the currency pair and helps the forex trader to identify potential overbought and oversold conditions. This alerts the forex traders to look for price reversal confirmation signals.
Conclusion
In this article we have discussed the best indicators for forex traders looking at the oversold and overbought market conditions to enter the market. Generally, forex traders tend to enter in a oversold condition and hold the positions until the market reaches the other extreme to display overbought conditions.
However, many traders look to exit the trades with a good risk and reward ratio. Similarly, the stop losses of these are relatively smaller when compared to trend following signals. So, trading overbought and oversold conditions generally provide profitable results. However, it is highly recommended to trade this signals after additional confirmation.


Leave a Reply