
Best Momentum Indicators for MT4
Momentum is an excellent measurement to identify potential weakness in the current market trend. It also indicates if a weakness is indeed dragging the trend to slow down and eventually lead to a price reversal.
Identifying a price reversal will help the trader to exit a current position profitably. Furthermore, it enables the MT4 technical trader to enter into the trend earlier with a buy or sell position and places the trader in a commanding position in that particular trade.
Momentum can be measured in multiple methods. Various MetaTrader indicators use different approaches and calculations to identify momentum. More interestingly, these indicators also combine other indicators and mathematical functions to enhance the trading performance.
In this article we have compiled ten best momentum indicators that will enhance the trading performance of the forex traders. Below, we will discuss the importance of these indicators, their function and application to have a profitable trading.
Top Momentum Indicator
- ROC Indicator
- Stochastic Momentum With Arrows Indicator
- Momentum Divergence Indicator
- Momentum ATR Normalized Signal Indicator
- Chande Momentum Oscillator Indicator
- MACD Momentum Indicator
- Momentum Indicator
- Linear Momentum Indicator
- Momentum Reversal Detector Indicator
- Tipu RSI Indicator
ROC Indicator
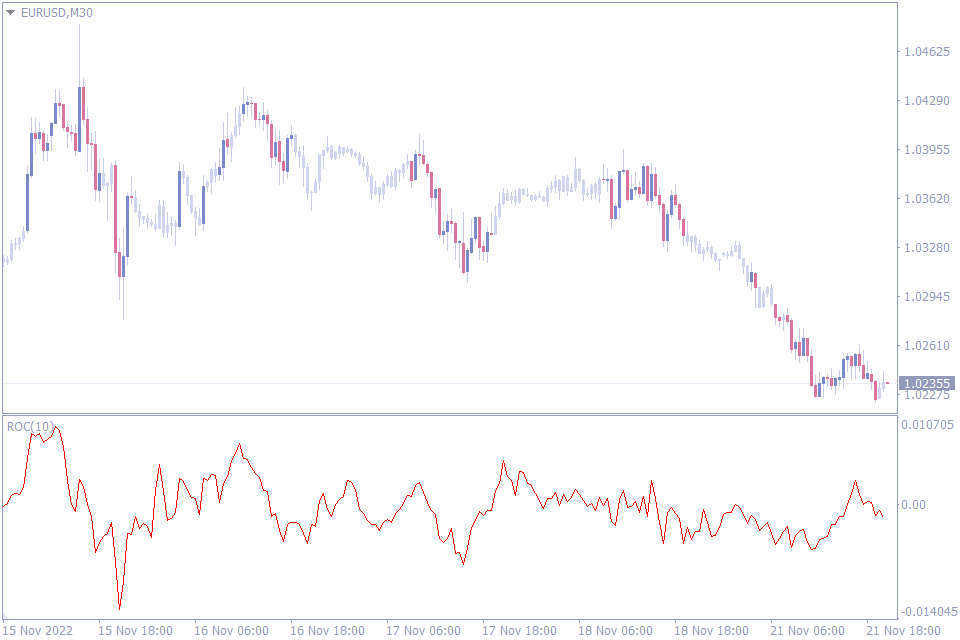
Let’s now start looking at the indicators. Our first indicator in this list of best momentum indicators is the ROC – Rate of change indicator for MT4. This indicator provides trading signals in multiple methods and helps the trader to formulate trading strategies.
The indicator is very easy to understand and plots a single line. This oscillator provides a zero line that defines the bullish or bearish nature of the market. Forex traders can understand the market trend at a glance and plan to trade accordingly.
Forex traders can identify the next method of trading signals by plotting the support and resistance of the indicator. The ROC indicator’s oscillator values reveal support and resistances. Traders can draw trend lines on the oscillator and identify best reversal points.
The key application of the indicator is to measure the momentum. Once the indicator values fall below the ZERO line it indicates the beginning of a bearish trend. If the oscillator retraces and moves higher then, traders can understand that the momentum is weakening.
On the other hand, if the oscillator moves above the ZERO line and continues higher it indicates the bullish price momentum. Traders should consider any weakness in this as trend weakness.
Another interesting method is to apply the divergence trading strategy using the divergence and convergences of the oscillator. Any divergence can be considered as momentum reversal and in turn price reversal.
Stochastic Momentum With Arrows Indicator
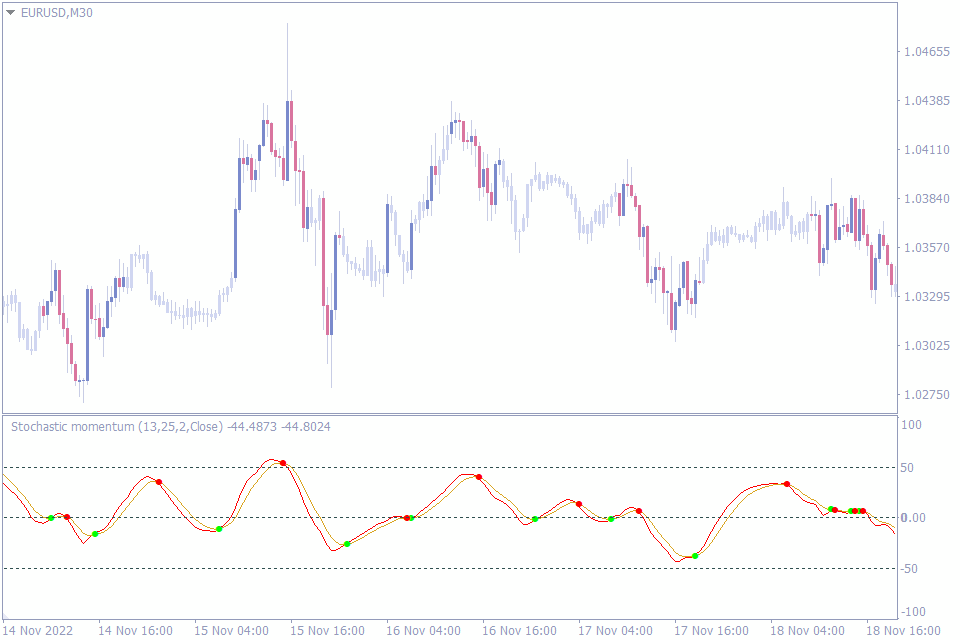
Let’s now discuss the second indicator in this list of best momentum indicators. The Stochastic Momentum with Arrows Indicator provides buy and sell forex trading signals according to the momentum.
The heart of the indicator is the classic MT4 Stochastic oscillator. However, the Stochastic Momentum with Arrows indicator applies the closing price of the trading instrument for calculating the oscillator values. So, the resulting oscillator values are highly sensitive to changes in momentum.
Since the indicator is very responsive, it produces early trading signals than the classic stochastic indicator. Furthermore, the indicator plots the Zero line and oscillates between an upper level of +50 and a lower level of -50.
From a trading perspective, any oscillator value above the Zero line indicates a bullish trend. So, traders should look to enter the markets with a buy trade. On the other hand, stochastic momentum with arrows indicator values below Zero line indicates a bearish market trend. So, traders should look to enter the markets with sell positions.
Furthermore, the indicator has two filters to smoothen the values. As a result, the indicator provides smoother oscillations.
Another interesting feature is the trading signals. These trading signals should be further filtered based on the location of the signals and Zero line. Any bullish signals below the Zero line should be invalidated. Similarly, any bearish trading signals above the Zero line is null and void
Momentum Divergence Indicator
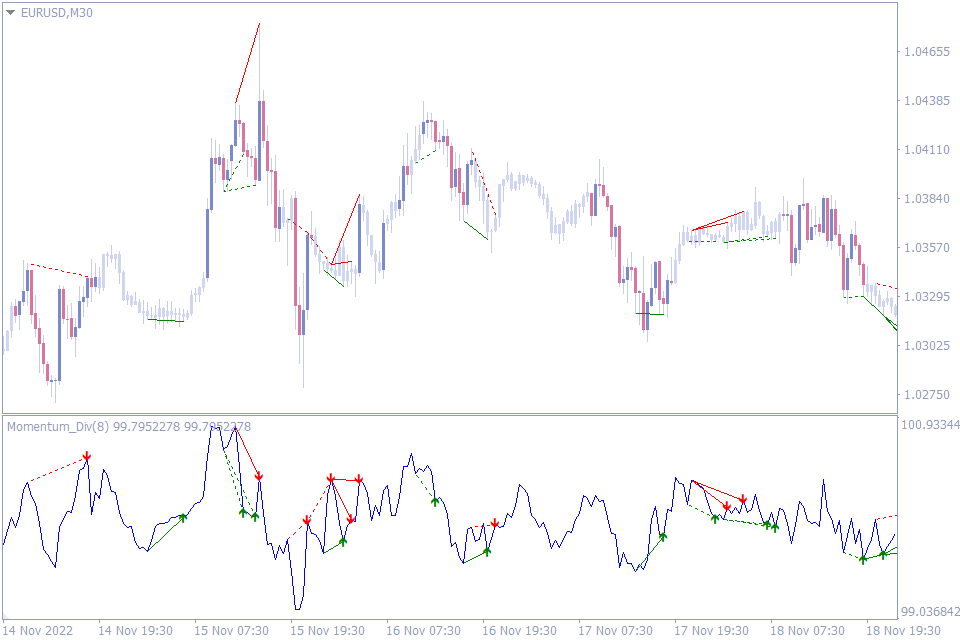
We will now discuss the third indicator in our list. The Momentum Divergence Indicator automatically identifies divergence and draws the divergence on the indicator and the price chart. As a result, it helps forex traders to identify the divergence automatically and provide buy and sell trading signals based on them.
Generally, forex traders use the classic MT4 indicators like the MACD and RSI to identify divergence and convergence. However, the Momentum divergence indicator allows the trader to use open, close, high, low or median values to construct the indicator. As a result, the indicator is highly customizable by forex traders of any level.
The main benefit of this indicator is its ability to automatically identify and plot the divergence lines on the chart and oscillator. Based on these divergences the indicator provide buy and sell arrow trading signals. Since the trend lines are plotted on the price chart too, it helps the forex traders to confirm the trading signals manually, before executing them.
Traders can use the divergence trading signals to exit the current trading positions if any, or enter new positions. Additionally, the indicator alerts the trader as pop up alerts once the trading signals are available.
Momentum ATR Normalized Signal Indicator
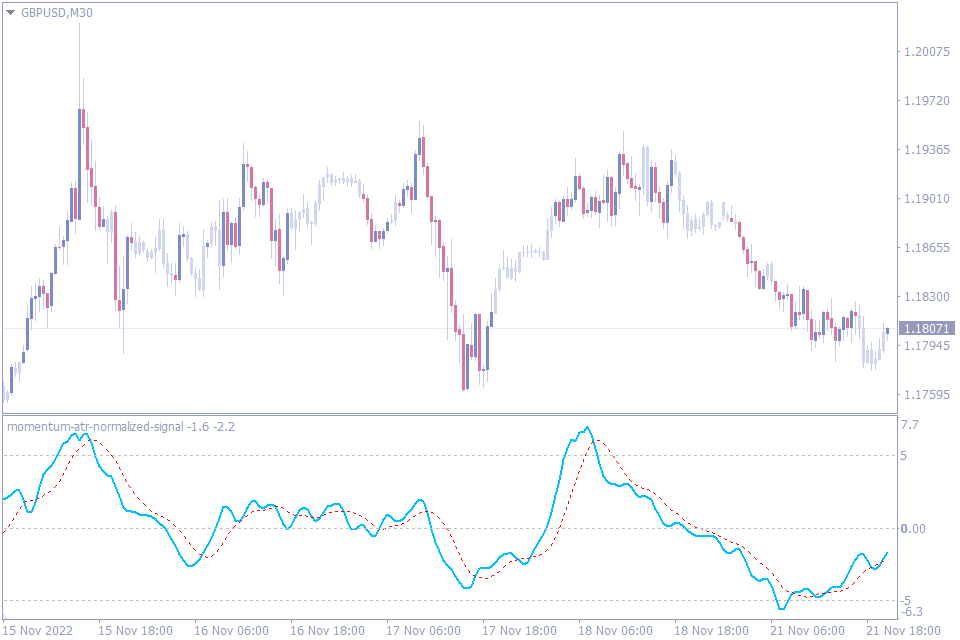
Let’s start to discuss the fourth indicator in the list of best momentum indicators for MT4. The Momentum ATR Normalized Signal Indicator provides buy and sell forex trading signals based on the crossover over of the momentum line and signal line.
The indicator consists of two lines, the Red line is the momentum line and the Blue line is the signal line. The first trading strategy is based on the crossover of the Blue line and the Red line.
When the blue signal line crosses above the red momentum line, forex traders can anticipate bullish price trend. This warrants a buy trade. Similarly, if the blue signal line crosses the momentum line downwards, it indicates a bearish price trend. So, forex traders can enter the market with a sell position.
The trading strategy is to look for divergences between price and the oscillator. Any divergence between them is a trading signal. However, like any divergence trading strategy forex traders should look for additional conformation before trading the divergence trading signals.
Chande Momentum Oscillator Indicator
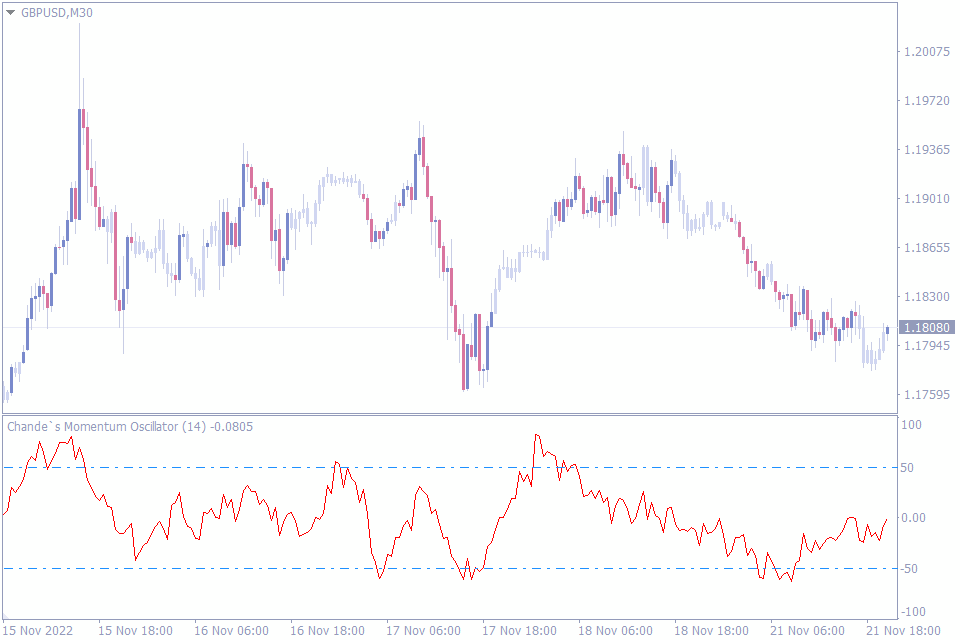
We will now move to the fifth indicator. The Chande Momentum Oscillator Indicator measures the market momentum and helps forex traders identify the ranging markets, oversold and overbought market, bullish and bearish market conditions.
This momentum indicator ranges between -100 to +100 with a Zero line. The indicator provides an interesting look at the market sentiment using Zero line, + 100/ -100 and +50/-50 lines. If the oscillator values are around the Zero line, it indicates a ranging market. So traders should avoid trading during these market conditions.
If the oscillator is above the Zero line, it indicates a bullish market momentum. Likewise, if the values are below Zero it denotes a bearish market condition. Based on this value it is very easy for traders to gauge the market trend.
According to the Chande momentum oscillator, the market is considered overbought if the oscillator values are higher than +50. This helps traders to anticipate trend reversal conditions and keep an eye for reversal trading.
On the other hand, oscillator values lower than -50 indicate the oversold market condition. So, traders should for reversal trades.
Furthermore, the +100 and -100 lines indicate the presence of a very strong momentum. In such conditions traders should be cautious in entering the markets as the momentum is strong. Thus the Chande Momentum Oscillator Indicator helps the forex traders to gauge the market conditions in multiple methods.
MACD Momentum Indicator
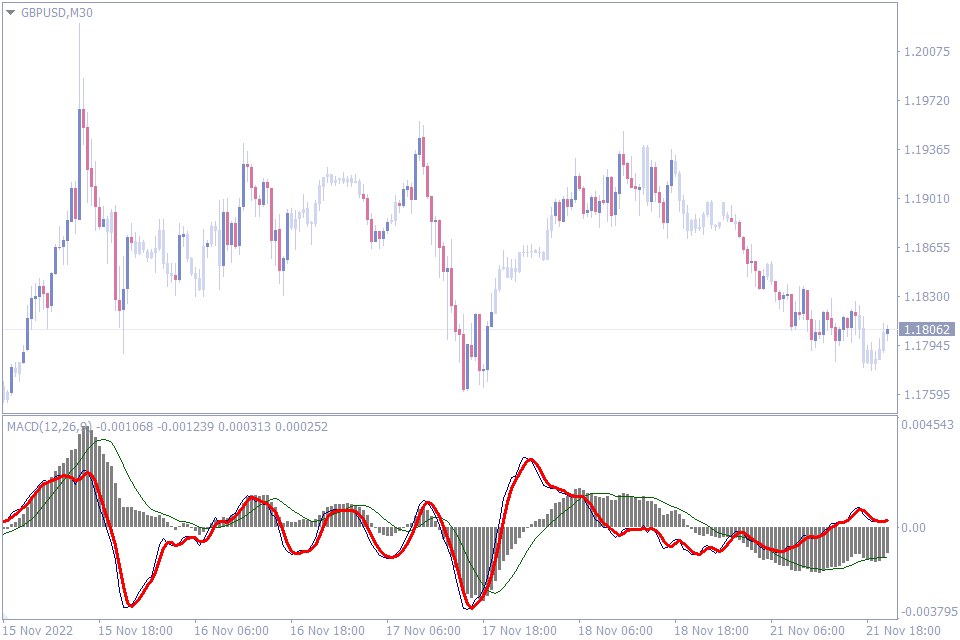
Here let’s move to the sixth indicator of our top momentum indicator list. The MACD – Moving Average Convergence and Divergence indicator for MT4 is a well known indicator. It is widely used by new and advanced forex traders alike.
The application of this indicator is versatile and is well suited for automated trading strategies. So, a multitude of auto trading software accommodates and implements the MACD indicator within them. Though the MACD indicator has a robust indicator input settings, they are very simple to interpret.
The simplicity of this indicator makes is easy for new forex traders to apply them and follow them. Likewise, advanced forex traders combine the indicator with other technical indicators to formulate complex trading systems.
The specialty of this indicator is its responsiveness. The indicator is very responsive and reflects momentum changes in all time frames including the intraday time frames and higher time frames. Thus, it enables all types of forex traders including scalpers, short-term and long-term traders.
Under the hood, the indicator uses the Exponential moving averages to calculate recent price changes. More weight is added to the recent price data, so momentum changes reflect as quickly as possible in the indicator values.
In addition to the MACD indicator lines, the indicator also has a histogram. The histogram and the signal lines constitute the essential components for trading signals. Additionally, the ZERO line of the indicator adds value and identifies the trend direction.
Any oscillator value above the ZERO line indicates a bullish momentum, while any values below ZREO line are bearish. The crossover the signal line together with the histogram bars confirm the buy and sell trading signals.
Momentum Indicator
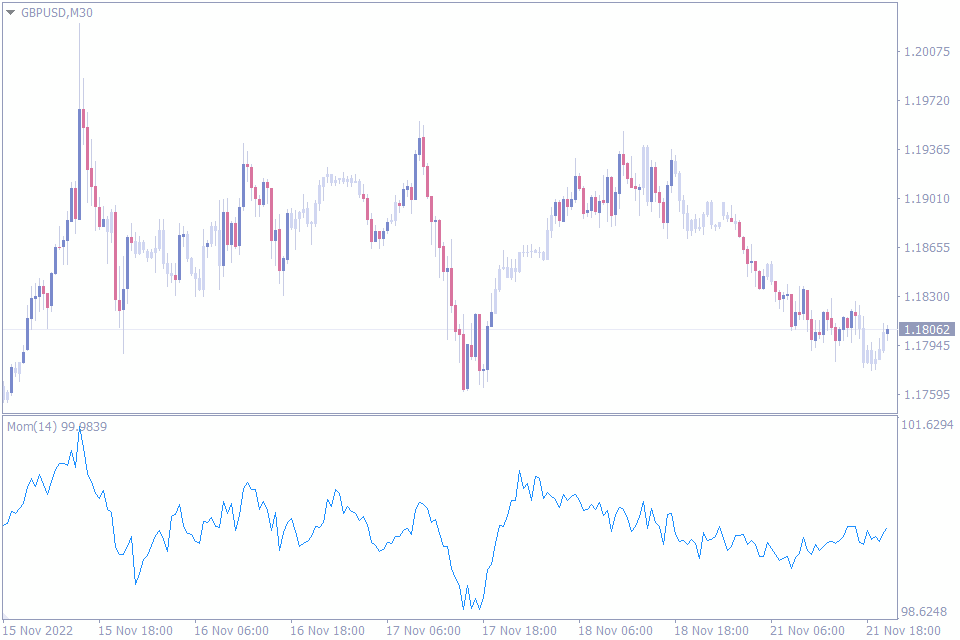
We will now discuss the seventh indicator in the list of top momentum indicators. The Momentum indicator for MT4 is another widely tried, tested and applied indicator by many forex traders. The indicator provides a single line as an oscillator and is simple to understand.
Traders should not ignore this indicator due to its simplicity. The Momentum indicator is well suitable to formulate automated trading strategies and forms a part of numerous trading systems. However, the only customizable input setting of the indicator is the period.
The Momentum indicator is very quick in responding to momentum changes. The direction of the oscillator shows the trend direction or momentum direction. A rising oscillator values indicate a bullish momentum, while falling oscillator values shows the market is bearish. This helps the traders to identify the momentum direction at a glance.
Any change in the direction of the momentum oscillator indicates a weakness in momentum. So, traders can adjust their existing positions to accommodate momentum changes. The indicator is not only used to understand strength of momentum and its weakness. It also helps to identify best entry points.
The best application of the momentum indicator is identifying the divergences. Since, the momentum changes reflect pretty quickly in the indicator. The divergence and convergence are also reflected quickly.
This helps the technical traders to identify the best divergence and enter the markets with ease. Since divergences enable traders to spot reversal signals earlier, they help traders to enter the trend earlier. Early enter enables traders to enhance their profit potential.
Linear Momentum Indicator
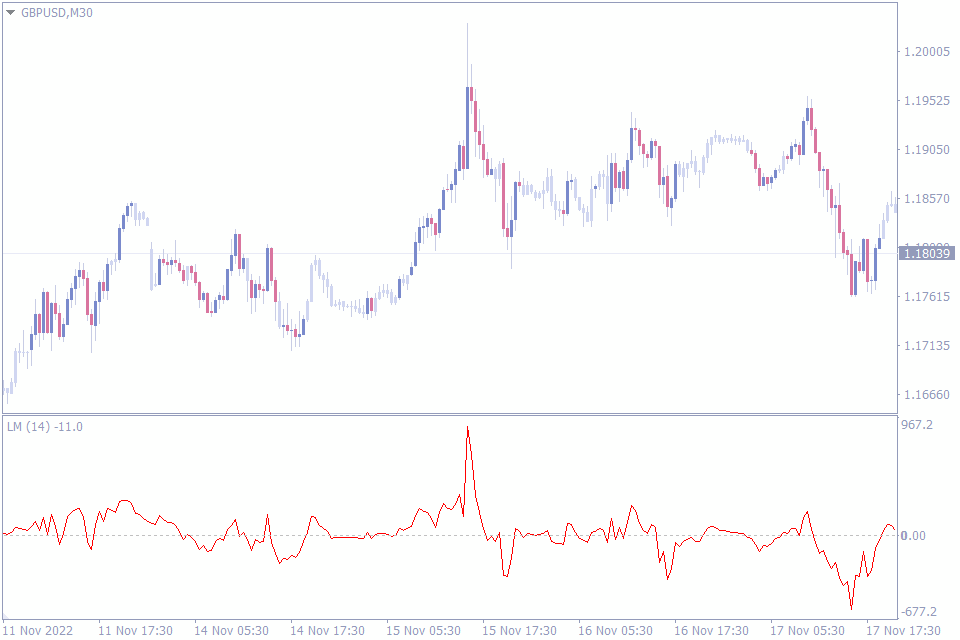
Let’s now have a look at the eighth indicator of our list. The Linear Momentum Indicator is a very essential tool as it combines volume with price value to calculate the indicator values. The indicator applies an additional smoothing method using the exponential moving averages to deliver the final indicator values.
The indicator does not generate buy and sell signals outright. However, traders can identify the market sentiment easily and trade accordingly. In general the values float around the Zero line. Once the momentum builds into the price combined with the volume, the oscillator moves sharply either in the up or downward direction.
The increased indicator values make the indicator move far from the zero line. An upward movement from Zero line indicates a bullish market momentum. So traders should look for buying opportunities. Likewise, a downward indicator movement shows bearish momentum. This alerts the traders to look for selling opportunities.
If the oscillator values return to the Zero line then traders should consider exiting their current trading positions or look to exit partial positions and manage the rest.
Another important trading strategy is to look for divergence trading signals. Like other momentum indicators the divergence signals of the Linear Momentum indicator provides early reversal trading signals using divergence.
Momentum Reversal Detector Indicator
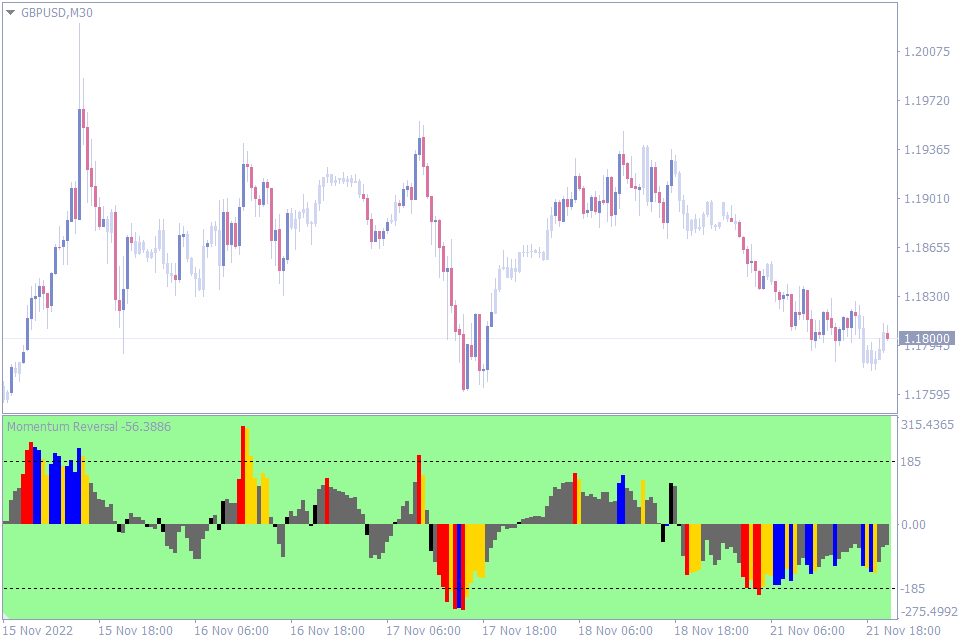
We have reached almost the end of the list of best momentum indicators. The Momentum Reversal Detector indicator for MT4 is best suitable for momentum trading in line with higher time frame price charts. The indicator visually displays the momentum changes, momentum reversal, and momentum in a higher time frame chart, bullish divergence and bearish divergence in different colors.
The major difference between this indicator and other momentum indicators is the visual representation using various background colors. This enables the technical forex traders to identify the market conditions immediately with ease.
Firstly, the momentum reversal detector indicator histogram color changes to black if the indicator detects a change in momentum. To simplify traders can enter or exit the markets using the black histogram color change as it represents reversal of the momentum.
Another interesting feature is the appearance of the Pale green color on the chart back ground. It indicates positive momentum in a higher time frame chart than the current time frame. This helps MTF – Multi time frame technical traders to trade in the market direction of the higher time frame charts.
Identifying divergence automatically is another important aspect of this indicator. The indicator not only plots the divergence in the current time frame charts, but also alerts the trader of the presence of divergence in a higher time frame chart.
The background color of histogram changes to Majenta if a bullish divergence is detected on a higher time frame. On the other hand the histogram background changes to Lime for a bearish divergence.
In summary, the indicator helps the traders in multiple methods to trade with visual representations.
Tipu RSI Indicator
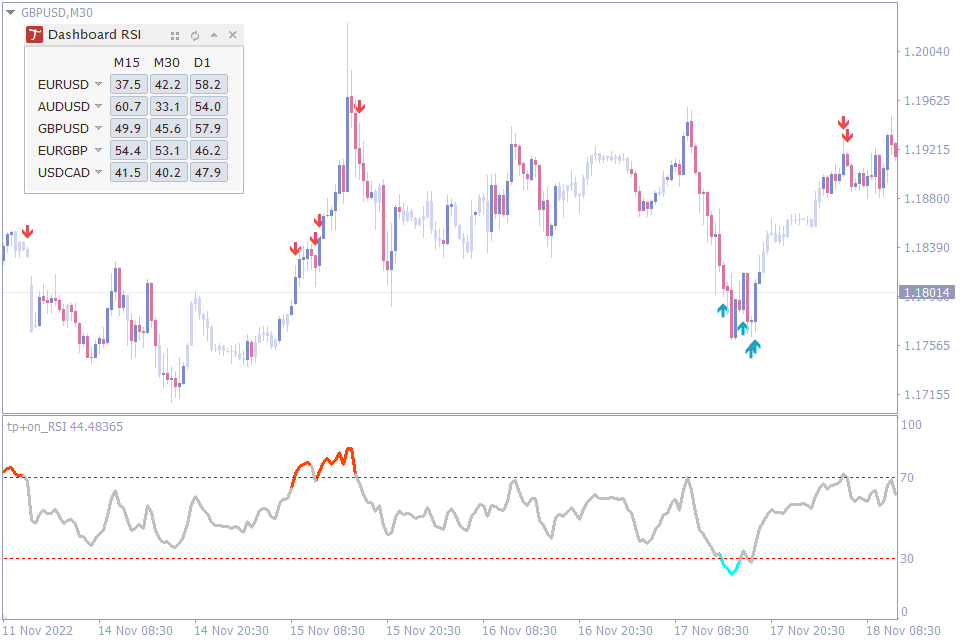
Let’s now discuss the final indicator in the list of best momentum indicators. The Tipu RSI indicator for MT4 is an RSI indicator with oversold and overbought alerts, buy and sell trading signals and multi time frame dashboard to monitor the RSI levels.
The classic RSI – Relative strength Index MetaTrader indicator is an excellent tool to understand and trade momentum. The major difference between the classic MT4 indicator and the Tipu RSI indicator is the color changes of the overbought and oversold conditions.
The oscillator line changes to blue during oversold conditions and provides a buy alert with arrow trading signals on the price chart. Similarly, at overbought conditions the color changes to Red with arrows on the chart. Additionally, the indicator alerts the trader onscreen, mobile and email.
Another essential feature is the Tipu dashboard; the dashboard displays multiple currencies of the trader’s choice. Additionally, the RSI values of each of the currency pair for three time frames are plotted on the dashboard. As a result, traders can understand the RSI values of all the time frames at a glance to gauge the market condition across three time frames.
The Bottom Line
Momentum is an excellent method to identify best trading conditions and to formulate trading strategies accordingly. The above indicators mentioned in this list are handpicked based on the value they add to the momentum trading.


Leave a Reply