

The Best Volatility Indicators For MT4
Volatility indicators are like traffic lights. Traffic lights tell you when to stop or go, as do volatility indicators. And only the best volatility indicators can keep your account safe.
You can reduce the number of crashes and burns your forex account sees with typical volatility indicators because they help you keep out of dangerous or dead market conditions. But the best volatility indicators do a little more.
The top volatility indicators predict market volatility better than the typical volatility indicators, and they also have nuances that set them apart from others.
We dedicate this article to showing you the best volatility indicators for MT4.
Table of Content
- Bollinger Bands Indicator
- Keltner Channel Indicator
- Donchian Channel Indicator
- Daily ATR Indicator
- Volatility Quality Zero Line Indicator
- Volatility Ratio Indicator
- Volatility Pivot Indicator
- Range Indicator
- Taotra Indicator
- Volatility Indicator
1. Bollinger Bands Indicator
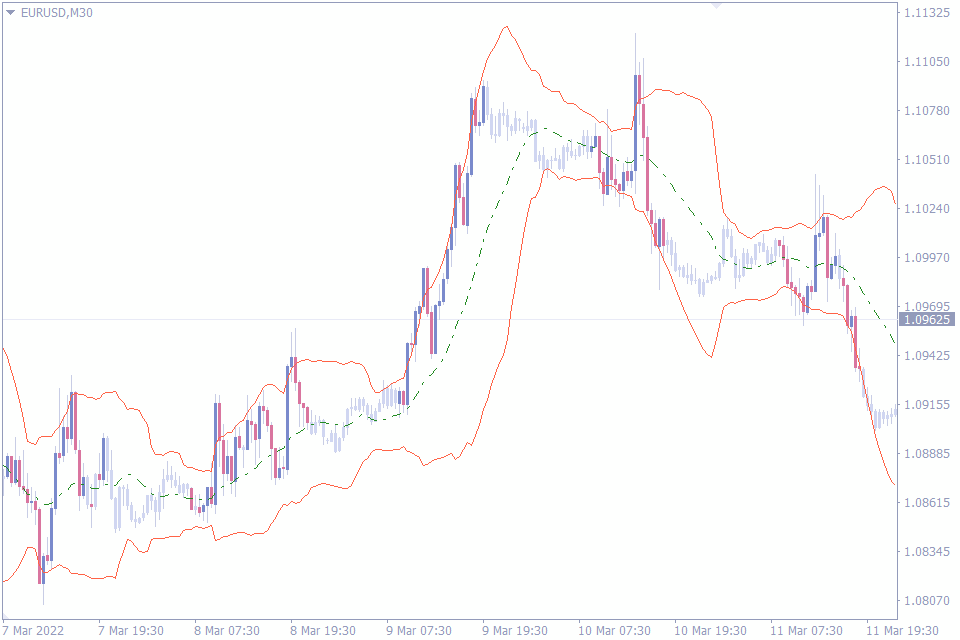
When many forex traders hear the Bollinger Bands indicator, volatility trading is probably not the first thing that comes to mind. But volatility trading is one of the multiple uses where the Bollinger Bands indicator excels.
The bands in the Bollinger Bands indicator refer to the two lines on either side of a 20 period moving average. They’re calculated using standard deviations of the price in a predetermined time.
These bands contract and expand, depending on the data they get from the market. And it is these bands that tell how volatile the market is. The basic idea is that the bands widen with increased volatility and contract in low volatility market conditions.
Perhaps, what makes the Bollinger band indicator one of the best for forex traders is how quickly it responds to and represents the market volatility at any given time and on any timeframe.
This information can be an immense guide to your trading, as it helps you know when there’s enough volatility in the market to back your trade up.
Apart from the volatility information on the currency pair, the Bollinger Bands is a good trend indicator that also passes for a reversal indicator for some forex traders. And it is these numerous uses of the indicator that make us consider it as one of the best volatility indicators for MT4.
2. Keltner Channel Indicator
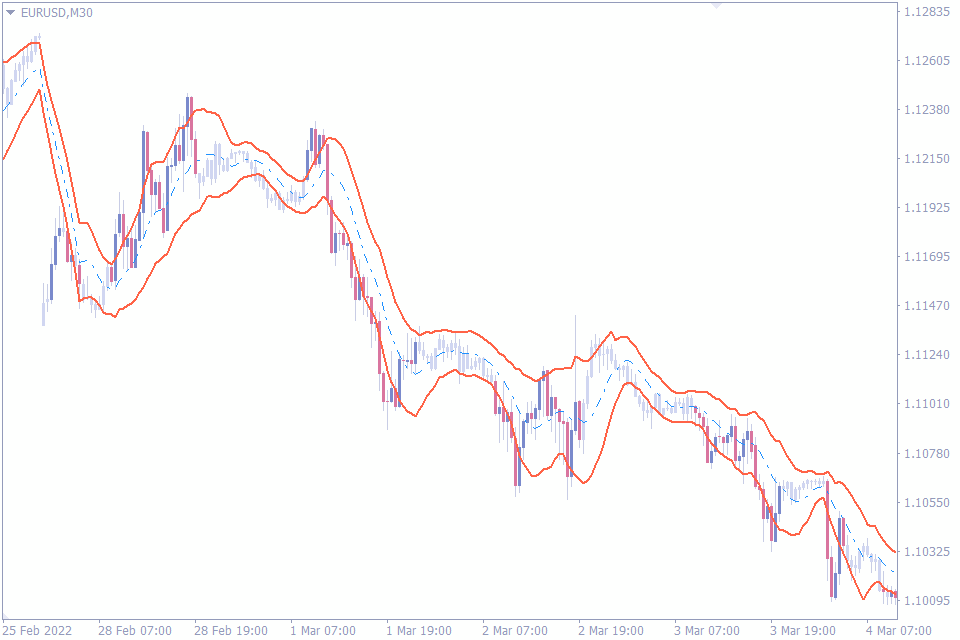
If you confuse the Keltner Channel for the Bollinger Bands, you could be forgiven. They both look alike and belong to the same category of indicators. What is different, however, is how each indicator calculates its values.
The Keltner Channel factors the Average True Range (ATR) into its calculation. For more context, the ATR is one of the most referred to indicators for when forex traders want to measure the average volatility of the price in a predetermined period.
So, when we say the Keltner Channel is a volatility-centered indicator that has bands surrounding the price, we mean it has a reliable volatility indicator at its center.
While the most common use of the indicator is trend trading, the Keltner Channel indicator is still a good volatility indicator. Depending on how much volatility the market has, the bands can expand and contract. And that, for us, is one reason we fixed it on this list.
These expansions and contractions are not as volatile as those of the Bollinger Bands. This limited volatility is the potential disadvantage of the Keltner Channel Indicator. And because the bands are more reluctant to expand and contract, the price often appears to be trampling right on them. Novice traders may find this confusing.
Beyond that, however, the Keltner Channel indicator is a great trend indicator and a good volatility indicator.
3. Donchian Channel Indicator
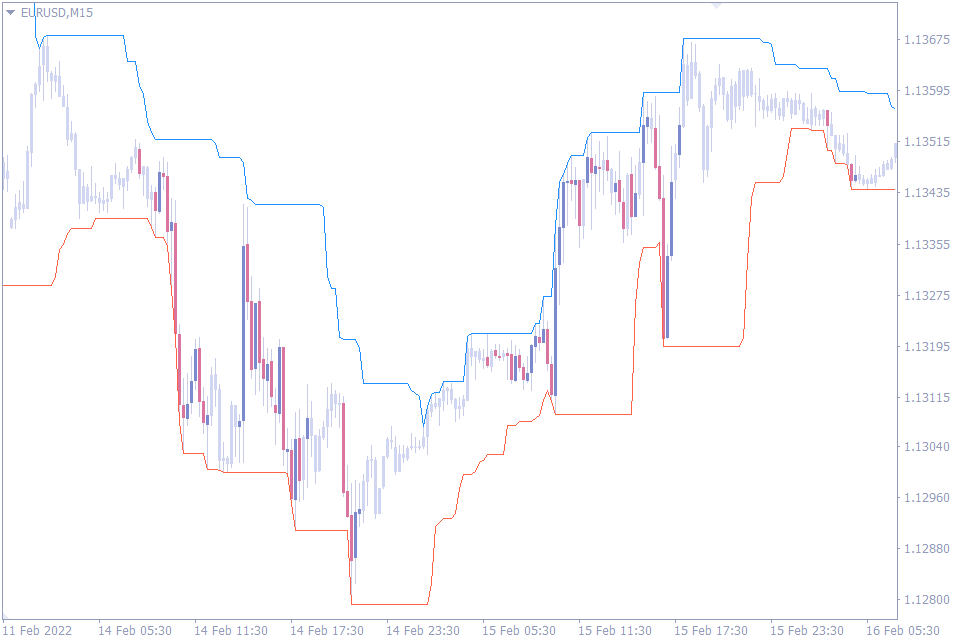
Another channel indicator makes it to this list of the best volatility indicators for forex traders; the Donchian Channel Indicator. Richard Donchian, whose nickname was “the father of trend following,” developed this indicator.
The Donchian Channel indicator is like the other two channel indicators in looks, but they all differ in how their values are calculated. The Bollinger Bands use standard deviation calculations to derive values for the band. Keltner channel uses ATR. Donchian Channel, on the other hand, makes use of the recent highs and lows of the currency pair.
This calculation method gives the Donchian Channel indicator the closest relationship with the most recent price performance of the currency pair. This calculation method also helps traders who use it get a unique perspective on the market. That is why we believe Day traders and scalpers who rely more on the most recent price movements than the broader historical price movements would enjoy using this indicator.
However, there aren’t a lot of differences between the way the Donchian Channel Indicator is used and the way the other channel indicators are used. The bands of the indicator also expand and contract, depending on the market’s volatility. The slope of the indicator also shows the market trend.
4. Daily ATR Indicator
ATR stands for Average True Range. And as its name suggests, the indicator calculates the average price range in any given number of periods. The simplicity and objectivity of the ATR have convinced many forex traders to rely on it for their volatility updates.
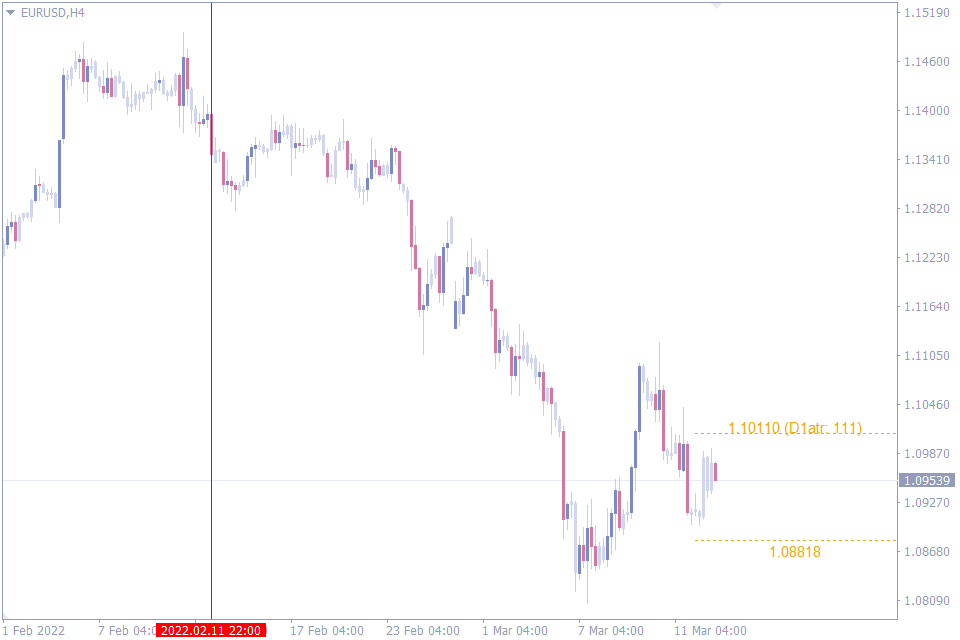
The Daily ATR indicator, however, differs slightly from the original ATR. The Original ATR calculates currency pair volatility using values from its timeframe. For instance, an ATR indicator with a period of 10 calculates the average volatility over the past ten days on a daily chart. Likewise, it calculates average volatility over the past ten weeks on a weekly chart.
What the Daily ATR indicator does, instead, is that it calculates for the daily timeframe and makes use of this info across all timeframes. But how is this helpful?
The Daily ATR plots two lines on timeframes lower than the daily timeframe. The upper line is the highest ATR for the day, while the lower line is the lowest ATR for the day.
If the price remains within these two lines throughout the trading day, it means the volatility of that day has not surpassed the daily volatility of the currency pair. You could assume that nothing exciting is happening on the stock.
On the other hand, the price growing out of the lines would mean more volatility in the market than estimated. You look for buy trades if the break is from the upper line and sell trades when the break is from the lower line.
Perhaps, the best thing about the Daily ATR indicator is that it can be an excellent tool in the hands of day traders. Day traders know that they have to conclude all their trades within a trading day. And with this indicator, they can ultimately get out of dead markets and pay more attention to currency pairs with more volatility.
5. Volatility Quality Zero Line Indicator
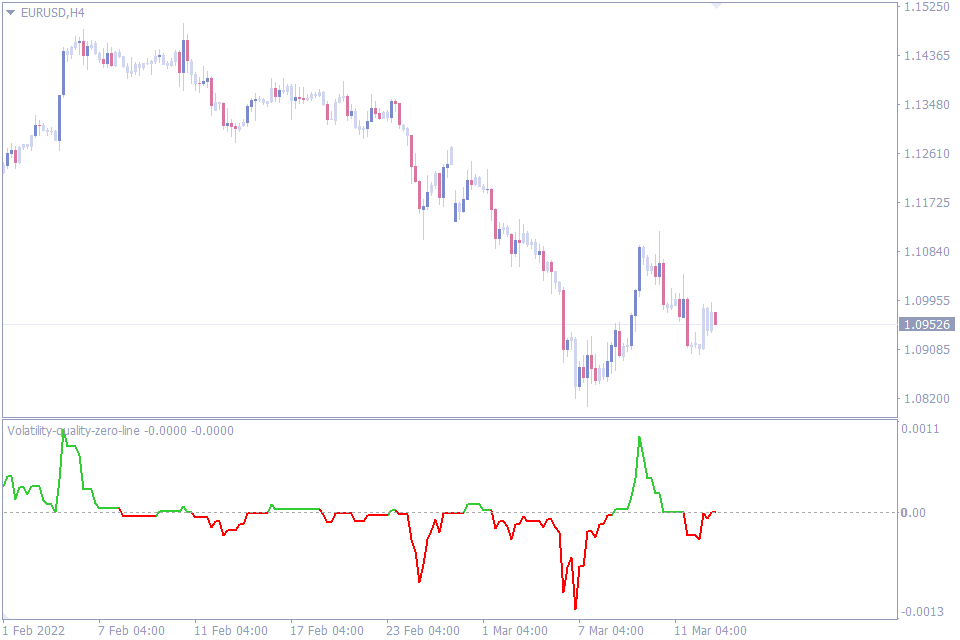
The Volatility Quality Zero Line indicator is a bi-functional indicator that tells volatility while also telling trends.
It appears on the indicator window as a line that occasionally spikes above or below a middle line. This spiking turns green during an uptrend or red during a downtrend. And the distance of this same line from the center line shows how volatile the currency pair is. The farther away the line is, the more volatile the market is.
The Volatility Quality Zero Line indicator has its source in the Volatility Quality indicator. But the Quality Zero Line variation differs from the source indicator in how sensitive it is. The former is not as sensitive as the latter.
We believe this gives conservative traders an edge. It means the Volatility Quality Zero Line is more stringent with its volatility signals, hence a reduction in false alerts. And this is one reason we have the Volatility Quality Zero Line Indicator on our list of the best volatility indicators for the Metatrader 4.
The Volatility Quality Zero Line indicator is best for swing trading but not so much for scalpers or intraday traders. The reason is that the indicator, in its default setting, is not the fastest trend trading or volatility indicator around. However, scalpers and intraday traders may bypass this lag by tweaking the indicator’s settings until they find something that works for them.
6. Volatility Ratio Indicator
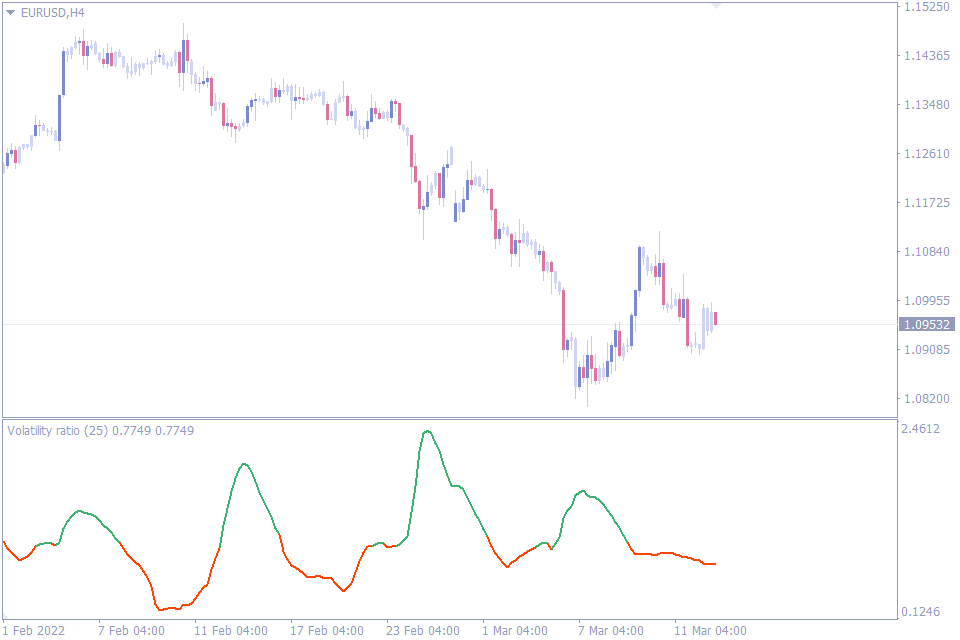
The Volatility Ratio indicator is dependable for forex traders who need something unsophisticated and straightforward to tell volatility.
The indicator appears on the MT4 as a continuous wavy line. When the line is green, there is high market volatility. And when the line is orange, there’s low volatility. That’s it. Nothing overly complicated.
But this simplicity is perhaps the best thing about this indicator. A trader, for instance, could tell a false breakout from a true breakout just by simply checking the color of the Volatility Ratio indicator. Another trader can also use this indicator to know when to get into trades or stay out of them.
The Volatility Ratio indicator is suitable for all forex traders. Novice traders, for instance, would like that it makes it easy to visualize when to trade and when to steer clear of the market. On the other hand, expert forex traders would appreciate an indicator that makes analysis fast.
7. Volatility Pivot Indicator
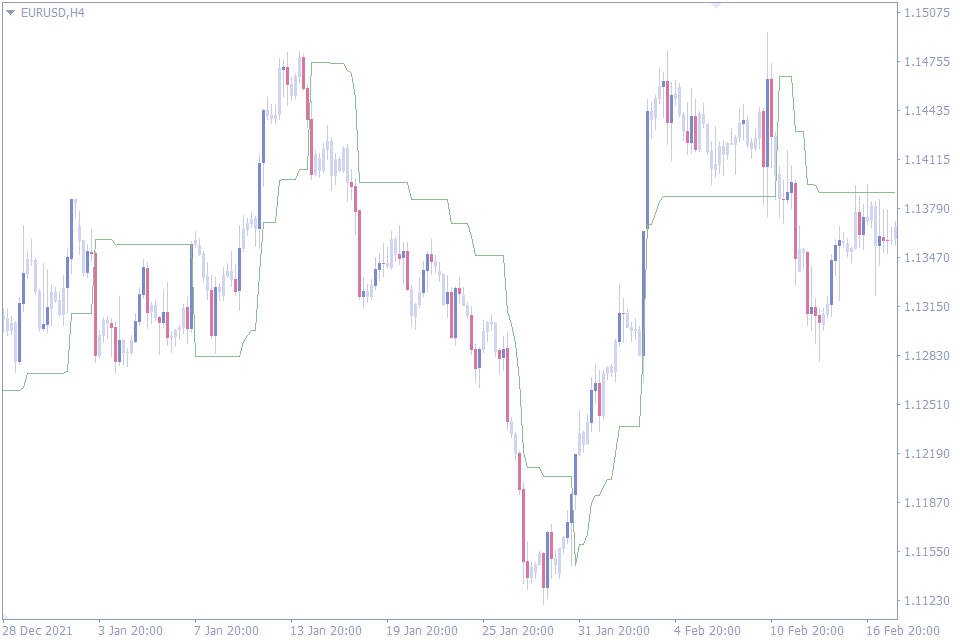
Another helpful indicator on our list is the Volatility Pivot Indicator. It looks like a moving average on the chart, but it differs significantly from any moving average. The Volatility Pivot indicator uses the ATR in its calculation, thus exposing the indicator to recent price volatility.
The Volatility Pivot indicator is strange. The developer intended it for volatility trading, but it is best used for trend trading. It creates dynamic support and resistance zones around the price. Any break from this level results in a new trend.
For instance, if the price breaches the Volatility Pivot indicator to the downside, that’s a signal for a downtrend. And if the breakout occurs to the upside, the indicator suggests the pair is going bullish.
The best way to use the Volatility Pivot indicator is to combine it with other trend trading signals. This would help you confirm the trends being suggested by the Volatility Pivot indicator and help limit the losses.
Forex traders of all skill levels would find the Volatility Pivot indicator very useful. It works on all timeframes, allowing traders of various trading types to add it to their trading strategies.
8. Range Indicator
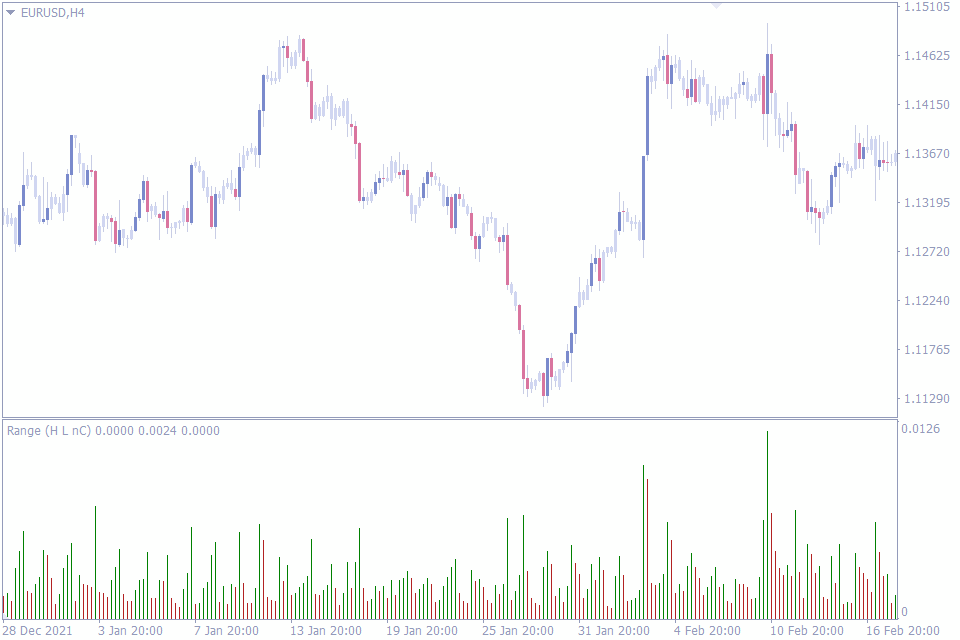
The Range indicator is another impressive volatility indicator. It uses green and red bars to display the strength of volatility. The green bars denote rising volatility, and the red bars represent falling volatility.
Although you can use the indicator in various ways depending on the trader, there’s one standout way to use this indicator:
Note when rising volatility bars accumulate. A minimum of two consecutive green bars denote this. Many times, when growing volatility bars gather, huge volatility follows.
This can be useful in helping traders catch big moves before they happen. And because of its nature, the indicator is helpful for all timeframes, and forex traders of all kinds will find it a helpful tool.
However, it is essential to note that this indicator is not a trend indicator. It merely tells the volatility of the pair. So, don’t take consecutive green bars to mean there would be an uptrend or red bars to mean there’ll be a downtrend. You are going to need other price action tools to determine those.
9. Taotra Indicator
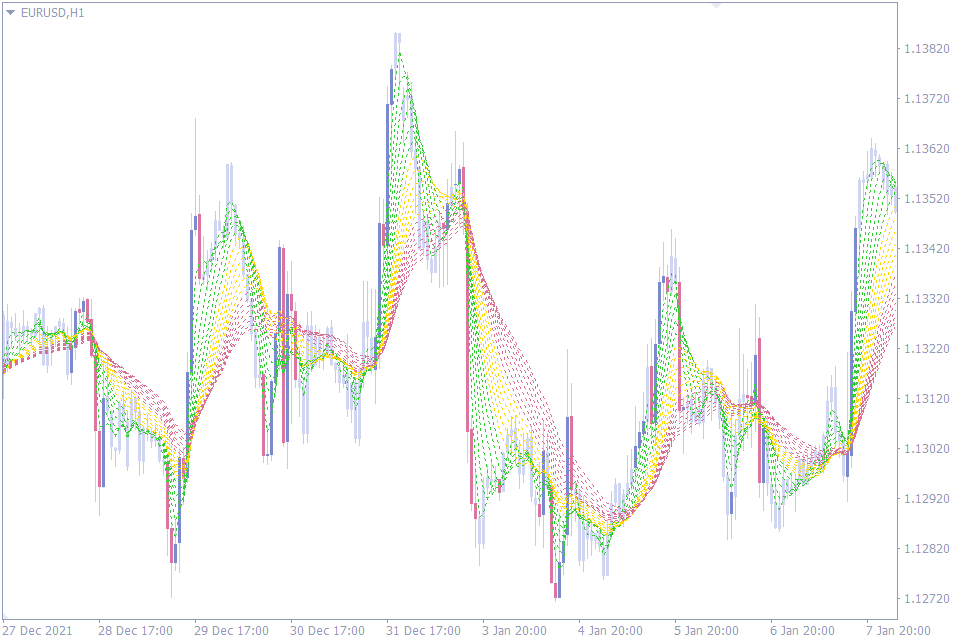
The Taotra Indicator is a set of 20 linear weighted moving averages divided into three colors: red, green, and yellow. The market is bullish when the green-colored moving averages are above the others. And when the red moving averages are above, the market is bearish.
There’s no doubt the Taotra indicator is a trend trading indicator. But what then is this trend indicator doing among the ranks of the best volatility indicators? The answer to this question made us consider the Taotra indicator one of the best volatility indicators.
The lines of the Taotra indicator contract and expand in response to volatility. The moving averages are more spaced out when the market is very volatile. But when there isn’t enough market volatility, the moving averages look squeezed.
This volatility-response effect lets trend traders know how best to time their trades. For instance, a squeeze of the moving averages, which represents low volatility, will not last forever. So, during a contraction, a trader may use other price action tools to await the spacing out of the moving averages, which signifies that volatility has returned to the market. And when the moving averages expand, massive price movements happen.
That use, though simple, can help traders get in trades at the right time and avoid unnecessary losses.
10. Volatility Indicator
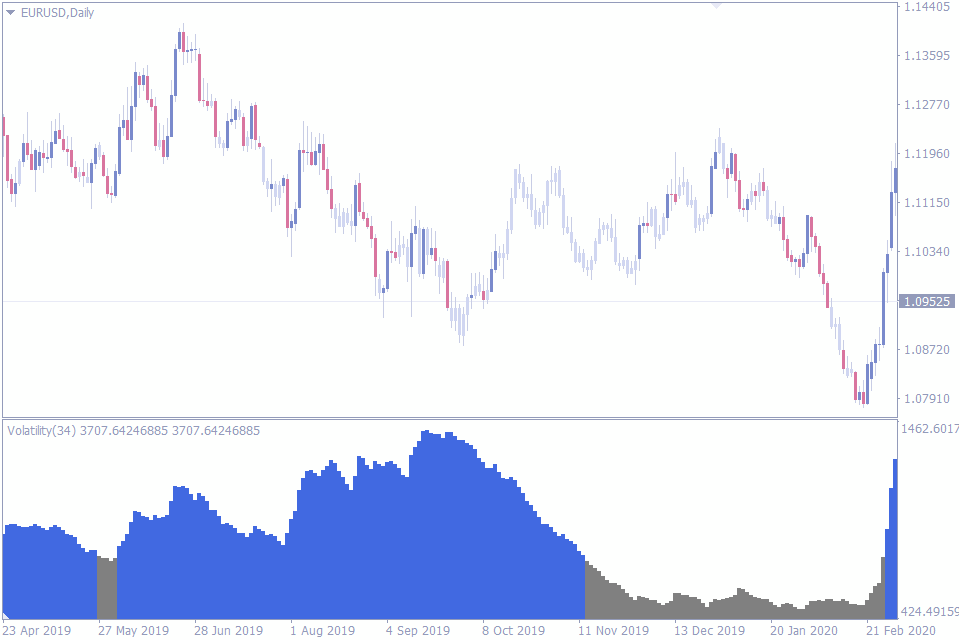
Honestly, there couldn’t have been a better name for this indicator. Why? Because the indicator simply shows you the market volatility without wasting time. That is one reason we have the indicator on our list of the best volatility indicators for MT4.
The Volatility Indicator has bars of gray and blue. The blue bars mean market volatility is rising, and the gray bars mean volatility is dropping. And the height of the bars determines how much volatility is going on in the market.
That is all there is about the indicator. Its sophistication is in its simplicity. However, there’s another use of the Volatility indicator that isn’t so common:
You can use the Volatility indicator to predict the end of a significant trend. Gray bars that signify falling volatility often appear on the chart during dead markets or when there isn’t much momentum to carry on a trend.
For that reason, many forex traders, including swing and day traders, depend on the Volatility indicator to know the best time to get out of trends. This same feature is another reason we believe the Volatility indicator is one of the best volatility indicators for the MT4.
Conclusion
There you have it. Our list of the ten best volatility indicators for forex traders using the MT4 trading platform.
Of course, we couldn’t pretend there aren’t many other significant volume indicators out there. But we’ve found these to be consistently reliable in representing the market volatility and helping forex traders make the best of their trades.


Comments (7)
yWOyjM Thanks so much for the blog post.Thanks Again. Awesome.
Very good blog article.Thanks Again. Great.
This piece of writing is genuinely a pleasant one it helps new internet viewers,who are wishing in favor of blogging.
Major thankies for the article post. Great.
I cannot thank you enough for the article post.Really thank you! Much obliged.
Thanks a lot for the blog article. Really Great.
I truly appreciate this blog post.Much thanks again. keep writing.