

List of the Best Indicator for Sideways Market
Trading in the Forex market isn’t confined to trend identification alone, it also involves profiting from phases of consolidation and horizontal price movements. Explore the leading indicators tailored for excelling in range-bound markets characterized by sideways price action, and equip yourself with a comprehensive trading strategy. Whether you’re a beginner aiming to bolster your trading capabilities or a seasoned trader in search of powerful tools, this comprehensive guide is your gateway to the most effective indicators for navigating sideways markets. It provides valuable insights, proven strategies, and the expertise required for a successful trading journey.
A sideways market, also known as a range-bound or consolidating market, is characterized by price movements within a relatively narrow range, lacking a clear upward or downward trend. Traders often encounter sideways markets during periods of indecision or equilibrium in the financial markets, presenting unique challenges and opportunities for those looking to profit from price oscillations within a specific range.
Table of Content
- Bollinger Bands Indicator
- RSI Extreme Zone Indicator
- FXSSI.ProfitRatio
- Moving Average (MA) Crossover Alerts Indicator
- Full Stochastic Indicator
- ATR Stop Indicator
- Commodity Channel Index (CCI) Indicator
- Supply and Demand Zones Indicator
- Auto Support and Resistance Zones Indicator
- Engulfing Indicator
Explore the best tools for trading in sideways markets and master the art of capitalizing on price ranges.
#1. Bollinger Bands Indicator
Number of Downloads: 2.0k
Score: 5
Timeframes: Effective on all timeframes, especially H1 and H4
Currency Pairs: Applicable to all major and minor currency pairs
Alerts: No
Buy and Sell Strategy
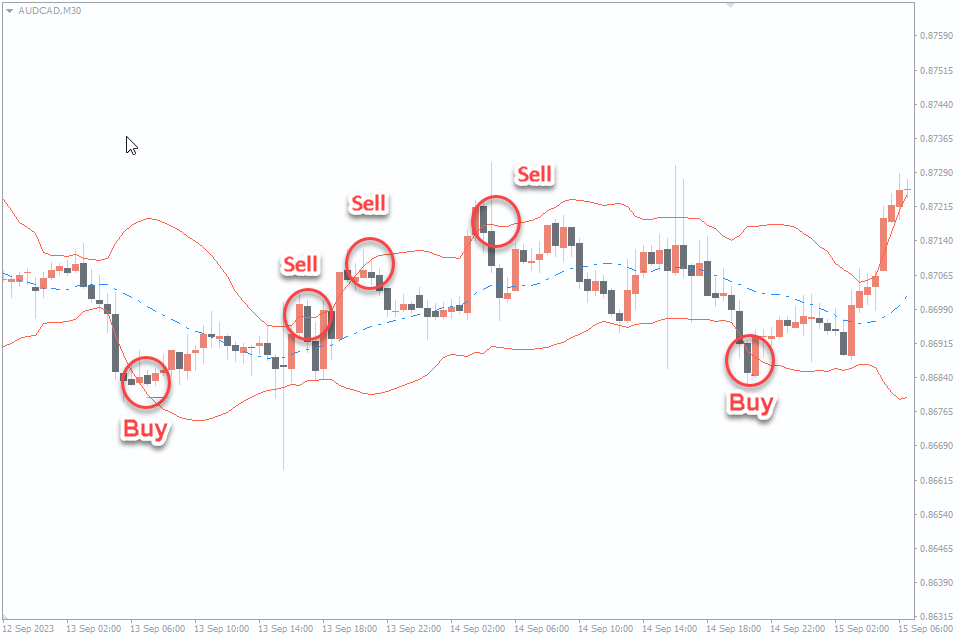
Identify a Sideways Market: Confirm a sideways market where Bollinger Bands are parallel, indicating a lack of a strong trend.
Entry Point for Buy: When the price approaches the lower Bollinger Band, it’s a potential buy opportunity. Confirm with a bullish candlestick pattern.
Entry Point for Sell: The selling strategy is absolutely mirror and opposite to the buying strategy.
Stop-Loss: Place your stop-loss just above (for sell) or below (for buy) the entry candlestick pattern or the opposite Bollinger Band.
Take-Profit: Aim for a risk-reward ratio of at least 1:2. Set the initial take-profit level near the opposite Bollinger Band or significant support/resistance.
Close the trade when it reaches your predefined take-profit level or consider using a trailing stop to lock in profits.
This Bollinger Bands strategy is optimized for sideways markets, providing clear entry and exit points with a focus on risk management. It is free to download and use.
#2. RSI Extreme Zone Indicator
Number of Downloads: 1.1k
Score: 5
Timeframes: Effective on all timeframes
Currency Pairs: Applicable to all major and minor currency pairs
Alerts: Yes
Buy and Sell Strategy
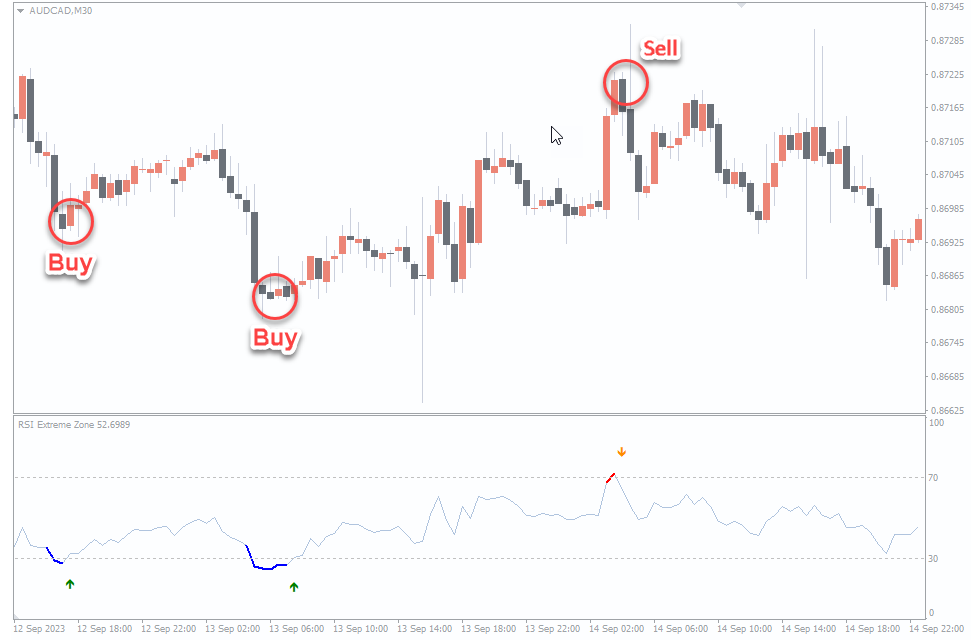
Identify a Sideways Market: Look for a market displaying sideways movement, characterized by price ranging without a clear trend. This is crucial for this strategy.
Entry Point for Buy: When the RSI crosses above the oversold level (30), it suggests a potential upward reversal. Confirm the signal with a bullish candlestick pattern or other supporting indicators.
Entry Point for Sell: When the RSI crosses below the overbought level (70), it suggests a potential downward reversal. Confirm the signal with a bearish candlestick pattern or other supporting indicators.
Stop-Loss: Place your stop-loss just below (for buy) or above (for sell) the entry candlestick pattern or the nearest support/resistance level.
Take-Profit: Aim for a risk-reward ratio of at least 1:2. Set the initial take-profit level at the opposite end of the sideways range or a significant support/resistance level.
Close the trade when it reaches your predefined take-profit level. As the trade moves in your favor, consider trailing stop.
This RSI Extreme Zone strategy is designed to capitalize on reversals within sideways markets, offering clear entry and exit signals while focusing on risk management. Customize it to your trading preferences and risk tolerance. There’s no cost attached to utilizing this feature.
#3. FXSSI.ProfitRatio
Number of Downloads: 14.8k
Score: 4.1
Timeframes: Effective on all timeframes
Currency Pairs: Applicable to all major and minor currency pairs
Alerts: Yes
Buy and Sell Strategy
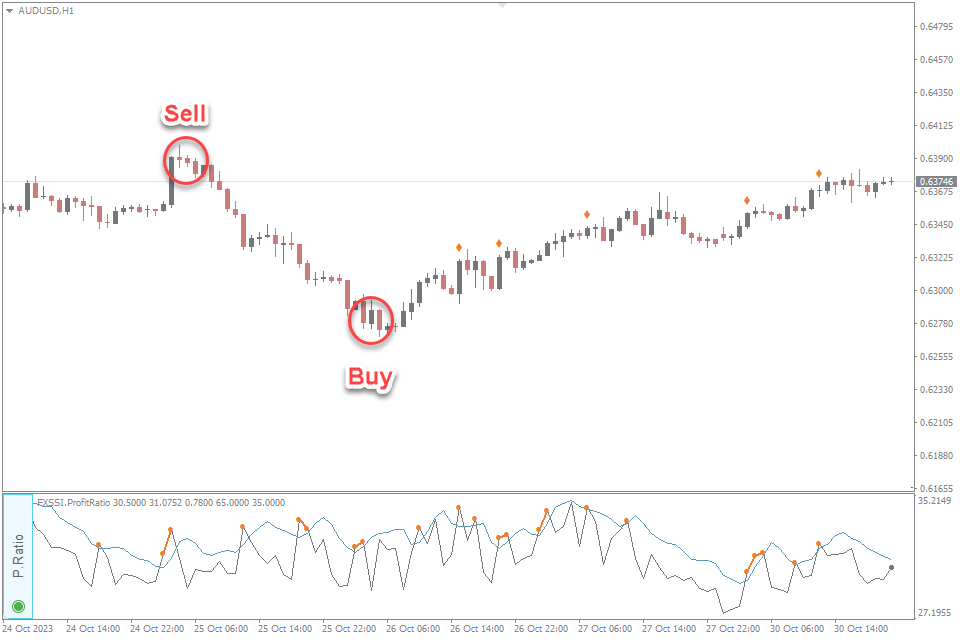
Identify a Sideways Market and use the FXSSI.ProfitRatio Indicator.
Entry Point for Buy: pay attention to the indicator signal about a possible reversal of the upward price movement, on the second or third signal, enter the market on a smaller timeframe or with additional confirmation using a bullish candlestick.
Entry Point for Sell: the Sell strategy is similar and opposite to the buying strategy and for confirmation use a bearish candlestick.
Stop-Loss: Place your stop-loss just below (for buy) or above (for sell) the entry candlestick pattern or the nearest support/resistance level.
Take-Profit: Aim for a risk-reward ratio of at least 1:2. Set the initial take-profit level at the opposite end of the sideways range.
Adjust your stop to lock in profits as the trade moves in your favor or close the trade when it reaches your predefined take-profit level.
The FXSSI.ProfitRatio strategy is designed to capitalize on reversals by providing clear signals of changing market conditions. Customize it to suit your trading preferences and use it with your risk tolerance. It can be used for a nominal fee.
#4. MA Crossover Alerts Indicator
Number of Downloads: 4.8k
Score: 4.8
Timeframes: Effective on all timeframes
Currency Pairs: Applicable to all major and minor currency pairs
Alerts: Yes
Buy and Sell Strategy
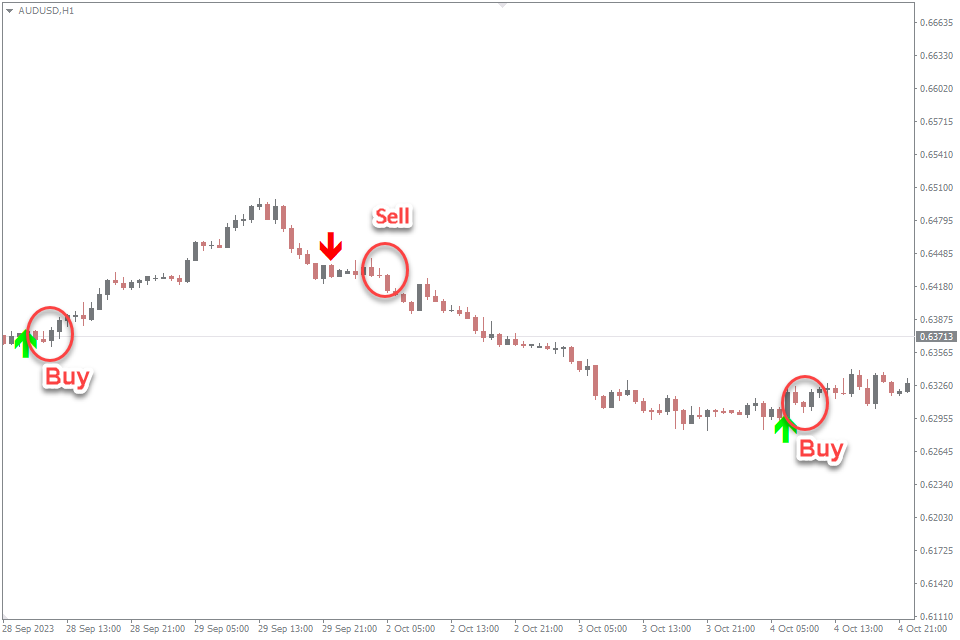
Use the Moving Averages. In a sideways market, the 10-period SMA and the 20-period EMA will be closely intertwined, with no clear upward or downward slope. This crossover indicates a lack of a strong trend.
Entry Point for Buy: When the 10-period SMA to cross above the 20-period EMA you will get a signal. This can signal the potential start of an uptrend within the sideways range. Confirm the buy signal with a bullish candlestick pattern or other supporting indicators.
Entry Point for Sell: The selling strategy is absolutely mirror and opposite to the buying strategy.
Stop-Loss: Place your stop-loss just below (for buy) or above (for sell) the entry candlestick pattern or the nearest support/resistance level.
Take-Profit: Aim for a risk-reward ratio of at least 1:2. Set the initial take-profit level at the opposite end of the sideways range or a significant support/resistance level. Also adjust your stop to lock in profits as the trade moves in your favor.
This Moving Average strategy is designed to capitalize on potential mini-trends within sideways markets, providing clear entry and exit signals while emphasizing risk management. You can download and use it for free.
#5. Full Stochastic Indicator
Number of Downloads: 1.0k
Score: 5
Timeframes: Effective on all timeframes
Currency Pairs: Applicable to all major and minor currency pairs
Alerts: No
Buy and Sell Strategy
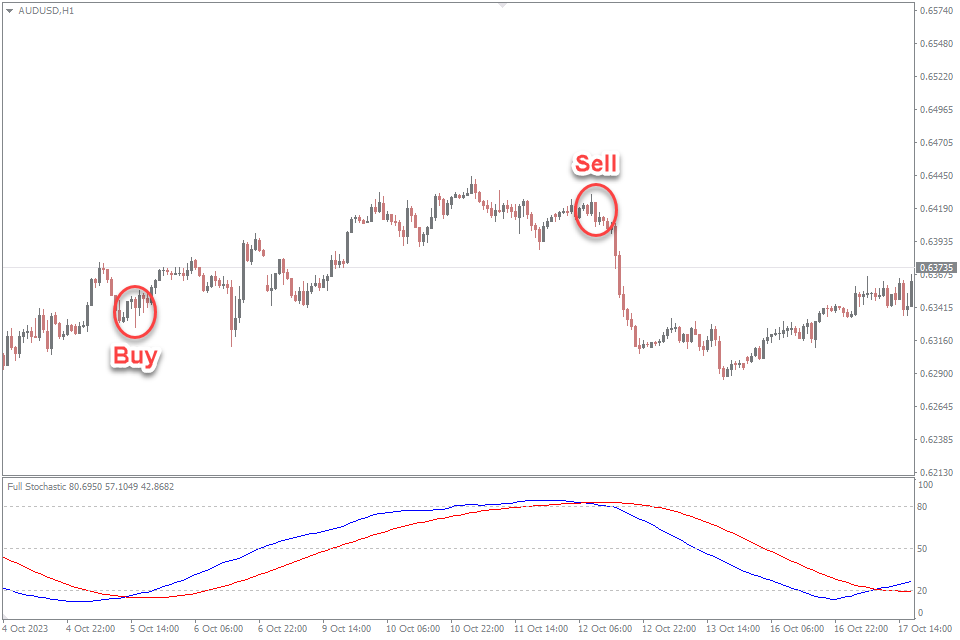
In a sideways market, the Stochastic lines (K and D) will move within a specific range, typically between 20 and 80, without a strong trend.
Entry Point for Buy: Look for the K line to cross above the D line when both lines are in the oversold region (below 20). This crossover suggests a potential uptrend within the sideways range. For additional confirmation, seek bullish candlestick patterns or complementing indicators.
Entry Point for Sell: Monitor the K line crossing below the D line when both lines are in the overbought region (above 80). This crossover indicates a potential downtrend within the sideways range. To reinforce the sell signal, examine bearish candlestick patterns or supportive indicators.
Stop-Loss: Apply a stop-loss just below (for buy) or above (for sell) the entry candlestick pattern or the nearest support/resistance level to manage risk effectively.
Take-Profit: Maintain a minimum risk-reward ratio of 1:2 or more. Initially, position the take-profit level at a significant support/resistance level or the opposite boundary of the sideways range.
Also consider adjusting the stop-loss to secure profits as the trade moves in your favor, locking in gains.
This strategy with Full Stochastic Indicator is tailored to capitalize on potential minor trends within sideways markets. It’s free to use and download.
#6. ATR Stop Indicator
Number of Downloads: 0.1k
Score: 5
Timeframes: Effective on all timeframes
Currency Pairs: Applicable to all major and minor currency pairs
Alerts: Yes
Buy and Sell Strategy
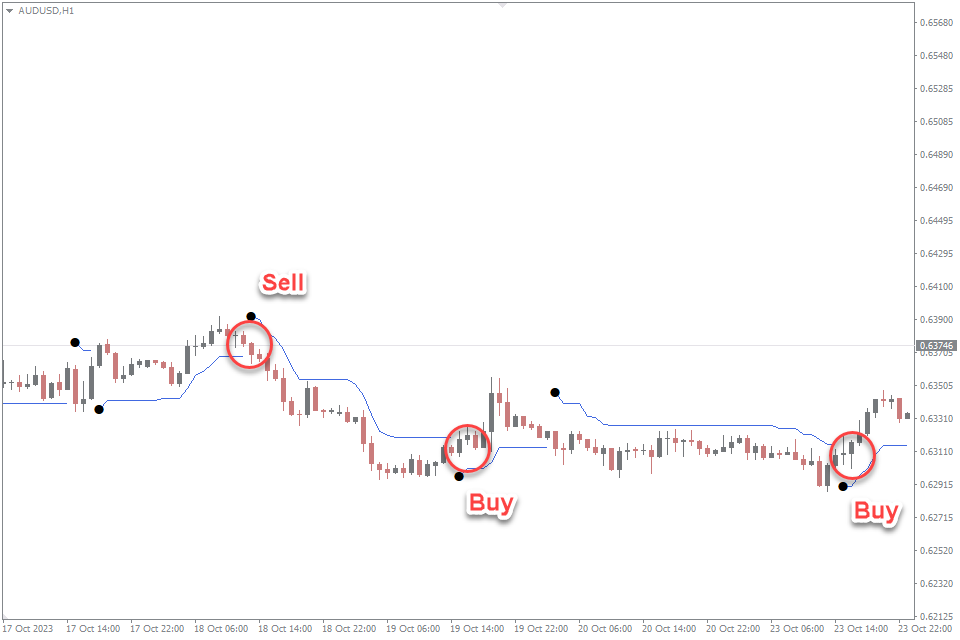
In a sideways market, the ATR (Average True Range) typically remains relatively low, indicating reduced volatility and a lack of a clear trend.
Entry Point for Buy: When the ATR Stop Indicator shows the signal that price is near the lower ATR band, consider it a potential buy signal. This suggests that price may have reached a support level within the sideways range. For added confirmation, watch for bullish candlestick patterns or complementing indicators.
Entry Point for Sell: Mirror and vice versa to the buy strategy.
Stop-Loss: Place a stop-loss just below (for buy) or above (for sell) the signal from Indicator or the nearest support/resistance level.
Take-Profit: Maintain a minimum risk-reward ratio of 1:2 or more. Initially, position the take-profit level at a significant support/resistance level or the opposite boundary of the sideways range. As the trade moves in your favor, consider trailing your stop to lock in profits.
This ATR Stop Indicator strategy is designed to exploit potential minor fluctuations within sideways markets. Adapt the strategy to align with your trading preferences and risk tolerance. Also there are no any payments for use.
#7. Commodity Channel Index (CCI) Indicator
Number of Downloads: 2.1k
Score: 4.5
Timeframes: Effective on all timeframes
Currency Pairs: Applicable to all major and minor currency pairs
Alerts: No
Buy and Sell Strategy
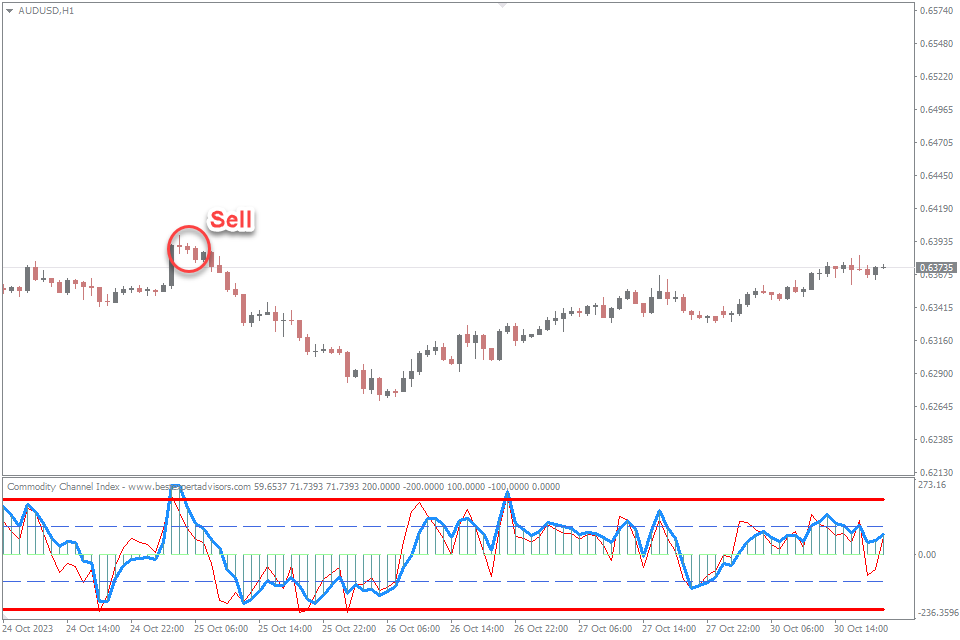
Implement the CCI (Commodity Channel Index) Indicator to recognize sideways market conditions. In a sideways market, the CCI typically oscillates around the zero line, signifying a lack of a strong trend.
Entry Point for Buy: When the TURBO CCI & DODGER BLUE crosses above -100, consider it a potential buy signal. This suggests that price may be moving away from an oversold condition within the sideways range. Seek additional confirmation from bullish candlestick patterns or complementary indicators.
Entry Point for Sell: When the TURBO CCI & DODGER BLUE crosses below +100, consider it a potential sell signal. This indicates that price may be diverging from an overbought condition within the sideways range. For extra assurance, watch for bearish candlestick patterns or supporting indicators.
Stop-Loss: Prudently position a stop-loss just below (for buy) or above (for sell) the entry candlestick pattern or the nearest support/resistance level to manage risk effectively.
Take-Profit: Maintain a minimum risk-reward ratio of 1:2 or greater. Initially, place the take-profit level at a significant support/resistance level or the opposite boundary of the sideways range.
As the trade progresses in your favor, consider utilizing a trailing stop to lock in profits.
This CCI Indicator strategy is structured to harness potential minor shifts within sideways markets, delivering precise entry and exit signals while emphasizing risk management. Download it for free.
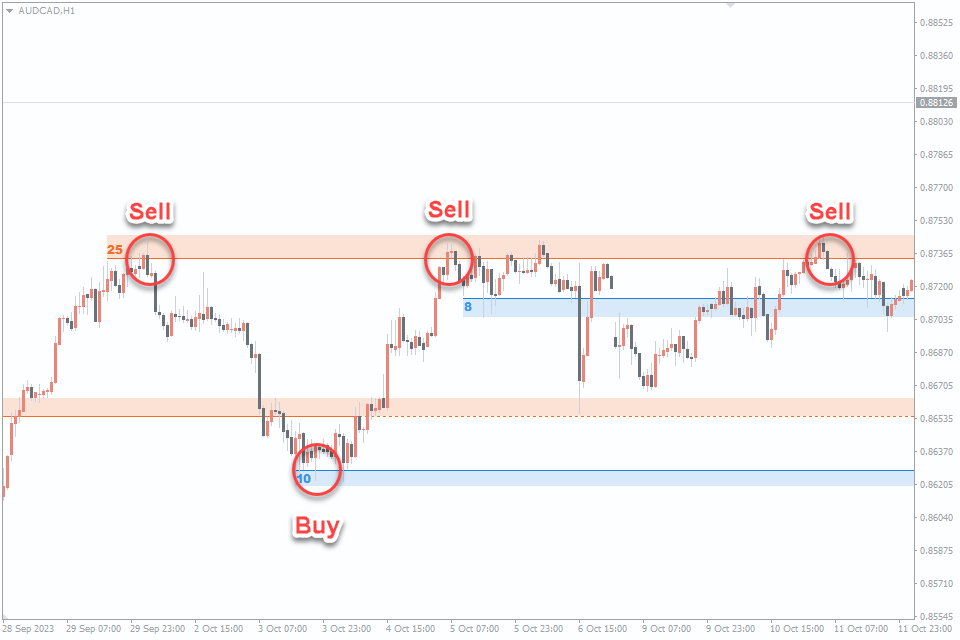
#8. Supply and Demand Zones Indicator
Number of Downloads: 32.6k
Score: 4.7
Timeframes: Effective on all timeframes
Currency Pairs: Applicable to all major and minor currency pairs
Alerts: No
Buy and Sell Strategy
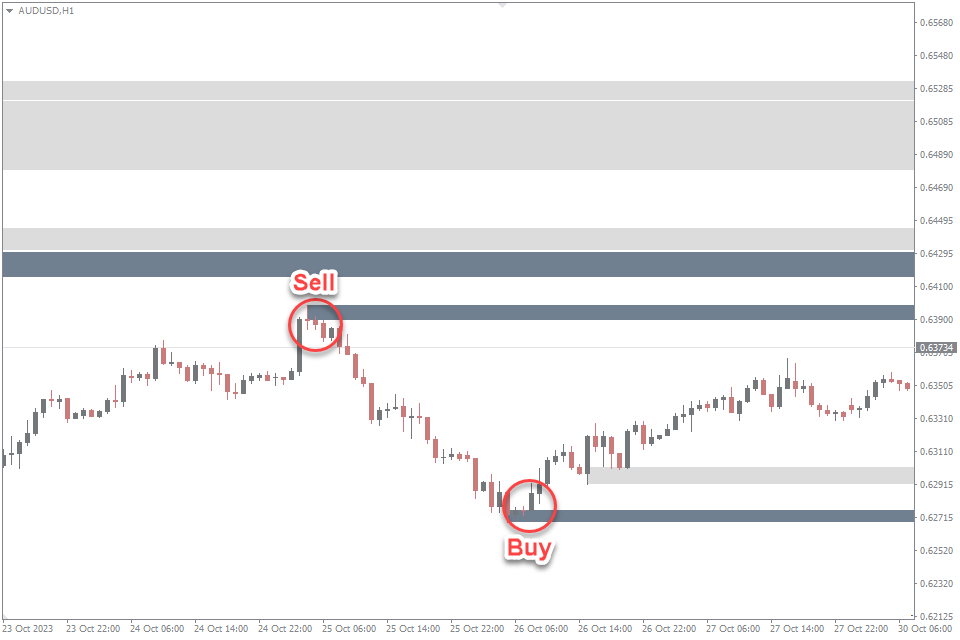
To pinpoint a sideways market, employ the Supply and Demand Zones Indicator. In such markets, price typically moves within well-defined supply and demand levels, showing no clear trend.
Entry Point for Buy: Look for price to approach a demand zone. When price reaches a demand zone and shows signs of bouncing higher, consider it a potential buy signal. Confirm this with bullish candlestick patterns.
Entry Point for Sell: The selling strategy is absolutely mirror and opposite to the buying strategy.
Stop-Loss: Place an appropriate stop-loss just below (for buy) or above (for sell) the entry candlestick pattern or above supply zone and lower above demand zone.
Take-Profit: Maintain a minimum risk-reward ratio of 1:2 or higher. Initially, set the take-profit level at the opposite boundary of the supply or demand zone. As the trade advances in your favor, consider implementing a trailing stop to secure profits.
This strategy involving the Supply and Demand Zones Indicator is designed to harness price movements within sideways markets, offering precise entry and exit signals. It comes at no charge, making it available to anyone.
#9. Auto Support and Resistance Zones Indicator
Number of Downloads: 19.6k
Score: 4.9
Timeframes: Effective on all timeframes
Currency Pairs: Applicable to all major and minor currency pairs
Alerts: No
Buy and Sell Strategy
For identifying a sideways market, utilize the Auto Support & Resistance Zones Indicator. In these market conditions, prices often move within well-established support and resistance zones, without displaying a clear trend.
Entry Point for Buy: Observe the price as it approaches a well-defined support zone. When the price touches the support zone and exhibits signs of a potential upward reversal, consider it a buy signal.
Entry Point for Sell: The Sell strategy is similar and opposite to the buying strategy.
Stop-Loss: Implement an appropriate stop-loss order above ressitance zone or below the support zone and also just below (for buy) or above (for sell) the entry candlestick pattern.
Take-Profit: Maintain a minimum risk-reward ratio of 1:2 or higher. Initially, set the take-profit level at the opposite boundary of the support or resistance zone. Also decide on the optimal trailing stop placement when the trade progresses in your favor.
This strategy, is designed to capitalize on price movements within sideways markets. It provides well-defined entry and exit signals. Customize this strategy to match your specific trading preferences and risk acceptance. And use it for free.
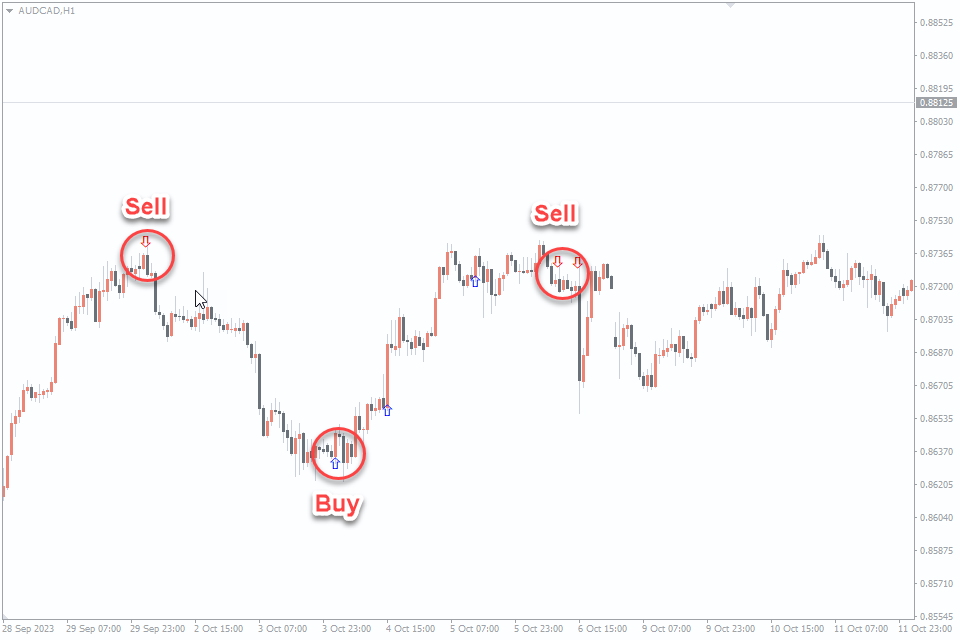
#10. Engulfing Indicator
Number of Downloads: 8.4k
Score: 4.6
Timeframes: Effective on all timeframes
Currency Pairs: Applicable to all major and minor currency pairs
Alerts: Yes
Buy and Sell Strategy
To recognize a sideways market, employ the Engulfing Indicator. In these market conditions, prices often oscillate within a confined range, making it essential to spot clear reversal signals.
Entry Point for Buy: Keep an eye on the price as it approaches the lower boundary of the range. When the price touches this level and the Engulfing Indicator forms a bullish signal, consider it a buy signal. For additional confirmation, search for supportive bullish candlestick patterns.
Entry Point for Sell: The Sell strategy is same and opposite to the buying strategy.
Stop-Loss: Prudently place a stop-loss order just below (for buy) or above (for sell) the entry candlestick pattern or the nearest support/resistance level. This safeguards your capital and manages risk effectively.
Take-Profit: Maintain a minimum risk-reward ratio of 1:2 or more. Initially, position the take-profit level at the opposite boundary of the sideways range or a significant support/resistance level. Use a trailing stop to protect and maximize your profits.
This strategy, incorporating the Engulfing Indicator offers clear and reliable entry and exit signals at sideway forex market. Adapt this strategy to align with your specific trading preferences and risk.
Conclusion
In conclusion, navigating a sideways market demands a strategic approach to capitalize on price oscillations within a confined range. Whether you prefer the stability of moving averages, the momentum signals of the RSI, or the pattern recognition capabilities of engulfing indicators, there are tools available to help you make informed trading decisions.
The key takeaway from this exploration of various indicators is the need for adaptability. No single indicator fits all market scenarios, and traders should employ the one that aligns best with the specific characteristics of the market they are dealing with. Additionally, risk management remains paramount, with carefully placed stop-loss and take-profit orders ensuring that any sideways market scenario can still yield profitable results. The right combination of technical indicators can be a trader’s best ally in such market conditions. For example, for optimal calculation of stop loss and exit strategy, you can use FXSSI.StopLossClusters or others similar.
It is the judicious use of indicators within a well-thought-out trading strategy that will assist traders in making the most of the diverse market conditions.
So, as you venture into the world of forex trading, equip yourself with a repertoire of indicators, a sound strategy, and an unwavering commitment to prudent risk management. With these tools at your disposal, even the most meandering of sideways markets can become a source of opportunity and potential profit.


Comments (2)
Nice one..
Goood!!