

7 Best Indicators for Crypto Trading
In the dynamic realm of cryptocurrency trading, success hinges not only on market insight but also on the utilization of effective tools to navigate its inherent volatility. Among these tools, trading indicators emerge as indispensable aids, providing crucial signals and insights for traders of all levels. This comprehensive guide explores the top trading indicators, offering valuable insights to both newcomers and seasoned traders alike.
Trading indicators are mathematical calculations represented as lines on price charts, serving as invaluable tools for interpreting market signals and trends. In the fast-paced world of cryptocurrency trading, these indicators play a pivotal role in crafting successful trading strategies. Unlike traditional markets, cryptocurrency markets operate 24/7, presenting unique challenges and opportunities that demand a strategic and adaptable approach.
Table of Content
- RSI Extreme Zone Indicator
- MACD Alert Indicator
- Trend Finder Indicator
- Advanced Bollinger Bands Indicator
- Fibonacci Retracement Indicator
- EMA Indicator
- Volume MA Indicator
There are freely available for download and application on the MT4/Mt5 platforms, proves to be a prudent choice for navigating the cryptocurrency market. Renowned for its simplicity and user-friendly interface, these indicators offers a seamless setup process and facilitates convenient usage, ensuring a hassle-free trading experience.
#1 RSI Extreme Zone Indicator – Gauging Market Momentum
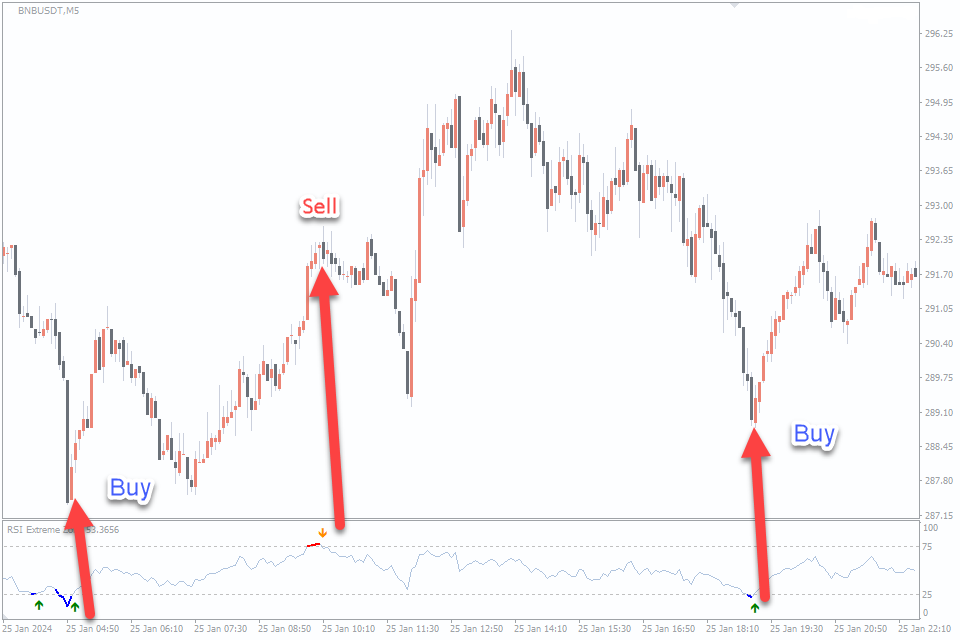
The Relative Strength Index (RSI) is a momentum oscillator that measures the speed and change of price movements. Developed by J. Welles Wilder Jr., the RSI is widely used by traders to gauge overbought and oversold conditions in the market. The RSI oscillates between 0 and 100, with readings above 70 signaling overbought conditions and readings below 30 indicating oversold conditions.
Utilization in Crypto Trading
Within the rapid realm of cryptocurrency trading, the Relative Strength Index (RSI) functions as an invaluable asset for pinpointing potential trend reversals and validating ongoing trends. By scrutinizing price momentum, the RSI empowers traders to anticipate alterations in market sentiment and make well-informed choices regarding entry and exit positions. My preference for crypto market settings is 75/25, deviating from the conventional 70/30.
Strategies for Using the RSI
Overbought and Oversold Conditions: Traders can use the RSI to identify overbought and oversold conditions in the crypto market. When the RSI crosses above 75, it suggests that the asset may be overbought and due for a potential pullback. Conversely, when the RSI falls below 25, it indicates oversold conditions and a potential buying opportunity.
Divergence Analysis: Divergence occurs when the price of an asset moves in the opposite direction of the RSI. Bullish divergence occurs when the price makes lower lows, but the RSI forms higher lows, signaling a potential bullish reversal. Conversely, bearish divergence occurs when the price makes higher highs, but the RSI forms lower highs, indicating a potential bearish reversal.
Trend Confirmation: The RSI can also be used to confirm existing trends in the crypto market. In a strong uptrend, the RSI tends to remain above 50, while in a strong downtrend, it tends to stay below 50. Traders can look for opportunities to enter trades in the direction of the trend when the RSI confirms the market’s momentum.
#2. MACD Alert Indicator – The Convergence and Divergence of Moving Averages
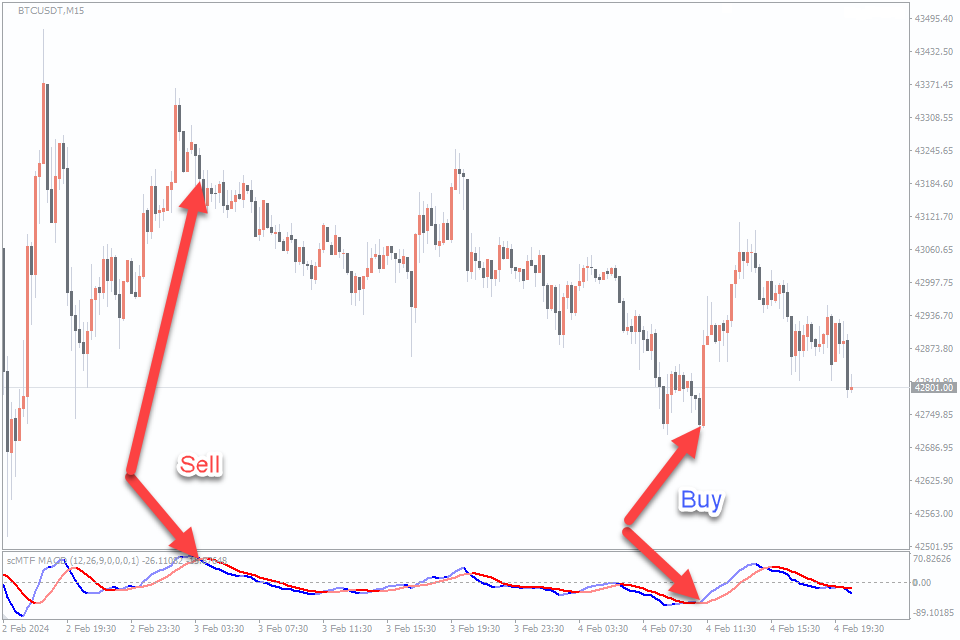
The Moving Average Convergence Divergence (MACD) is a trend-following momentum indicator that shows the relationship between two moving averages of a cryptocurrency’s price. The MACD is composed of two lines – the MACD line and the signal line, along with a histogram. It’s particularly useful for identifying trend reversals and momentum.
Utilization in Crypto Trading
In the realm of cryptocurrency trading, the MACD indicator proves to be a versatile tool, particularly when applied across different timeframes. Personally, I find it most effective when utilized on both the H1 (1-hour) and M15 (15-minute) timeframes. For the H1 timeframe, I prefer to use the settings 5, 13, 8, while for the M15 timeframe, I opt for 3, 8, 5. These configurations offer a balanced approach to trend identification and confirmation, allowing traders to capitalize on shorter-term price movements while also capturing broader market trends. By aligning MACD settings with specific timeframes, traders can achieve greater precision and responsiveness in their trading decisions.
Strategies for Harnessing the Power of MACD
Identifying the MACD Crossover: On the M15 timeframe, the MACD crossover holds significant sway. A bullish crossover signals a potential buying opportunity when the MACD line surpasses the signal line. Conversely, a bearish crossover indicates a potential selling opportunity as the MACD line dips below the signal line.
Confirming the Trend: Enhance the credibility of MACD crossovers by corroborating them with signals from the older H1 timeframe, where similar line crossovers occur. Alternatively, leverage other indicators or analytical methods. Assess the broader market trend, evaluate support and resistance levels, or analyze indicators like the RSI or Bollinger Bands. Confirming the trend helps sift through false signals and boosts trading precision.
Setting Entry and Exit Points: Once a confirmed trend and MACD crossover are established, define entry and exit points meticulously. Consider entering the trade immediately after the crossover, aligning with the confirmed trend direction to capitalize on favorable momentum. For exit points, opt for predetermined profit targets or employ trailing stop-loss orders to safeguard profits and mitigate potential losses effectively.
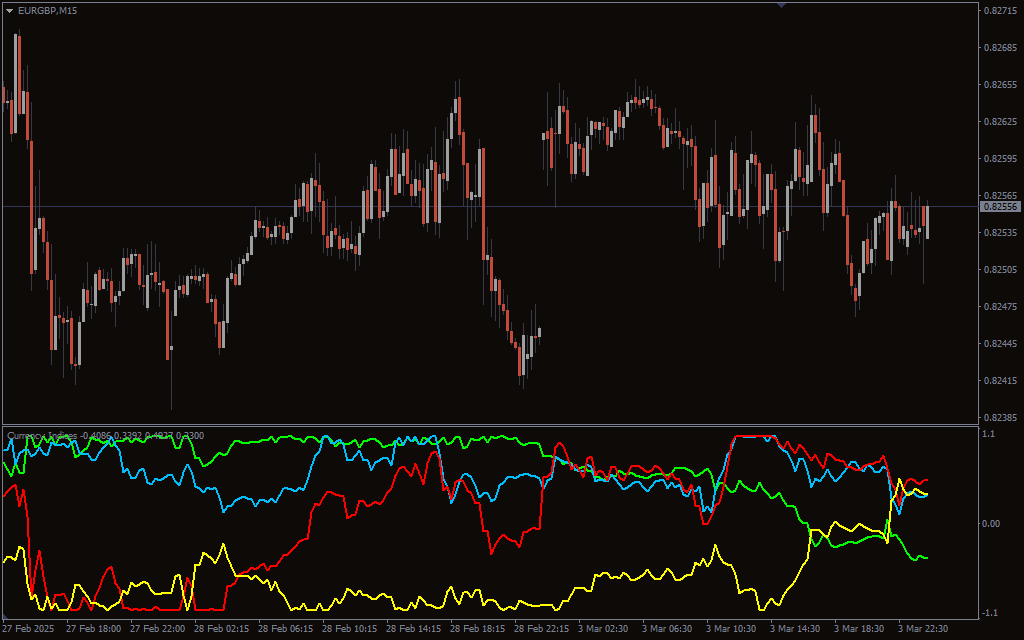
#3. Trend Finder Indicator – Trend identifier
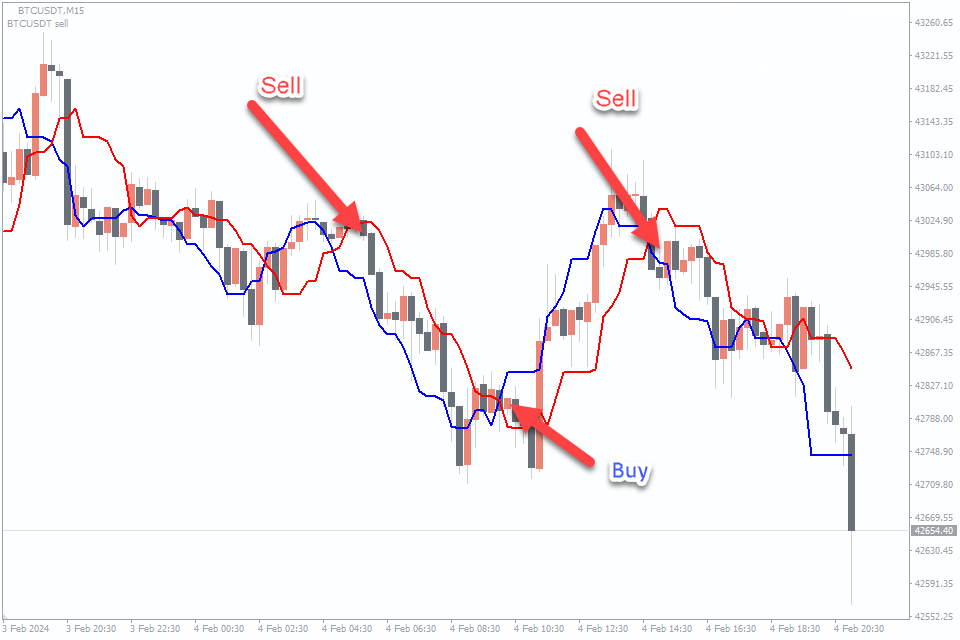
The Trend Finder Indicator is a powerful tool used by traders in the all markets. This indicator works by analyzing price action and plotting lines on the chart to visualize the direction of the trend. By utilizing the Trend Finder Indicator, traders can quickly determine whether the market is trending upwards, downwards, or moving sideways.
Utilization in Crypto Trading
When using the Trend Finder Indicator, traders look for specific signals to enter and exit trades. For example, a bullish signal occurs when the red line of the indicator crosses above the blue line, indicating a potential uptrend. Conversely, a bearish signal is generated when the red line crosses below the blue line, suggesting a possible downtrend. These signals help traders make informed decisions about when to enter or exit positions, maximizing profit potential.
In addition to identifying trend directions, the Trend Finder Indicator can also be used to confirm trends identified by other technical analysis tools.
Strategies for Using the Trend Finder Indicator
Trend Identification: The core purpose of the Trend Finder Indicator lies in recognizing trends within price movements, aiding traders in discerning whether the market is trending upwards, downwards, or moving sideways. For buy positioning, observe when the red line dips below the blue line, coinciding with the price crossing over up the red line. Conversely, for sell positioning, the scenario is reversed, with the blue line situated below the red line, and the price crossing over down the red line.
Confirmation Signals: To bolster the reliability of trading decisions, it’s prudent to seek confirmation signals from complementary technical indicators or analysis techniques. For instance, validate the trend identified by the Trend Finder Indicator by cross-referencing it with signals from oscillators or other trading indicators.
Setting Entry and Exit Points: Once a trend is established, identify suitable entry points aligned with the trend’s direction. Likewise, determine clear exit points based on predefined trading objectives and risk tolerance levels. Consider taking profits as the trend displays signs of losing momentum or when significant support or resistance levels are approached. Additionally, remain vigilant to exit trades promptly if market conditions shift or if the trend undergoes a reversal.
#4. Advanced Bollinger Bands Indicator – Understanding Volatility
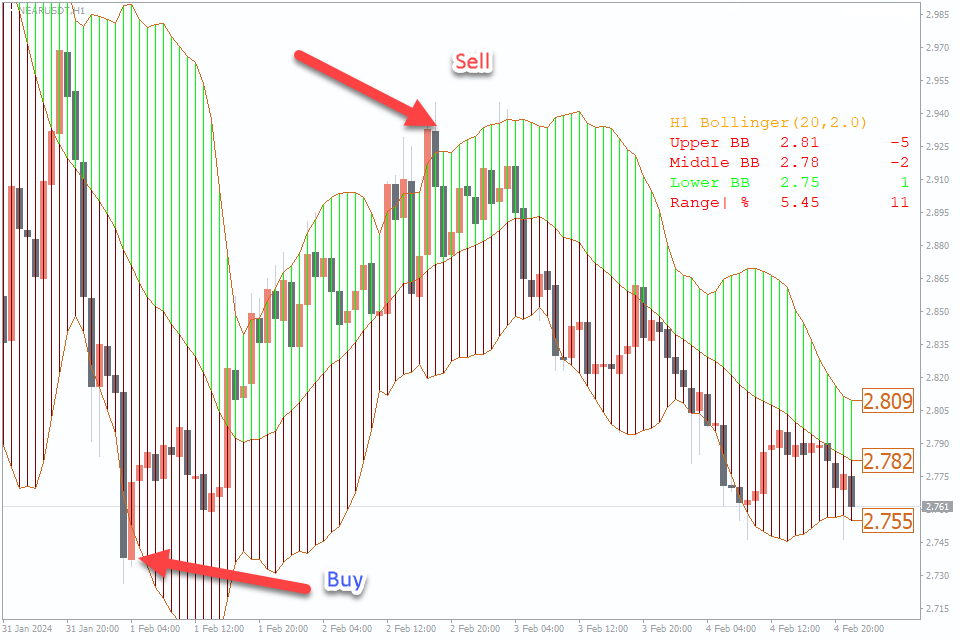
Bollinger Bands are effective tools for assessing price volatility in the crypto market. These bands, consisting of a moving average and upper and lower bands based on standard deviations, help traders identify periods of high or low volatility, aiding in decision-making regarding trade entries and exits.
Utilization in Crypto Trading
The Bollinger Bands indicator is a versatile tool widely used in cryptocurrency trading due to its ability to provide valuable insights into market volatility and potential price reversals.
Strategies for Using the Advanced Bollinger Bands Indicator
Trend Identification: Bollinger Bands consist of three lines: the upper band, the lower band, and the middle band (which is typically a simple moving average). When the price is trading near the upper band, it indicates that the market may be overbought, while trading near the lower band suggests oversold conditions. Traders can use this information to identify the direction of the trend. In an uptrend, the price tends to hug the upper band, while in a downtrend, it gravitates towards the lower band.
Volatility Measurement: Bollinger Bands expand and contract based on market volatility. During periods of high volatility, the bands widen, while they narrow during low-volatility periods. Traders can use the width of the bands as a gauge of volatility, with wider bands suggesting greater volatility and narrower bands indicating lower volatility. Understanding volatility can help traders adjust their trading strategies accordingly, such as setting wider stop-loss orders in volatile markets.
Reversal Signals: Bollinger Bands can also be used to identify potential price reversals. When the price touches or penetrates the outer bands, it may signal an overextended market and a potential reversal in the opposite direction. Traders can look for candlestick patterns or other technical indicators to confirm these reversal signals before entering a trade.
Mean Reversion Trading: Another popular strategy involves mean reversion trading, where traders anticipate the price to revert back to the mean (middle band) after reaching the outer bands. In this strategy, traders buy when the price touches or falls below the lower band and sell when it touches or rises above the upper band. However, it’s important to use additional confirmation signals to filter out false signals and avoid getting caught in a prolonged trend.
#5. Fibonacci Retracement Indicator – Pinpointing Key Levels
Fibonacci Retracement levels are instrumental in identifying key support and resistance levels.
Based on Fibonacci ratios, these levels help traders anticipate price movements and strategically place orders.
Utilization in Crypto Trading
Fibonacci Retracement is a powerful technical analysis tool widely used in cryptocurrency trading for identifying potential support and resistance levels, as well as predicting price retracements.
Strategies for Using the Fibonacci Retracement Indicator
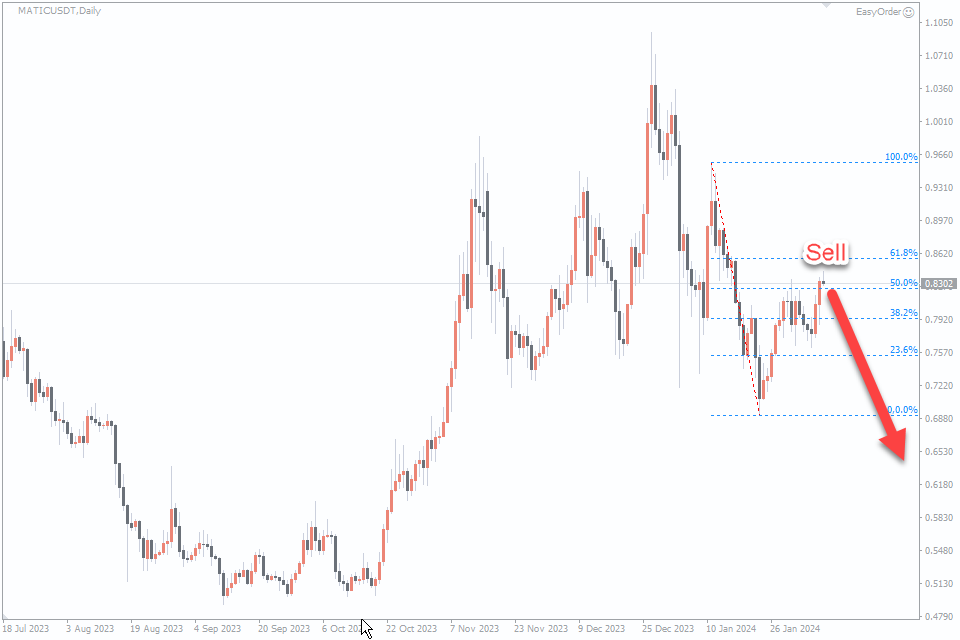
Identifying Support and Resistance Levels: Fibonacci Retracement levels are based on key Fibonacci ratios (23.6%, 38.2%, 50.0%, 61.8%, and 78.6%), which are drawn on a price chart to identify potential support and resistance levels. Traders look for instances where these Fibonacci levels align with significant price levels, such as previous swing highs or lows. In an uptrend, traders may use Fibonacci Retracement to identify potential buy zones near the 38.2% or 50.0% retracement levels, which often act as support. Conversely, in a downtrend, traders may look for potential sell zones near the 38.2% or 50.0% retracement levels, which could act as resistance.
Predicting Price Retracements: Fibonacci Retracement is also used to predict potential price retracements during a trend. After identifying a significant price swing, traders draw Fibonacci retracement levels from the swing low to the swing high in an uptrend, or from the swing high to the swing low in a downtrend. These retracement levels act as potential areas where the price may retrace before continuing in the direction of the trend. Traders may look for confluence between Fibonacci retracement levels and other technical indicators or chart patterns to increase the reliability of their trading signals.
Trading Fibonacci Extensions: In addition to retracement levels, Fibonacci Extensions can be used to identify potential price targets or extension levels beyond the initial price swing. Traders draw Fibonacci Extension levels by extending the Fibonacci retracement tool beyond the initial swing high or low. These extension levels act as potential areas where the price may reverse or consolidate. Traders may use Fibonacci Extensions in combination with other technical analysis tools to identify high-probability trade setups and set profit targets.
Combining with Other Indicators: Fibonacci Retracement can be combined with other technical indicators, such as moving averages, trendlines, or oscillators, to enhance trading signals.
#6. EMA Indicator – The Foundation of Analysis
Moving Averages (MA) are foundational indicators in crypto trading, providing a clear visualization of price trends over time. Simple Moving Averages (SMA) and Exponential Moving Averages (EMA) help traders identify bullish or bearish trends, aiding in strategic entry and exit points.
Utilization in Crypto Trading
Exponential Moving Averages (EMAs) are widely used in crypto trading due to their ability to respond quickly to recent price changes, making them suitable for capturing short-term trends and identifying potential entry and exit points.
Strategies for Using the EMA Indicator
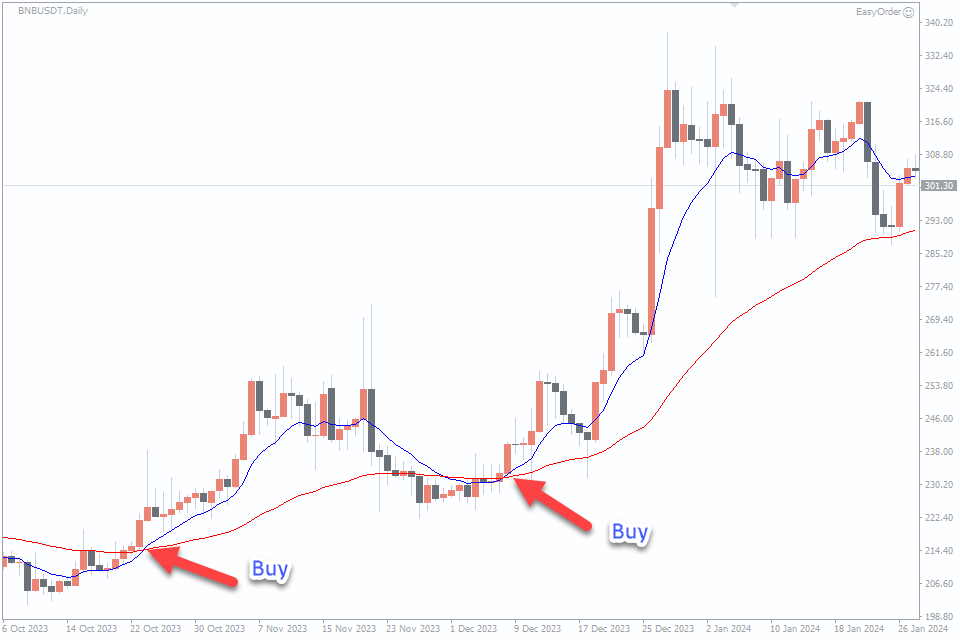
Trend Identification: EMAs help traders identify the direction of the trend by plotting a line that represents the average price of an asset over a specific period, giving more weight to recent prices. When the price is trading above the EMA, it is considered an uptrend, while a price below the EMA indicates a downtrend. Traders can use multiple EMAs with different timeframes (e.g., 20 EMA and 50 EMA) to confirm the direction of the trend.
Entry and Exit Signals: EMAs can generate entry and exit signals based on crossovers between different EMAs or between the price and the EMA. A bullish signal occurs when a shorter-term EMA crosses above a longer-term EMA, indicating a potential buying opportunity. Conversely, a bearish signal occurs when a shorter-term EMA crosses below a longer-term EMA, signaling a potential selling opportunity. Traders can also use the price crossing above or below the EMA as a signal to enter or exit trades.
Support and Resistance Levels: EMAs can act as dynamic support and resistance levels during trending markets. During an uptrend, the EMA may act as support, providing buying opportunities when the price retraces to the EMA. Conversely, during a downtrend, the EMA may act as resistance, offering selling opportunities when the price rallies towards the EMA.
Trend Reversals: EMAs can help traders identify potential trend reversals by observing changes in the slope of the EMA lines or the occurrence of EMA crossovers. For example, a bullish reversal may occur when a shorter-term EMA crosses above a longer-term EMA after a prolonged downtrend, indicating a shift in momentum to the upside. Conversely, a bearish reversal may occur when a shorter-term EMA crosses below a longer-term EMA after an extended uptrend, signaling a shift in momentum to the downside.
#7. FXSSI.Better Volume Indicator – The Silent Indicator
Volume is a crucial yet often overlooked indicator in cryptocurrency trading. By analyzing trading volume, traders can gauge the strength of price movements and identify potential trend confirmations or reversals.
Utilization in Crypto Trading
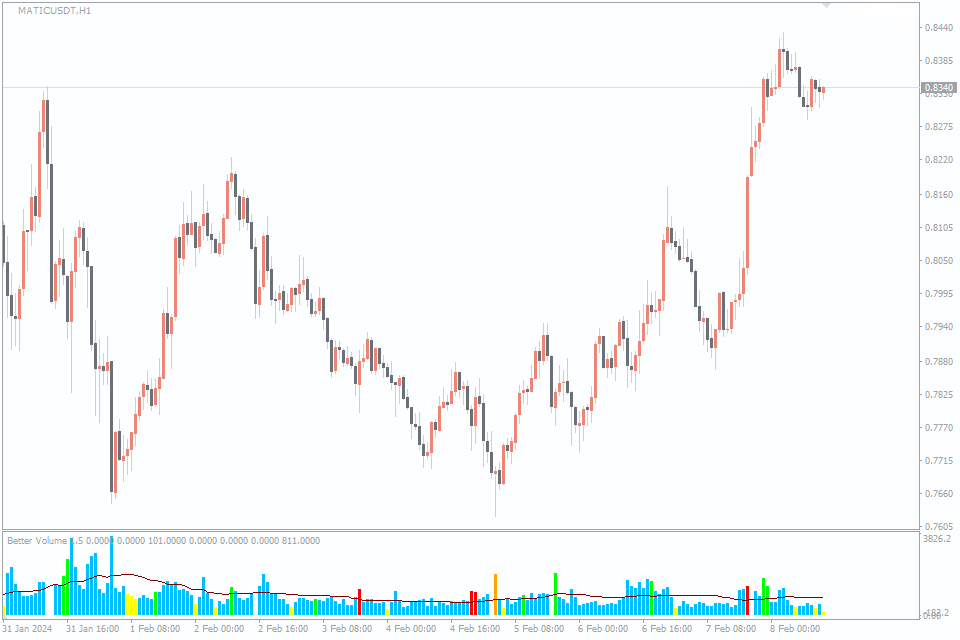
Volume is a critical component of technical analysis in the cryptocurrency market, providing valuable insights into market dynamics and price movements. I used Volumes like a confirmation filter in my strategies.
Strategies for Using the FXSSI.Better Volume Indicator
Confirmation of Price Movements: Volume acts as a confirming indicator, validating the strength and sustainability of price movements. High trading volume accompanying price increases suggests strong buying interest and conviction, confirming bullish trends. Conversely, high volume during price declines confirms bearish trends, indicating strong selling pressure.
Breakout Confirmation: Volume plays a crucial role in confirming breakout patterns. Breakouts accompanied by above-average volume are considered more reliable and have a higher probability of continuation. Traders often look for breakout patterns, such as triangles or rectangles, with increasing volume to validate the breakout and enter trades accordingly.
Trend Reversal Signals: An increase in trading volume following a prolonged trend can signal a potential trend reversal. For example, a surge in volume after a sustained downtrend may indicate capitulation selling, suggesting a possible trend reversal to the upside. Similarly, a spike in volume after a prolonged uptrend may signal exhaustion buying and a potential trend reversal to the downside.
Divergence Analysis: Volume divergence occurs when the price of an asset moves in one direction while trading volume moves in the opposite direction. Bullish volume divergence occurs when the price makes lower lows, but volume makes higher lows, indicating underlying buying pressure. Conversely, bearish volume divergence occurs when the price makes higher highs, but volume makes lower highs, signaling potential selling pressure and a possible trend reversal.
Support and Resistance Levels: Volume can act as dynamic support and resistance levels. High-volume areas often serve as significant support or resistance zones, where traders anticipate price reactions. Breakouts above resistance with high volume or breakdowns below support with high volume are considered strong signals, indicating potential trend continuation or reversal.
Conclusion
In conclusion, utilizing indicators for cryptocurrency trading can provide valuable insights into market trends, price movements, and potential trade setups. However, it’s essential to understand that no indicator is infallible, and trading always involves inherent risks. You also be given an additional strong advantage, both when entering and exiting the market, by using candlestick patterns. By combining multiple indicators, conducting thorough technical analysis, and implementing effective risk management strategies, traders can improve their trading performance.
Remember to continuously monitor market conditions, stay informed about relevant news and developments, and adapt your trading strategies as needed.
Ultimately, success in cryptocurrency trading hinges on the ability to experiment with diverse tools, different timeframes, refine strategies iteratively, and adapt to ever-changing market conditions, thereby optimizing the potential for favorable outcomes in this dynamic and unpredictable landscape.


Leave a Reply