

The Best Entry and Exit Indicators for MT4 and MT5 to Use in Your Trading Strategy
As a forex trader, you have only three things to figure out whenever you hit the chart to trade: Knowing when to enter a trade, what to risk, and when to get out, but this is more challenging than it sounds.
It can be pretty terrifying. This is where custom indicators come in. By automating two of these three factors, staying profitable is well within your reach.
This article presents 20 of the best entry and exit indicators you can use today. Discover the best entry and exit indicators for MT4 and MT5.
Let’s look at each indicator separately. The main advantages and basic information you need to know in order to create a profitable strategy. We should note that we have analyzed the indicator data as of March 2023.
Table of Content
- Stop Loss Clusters (SLC) Indicator
- Lucky Reversal Indicator
- Buy Sell Magic Indicator
- Half Trend Buy Sell Indicator
- Chandelier Exit Indicator
- Super Arrow Indicator
- FXSSI Profit Ratio Indicator
- QQE Indicator
- RSI Divergence Indicator
- Swing ZZ Zigzag Indicator
- Forex Entry Point Indicator
- Heiken Ashi Indicator
- Best Scalping Indicator
- Entry Signal++ Indicator
- Forex Signals Indicator
- Semafor Alert Indicator
- TRIX.Crossover Indicator
- SFI Indicator Entry And Exit
- EntryExit-Trend Indicator
- MSP Indicator
#1 Stop Loss Clusters (SLC) Indicator
Number of Downloads: 33.6k
Score: 3.6/5.0
Timeframes: M5 – W1
Repaints: No
Alerts: No
Signal Frequency: 5 – 10 Per Day
If you randomly tell thousands of retail traders to set their stop losses for a given trade, around 70% will set their stop losses around the same zones, irrespective of their strategies. This is a result of what is popularly referred to as the “psychological trap”.
These market makers can usually hunt these stop-loss points, using them as a magnet to acquire more liquidity to fuel their trades.
But this is where the Stop Loss Cluster (SLC) Indicator comes in. SLC takes you lightyears ahead of the “crowd” by allowing you to spot where the “losing masses” are placing their stop losses so that you can avoid putting yours there too.
But how has this got to do with determining entries and exits for your trades?
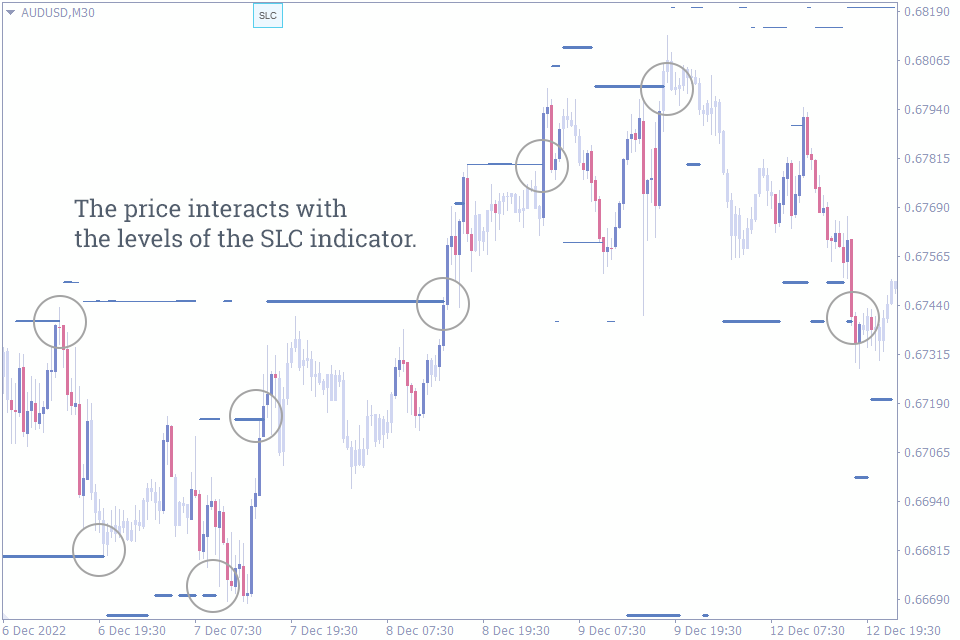
How To Exit Trades Using Stop Loss Cluster (SLC) Indicator
Based on the screenshot above, by taking your profits from open long positions at any of these levels, you would have escaped the oncoming bearish onslaught.
Check your charts. You’ll notice that the price often reacts at these stop-loss clusters. Sometimes, the price even uses these stop-loss clusters as a temporary support or resistance.
And that’s a good thing for you as a trader. Why?
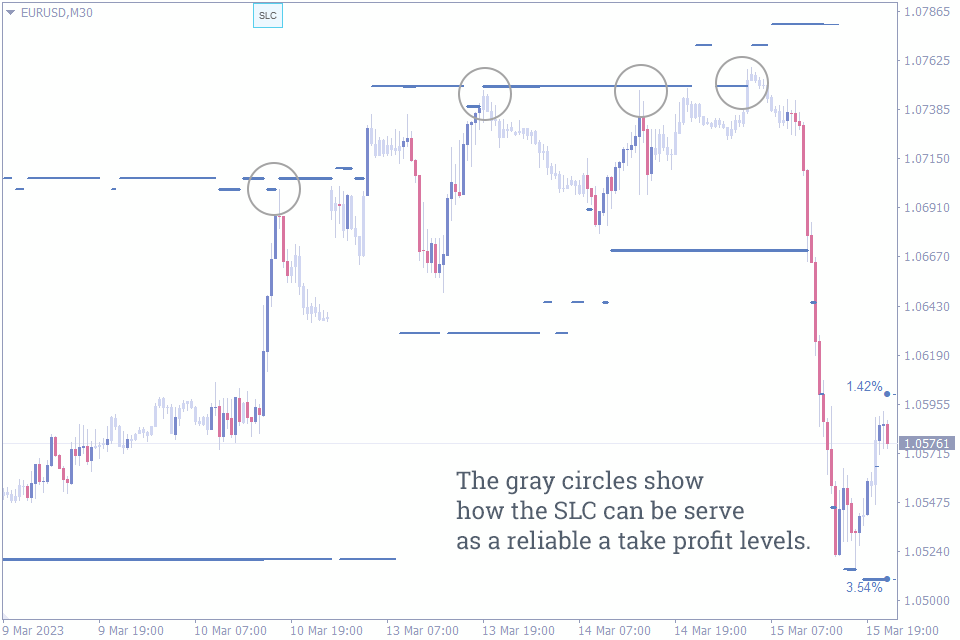
Because you can set your take profit levels at these levels, knowing the price would most likely hit them. And that’s how you can use the SLC indicator as a trade exit mechanism.
The SLC indicator is the best when it comes to setting Take Profit effectively. The logic is quite simple: if you have an open trade, set Take Profit at the level of the Stop Loss cluster. The upper or lower cluster depends on trade direction: the lower is for Sell trades, and the higher one is for Buy trades.
How To Enter Trades Using The Stop Loss Cluster (SLC) Indicator
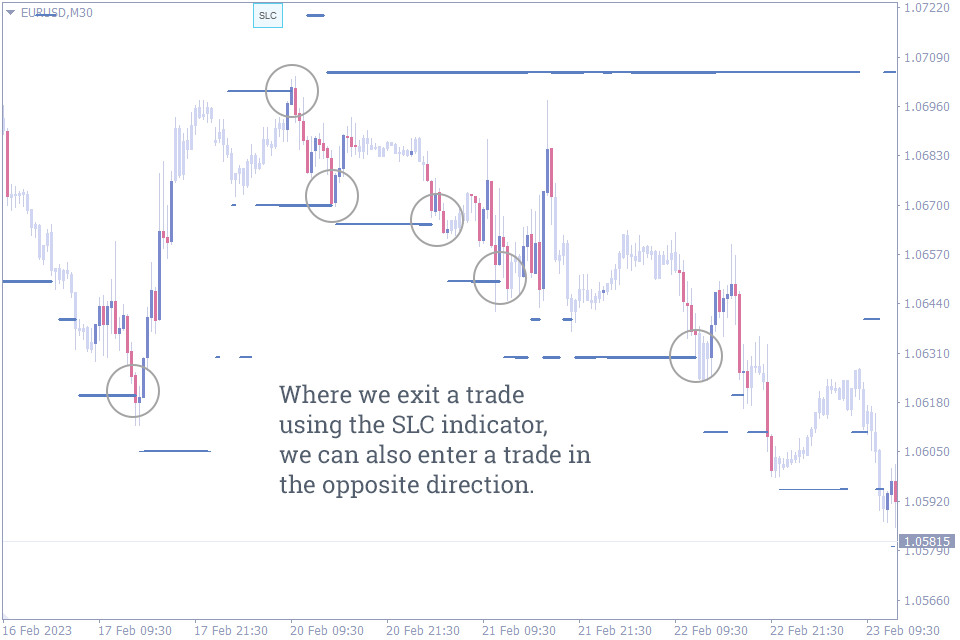
If you think about it, the ideal exit level for a trade is one after which the price reverses.
One of the peculiarities of the stop loss clusters is that the price tends to reverse at them because they sometimes serve as temporary support and resistance levels. And what does this mean for you? It’s another opportunity to trade the reversal!
So, if the price hits a stop loss cluster below it, you expect the price to bounce back up. That’s a buy opportunity right there. And if the price hits a stop loss cluster above it, you expect the price to fall back down. Another sell opportunity for you!
If you stick to the following rules, you can skip “trap” trades more often and potentially increase your winrate. You can click here to learn more about the indicator.
#2 Lucky Reversal Indicator
Number of Downloads: 33.1k
Score: 4.12/5
Timeframes: All
Repaints: Yes
Alerts: No
Signal Frequency: 5 – 10 per day
Reversals always provide us with new trade entry points. A tool that helps you spot them on time makes trading them even worth the risk.
Lucky Reversal Indicator, although lags, provide you with enough confluence to take trades in the direction of the newly-formed trend.
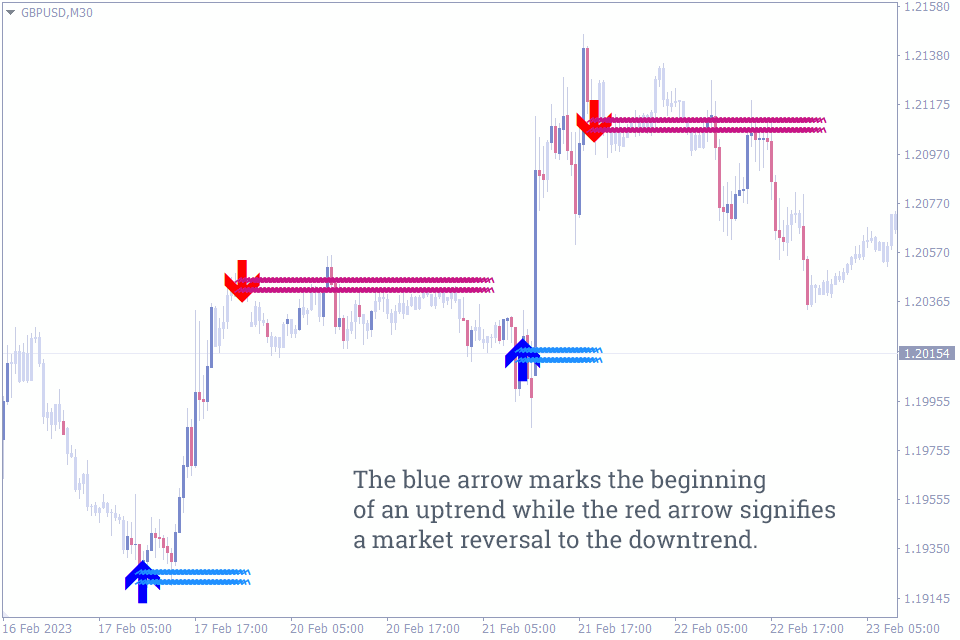
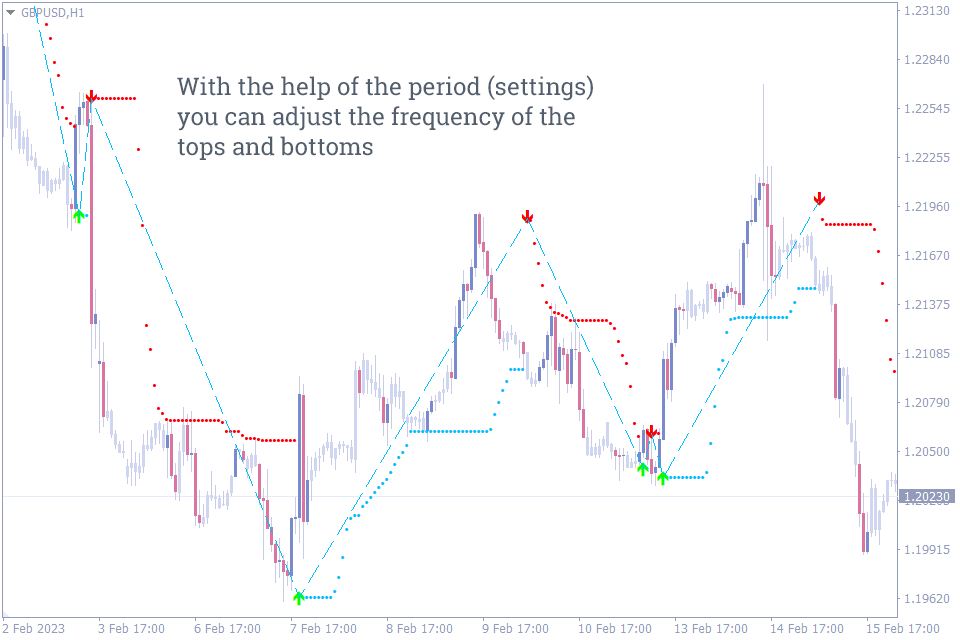
The Lucky reversal indicator does what its name implies: it tells when the trend has turned from an uptrend to a downtrend, or from a downtrend to an uptrend. It gives its signals in the form of blue and red arrows, each followed by wavy horizontal lines.
#3 Buy Sell Magic Indicator
Number of Downloads: 25.0k
Score: 3.97/5
Timeframes: M1 – M30
Repaints: No
Alerts: Yes
Signal Frequency: 13 – 17 per day
This indicator, a combination of three indicators, provides an easy way for beginners and professional scalpers to enter and exit their trades. The indicator suits all forex pairs, especially during London sessions when the market is more volatile.
While using indicators like the Buy Sell Magic Indicator, you must be careful enough to use other tools as a confirmation before risking much of your capital.
An indicator with a green arrow indicates that it is time for a long position. The screen alert will notify you when the signal is detected. The best thing about the indicator is that it calculates your stop loss automatically. You just need to complete the order.
If the indicator shows a red arrow, an alert and a sell signal, it is possible to open a short position. A suitable stop loss is also displayed in the pop-up alert. You can also set a stricter stop loss by placing it above the dotted lines.
#4 Half Trend Buy Sell Indicator
Number of Downloads: 21.5k
Score: 3.5/5
Timeframes: All
Repaints: No
Alerts: Yes
Signal Frequency: 6 – 7 per day
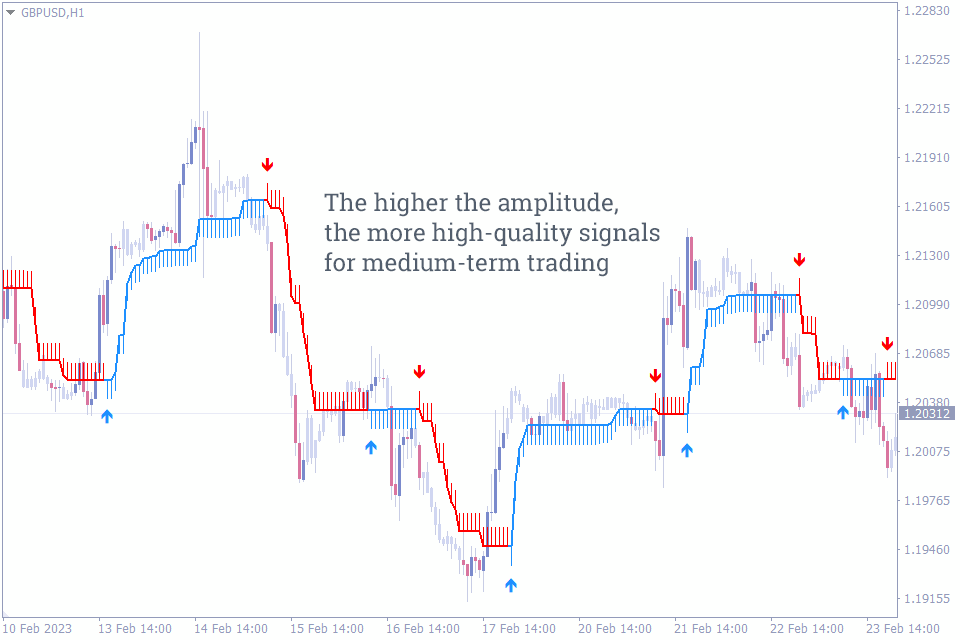
Using non-repainting arrows to guide the trader doesn’t just make entering a trade easier and stands as one of the best exit indicators on this list. The Half Trend Buy Sell Indicator only helps you trade the predominant trend in the market.
You can trust the non-repainting indicator once it gives a signal, especially at key price levels. The indicator is a unique trend-following indicator that stays flat during price consolidations. The Half Trend MT4 indicator uses moving averages to calculate accurate signals. As a trend following indicator, online forex traders can use it on any timeframe for successful intraday trading.
#5 Chandelier Exit Indicator
Number of Downloads: 13.1k
Score: 4.14/5
Timeframes: M1 – H4
Repaints: No
Alerts: Yes
Signal Frequency: 3 – 4 Times Per Day
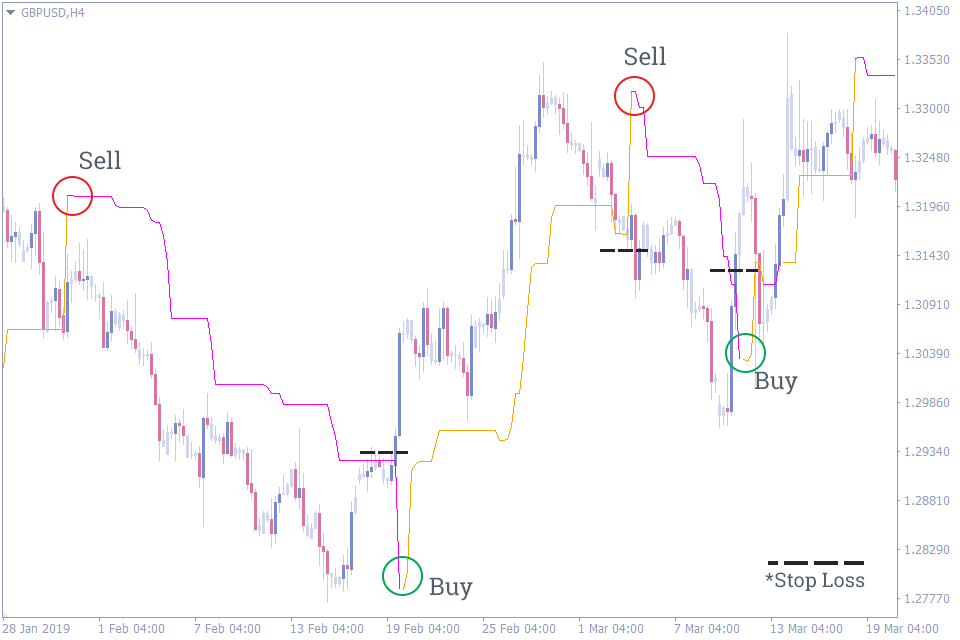
Chandelier Exit is a volatility based indicator created to enable a trader to stay in a trade until there is a definite trend reversal. As explained below, a trader will be able to avoid early exit and realize maximum returns in pips by using the Chandelier Exit indicator.
If you jump out of a trade too early, this indicator is among the few best exit indicators for MT4 and MT5 platforms. Chandelier Exit Indicator uses ATR (Average True Range) to provide a reliable trailing stop loss for your trades.
Using data from the ATR, the indicator makes the indicator levels the best Support and Resistance zones, from where you can anticipate market entries too (especially after breakouts), combine this with other technical tools, and you have forged a potentially profitable tool for yourself.
#6 Super Arrow Indicator
![]()
Number of Downloads: 11.6k
Score: 4.25/5
Timeframes: All
Repaints: No
Alerts: Yes
Signal Frequency: 2 – 3 Per Day
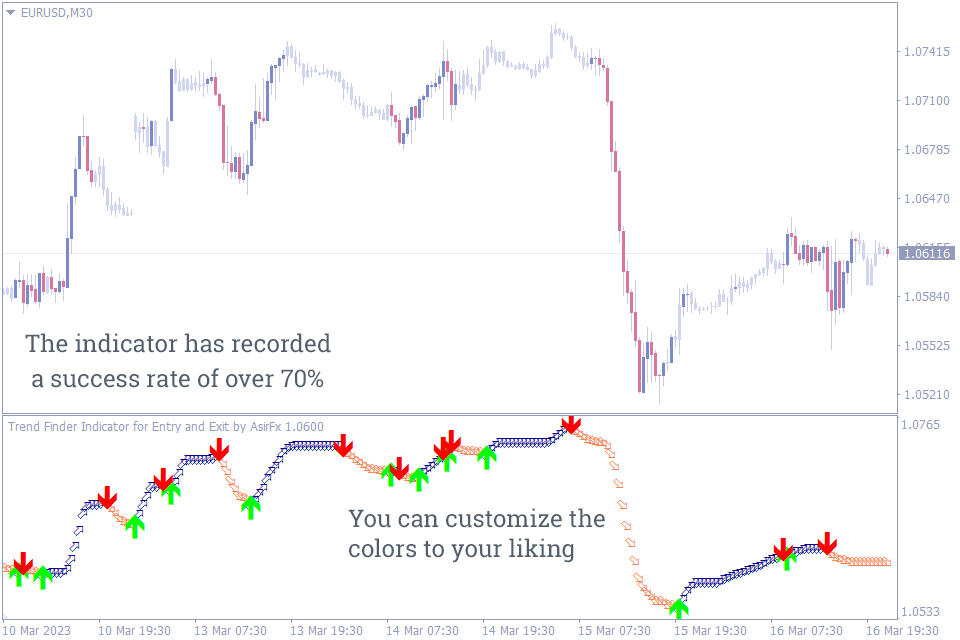
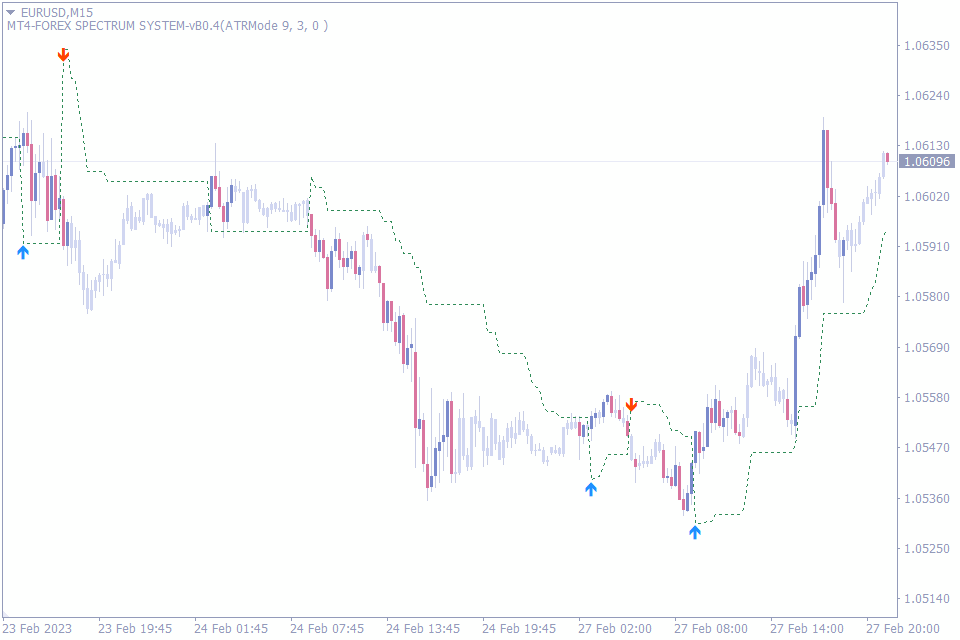
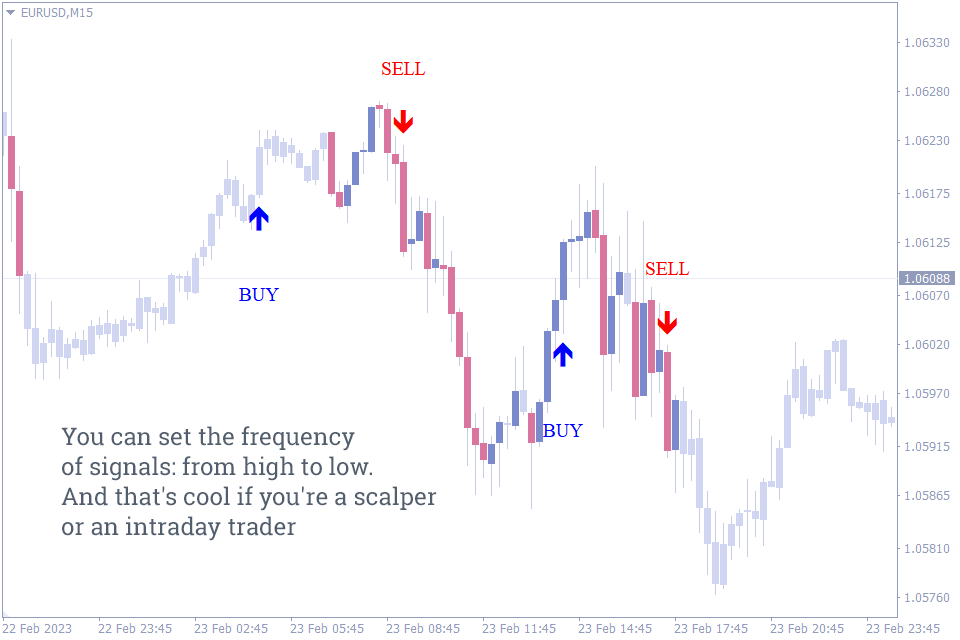
The super arrow indicator is an entry signal indicator for mt4 traders. It combines indicators like moving averages, Bollinger Bands, RSI, and Magic Filter to produce a powerful arrow. The Super Arrow indicator works in all market conditions (trending and ranging market) and in all time frames.
This indicator pops up red (sell) and the green (buy) arrows on the chart. The indicator displays a red arrow when the market is bearish and when there’s a strong sell signal. Consequently, the indicator displays a green arrow when the market is bullish and when there is a strong buy signal. You can change the colors of the arrows to your liking.
You can pair this indicator with price action tools like support and resistance or trendlines to make it even more accurate.
#7 FXSSI Profit Ratio Indicator
Number of Downloads: 11.2k
Score: 4.1/5
Timeframes: All (Preferably M15)
Repaints: No
Alerts: No
Signal Frequency: 5+ Per Day
The market moves up or down due to the orders the buyers or sellers pull at a particular time. When buyers are much, the price trends upward, but the market trends downward as more sellers enter.
The FXSSI Profit Ratio indicator leverages this to give us entry and exit points based on the winning-to-losing ratio in the chosen asset.
Since about 70% of the open trades are losing, traders can use this indicator to identify where the remaining winning traders are putting their money and follow suit. For example, traders can expect a reversal after a sudden spike in the Profit Ratio.
How To Determine The Trend Using Profit Ratio Indicator
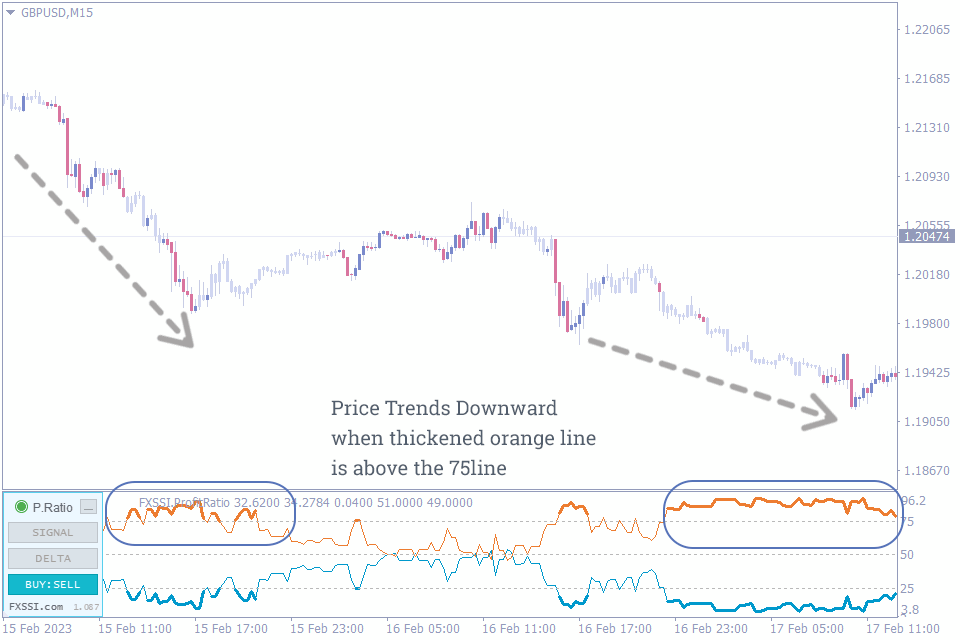
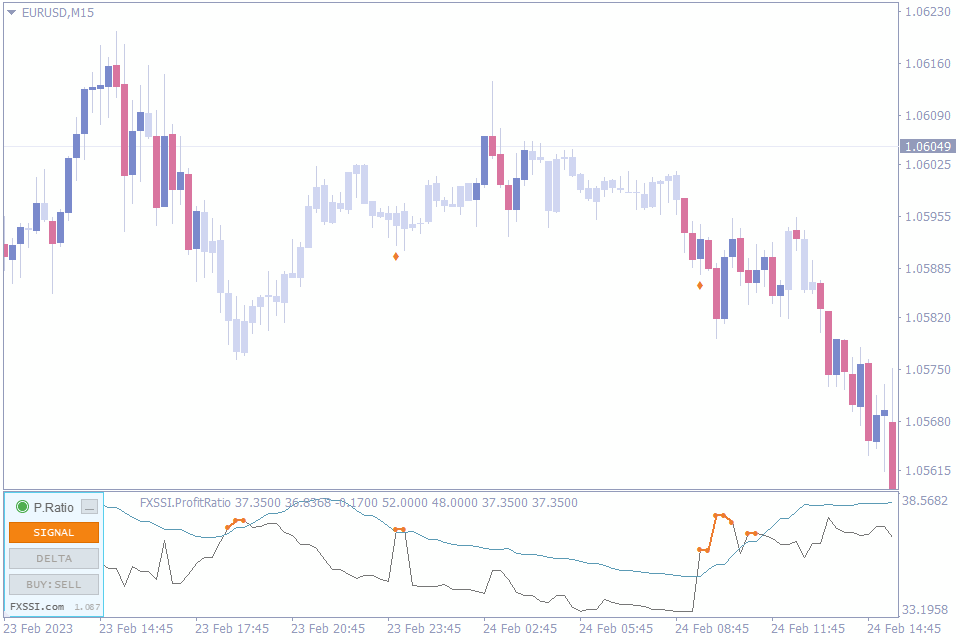
Determining the trend using the Profit Ratio Indicator is straightforward. As shown in the chart above, you just have to navigate to the “BUY: SELL” button and toggle it, after which a chart will open.
It is crucial to note that a downtrend, for example, is filled with 75% of sellers, while an uptrend is filled with 75% of buyers. Hence, the chart shows us the number of buyers and sellers in the market at a given time.
If the blue thickened line is above the 75 line, then it means that buyers are in control. Hence, we are on a bullish trend. On the other hand, if the thickened orange line is above the 75 line, then sellers are in control, and we are in a downtrend.
How To Spot Trend Reversals Using Profit Ratio Indicator
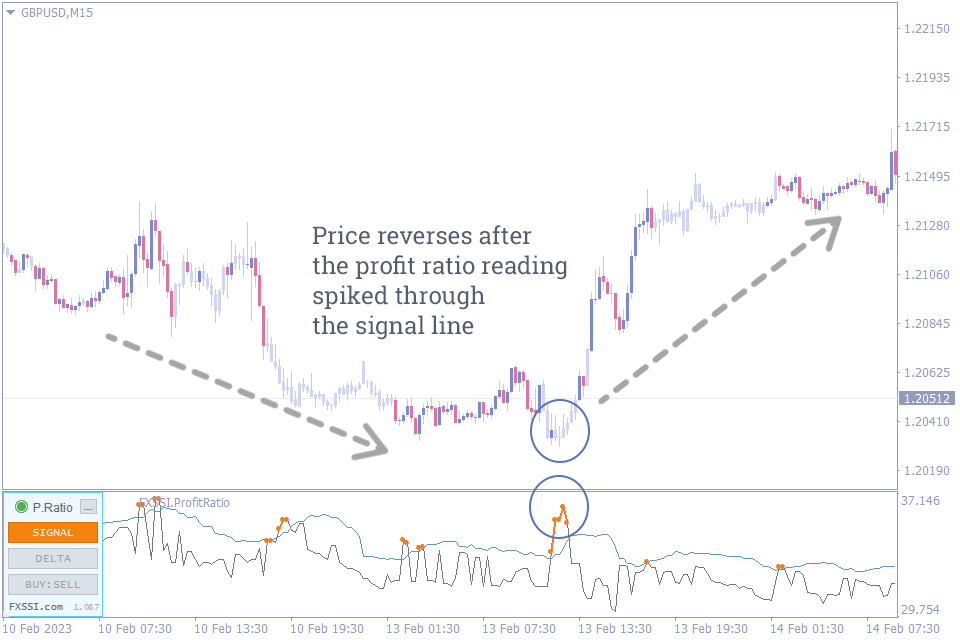
A signal line was added to the indicator to make reading the volatility easier every time in the market. As earlier stated, a spike in the profit ratio is a potential reversal signal.
So, how do we detect this spike on the indicator? We detect the spike when the profit ratio reading exceeds the value of the signal line. This is shown by a portion of the profit ratio reading highlighted in orange.
Entering a reversal trade at this point is the optimal entry for a reversal trade; you are almost guaranteed to enter just at the end of a retracement.
Here are some simple tips to start applying while using the Profit Ratio Indicator:
- Be aware of the navigation tab on the indicator (e.g., “Signal,” “BUY: SELL,” and “DELTA”) and use them properly.
- Ensure you only apply the indicator to the accepted currency pairs.
The Profit Ratio indicator is a perfect all-in-one solution for beginners and professionals. If you carefully follow the above-stated rules and tips, you can easily use the indicator to determine trends, reversals, entry, and exit points. You can click here to learn more about the indicator.
#8 QQE Indicator
Number of Downloads: 11k
Score: 4.75/5
Timeframes: All
Repaints: No
Alerts: No
Signal Frequency: 6 – 7 Per Day
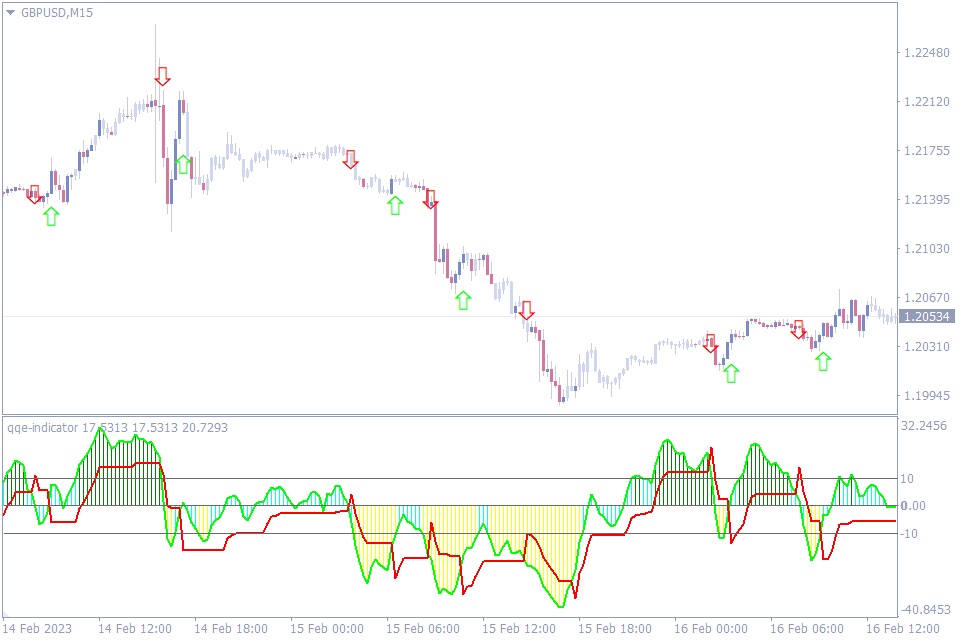
QQE is an abbreviation for the Qualitative Quantitative Estimation. The indicator is based on RSI enhanced using a smoothing technique. This indicator has stood the test of time. It does not lag. Traders can use it to detect entry and exit points while trading a reversal trade. Also you can use it for trend-following trades.
You can use the indicator to identify when the price is on oversold and overbought positions.
The QQE indicator provides traders with extra confirmation needed for their entries. A Price action trader should confirm his entry using the QQE when the price hits his Trendline. This way, he can avoid entering too early and getting stopped.
#9 RSI Divergence Indicator
Number of Downloads: 8.8k
Score: 5/5
Timeframes: All
Repaints: No
Alerts: Yes
Signal Frequency: 10+ Per Day
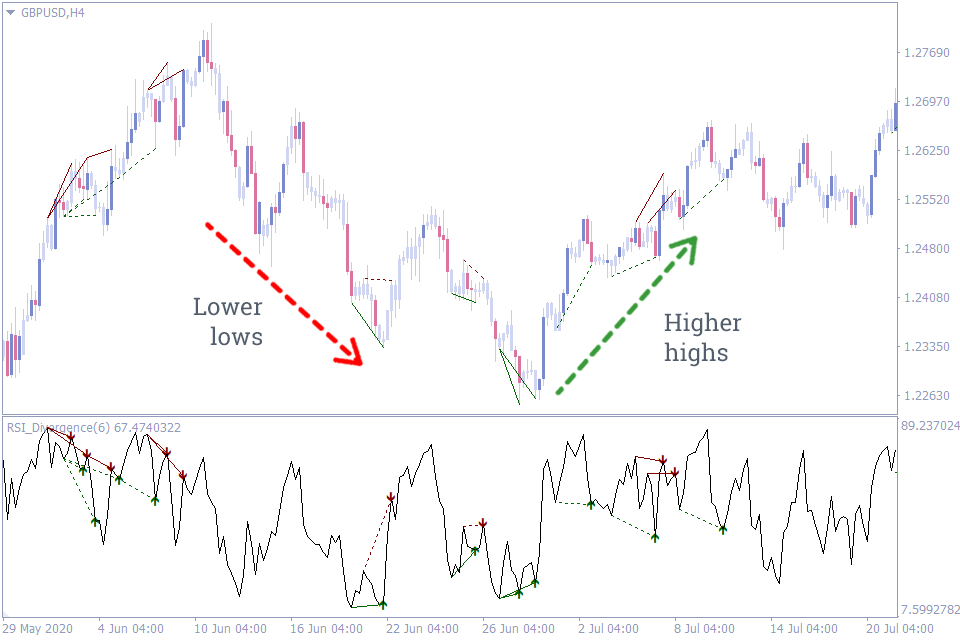
The RSI (Relative Strength Index) measures the market’s momentum for a particular asset and can be a quick signal when the market is about to reverse.
Most times, for a reversal to happen, the momentum will be opposite to what is currently happening in the market. If the market has a succession of Higher Highs, the RSI will begin to show Lower Highs, which signals a reversal to the prevailing bullish movement.
This opposite reaction is known as divergence. The RSI Divergence Indicator can provide immense confirmation to reversal trade entries.
#10 Swing ZZ Zigzag Indicator
Number of Downloads: 6.8k
Score: 5/5
Timeframes: All
Repaints: No
Alerts: No
Signal Frequency: 10+ Per Day
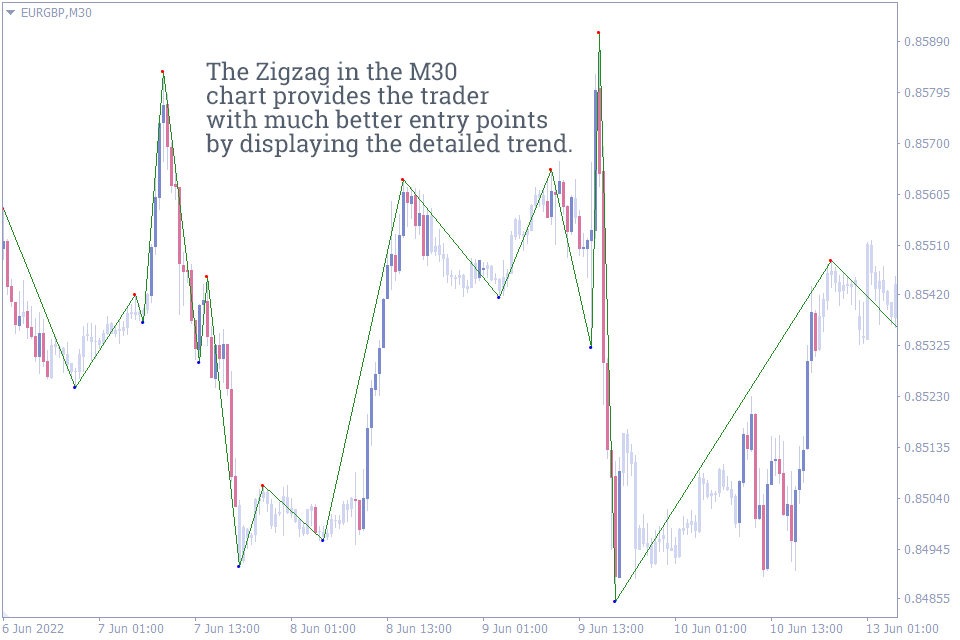
If you are a forex swing trader, the best results can be achieved using the ZIG-ZAG MT4 indicator. The Swing ZZ Zigzag Indicator also provides the trader with a Top-Down forex trading approach. The trends in the higher timeframe charts are more clearly identifiable in, the lower time frame charts. As a result, the lower time frame charts provide much better entry and exit points in the higher timeframe direction. The support and resistance levels in the higher time frames are further identified by traders precisely using the lower timeframe charts enabling precise entry and exit.
Adding to its subtle ability to detect entry and exit points, the indicator gives the trader a more profound sense of the market’s trend.
This simple-to-understand indicator makes it easy to ignore market noise while analyzing the market swing points. You can later use these swing points to draw support, resistance, or trendlines for future analyses.
#11 Forex Entry Point Indicator
Number of Downloads: 5.7k
Score: 3.8/5
Timeframes: M1 – D1
Repaints: No
Alerts: Yes
Signal Frequency: 3 – 4 Per Day
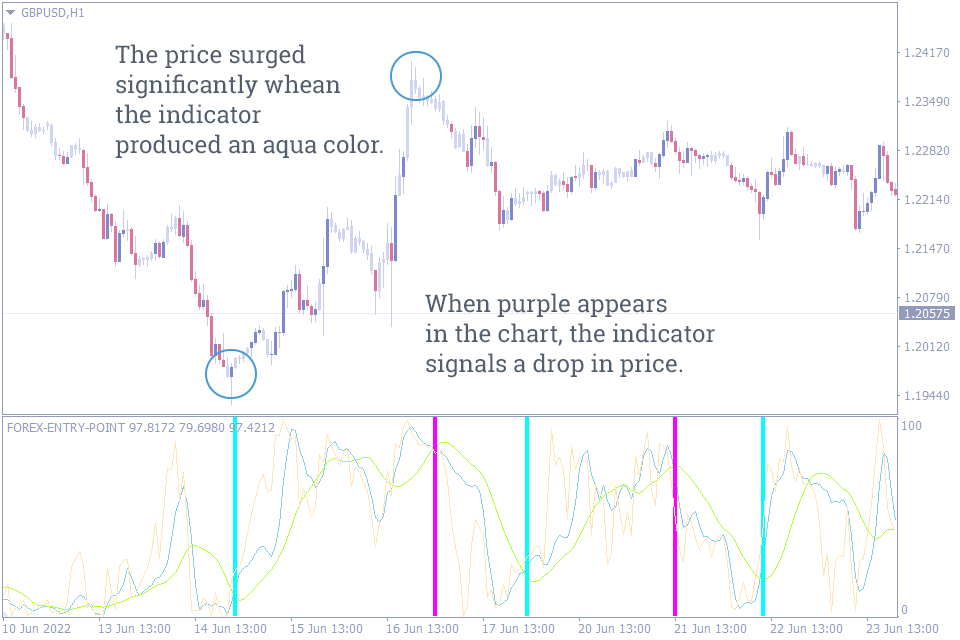
The Forex Entry Point indicator for MT4- free download creates a separate window below the price chart. It predicts potential price changes on the market movement and displays turquoise and magenta vertical lines.
Forex entry point indicator makes it very easy to enter a position; it only signals new opportunities after much scrutiny of the trend. This way, it gives much more accurate signals. Although you cannot rely on this free indicator to tell you when to exit earlier, you can apply any other exit strategy.
Although you can use this indicator on any currency pair and timeframes, from backtesting, it is more suitable for scalpers trading volatile pairs like GBP/JPY on 1 and 5 minutes timeframes.
#12 Heiken Ashi Indicator
Number of Downloads: 5.1k
Score: 3/5
Timeframes: All
Repaints: No
Alerts: No
Signal Frequency: 10+ Per Day
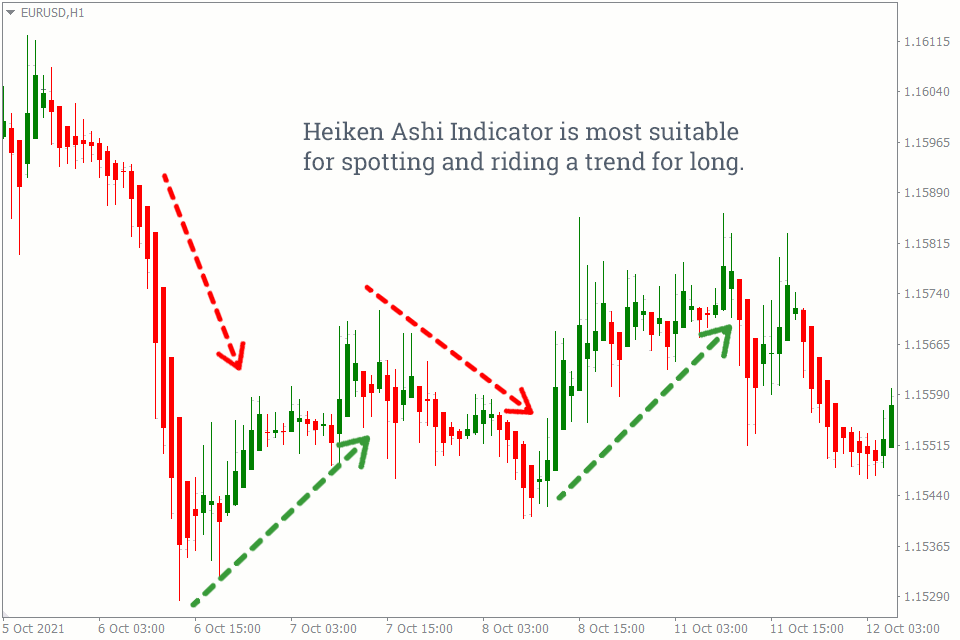
The Heiken Ashi Indicator is a type of Japanese candlestick that takes the average of the 2 periods, thus making it smoother than the ordinary candlestick. The Heiken Ashi indicator, one of the three major chart types, allows you to ride a trend longer than the traditional candlestick chart. By issuing a succession of green candles in an uptrend, or red candles in a downtrend, you are sure to exit when the trend is about to reverse.
The Heiken Ashi Indicator is used by technical traders to identify trends.
The red candles of a Heiken Ashi Indicator means the trend is a downtrend. On the other hand, green candles means the trend is an uptrend as indicated in the diagram above.
#13 Best Scalping Indicator
Number of Downloads: 4.8k
Score: 3.67/5
Timeframes: All
Repaints: Yes
Alerts: Yes
Signal Frequency: 10+ Per Day
A great example of how to use the indicator:
- Look for blue arrows on the chart
- Enter on the blue arrow
- Set a stop loss 15-20 pips from the entry point
- Exit when red arrow appears
Don’t be fooled by the name; the Best Scalping Indicator works for lower timeframe entries and all timeframes. Although the indicator works best on lower timeframes like the 1-minute chart, however, lower timeframes can produce a lot of false signals. Therefore, to apply the strategy, you have to insert the indicator on higher timeframes. Knowing this, you can easily integrate it into your existing strategy if you are a Professional or use it singly if you are just getting started.
You can combine price action tools like supply and demand or technical indicators like moving averages to make a more formidable trading edge.
#14 Entry Signal++ Indicator
Number of Downloads: 3.9k
Score: 5/5
Timeframes: All
Repaints: No
Alerts: Yes
Signal Frequency: 5 – 6 Per Day
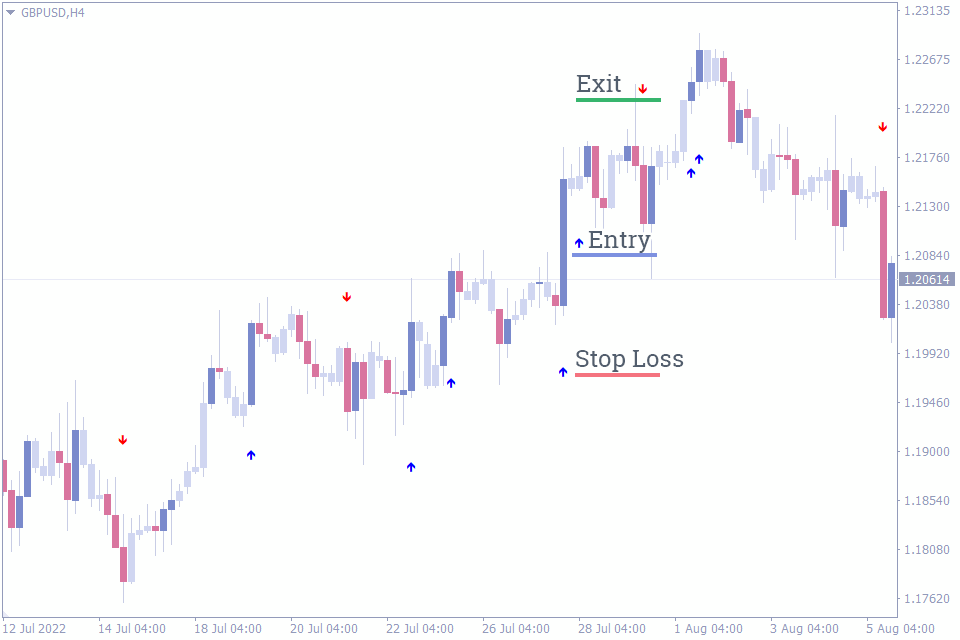
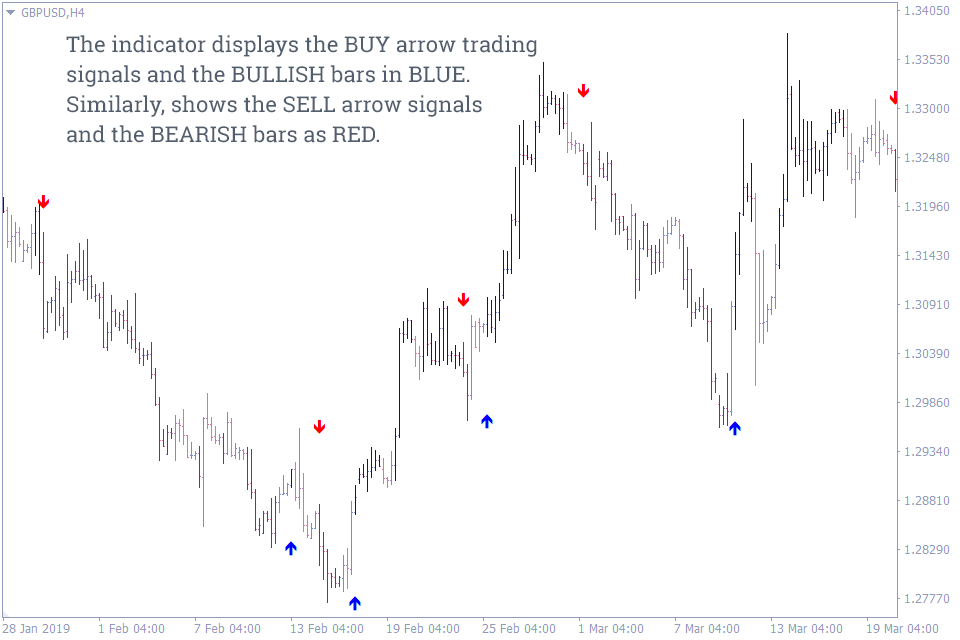
The above chart shows the Entry signal++ indicator for MT4 in action. The indicator changes the bar color and provides a BLUE arrow indicating the beginning of a BULLISH price trend. So forex traders can enter a BUY position with a stop loss at the end of the previous downtrend or the first bar of the neutral trend. This helps the trader to avoid whipsaws and to have a decent stop loss. On the other hand, traders can continue to hold the position and ride the trend until the bar color changes to neutral or RED.
Beginning Intraday traders can use this arrow to make their analysis less complicated. However, advanced traders can combine these with other technical indicators to detect more precise entry and exit points.
The indicator works on all intraday chart time frames as well as daily, weekly, and monthly price charts. So forex traders can use the indicator to trade multi-time frame (mtf) technical trading strategies. Using the Entry Signal++ Indicator can help decrease your chart time while increasing your profitability in the long haul.
#15 Forex Signals Indicator
Number of Downloads: 2.6k
Score: 4.5/5
Timeframes: M1 – M30
Repaints: Yes
Alerts: Yes
Signal Frequency: 7 – 11 Per Day
If you don’t have enough time to sit at the chart daily, you might want to try the Forex Signal Indicator. It provides everything you need for a successful scalping session: Entry, exit, sl, and tp. The indicator provides a channel and arrow indicating the market trend and entry/exit points, respectively.
Setting targets is relatively easy while using the Forex Signals Indicator. For example, your target is set to the next red channel after placing a buy trade. The opposite holds for a sell trade as well. Currently, this indicator is only available on MT4.
#16 Semafor Alert Indicator
Number of Downloads: 2.0k
Score: 3.4/5
Timeframes: All
Repaints: Yes
Alerts: Yes
Signal Frequency: 5 – 7 Per Day
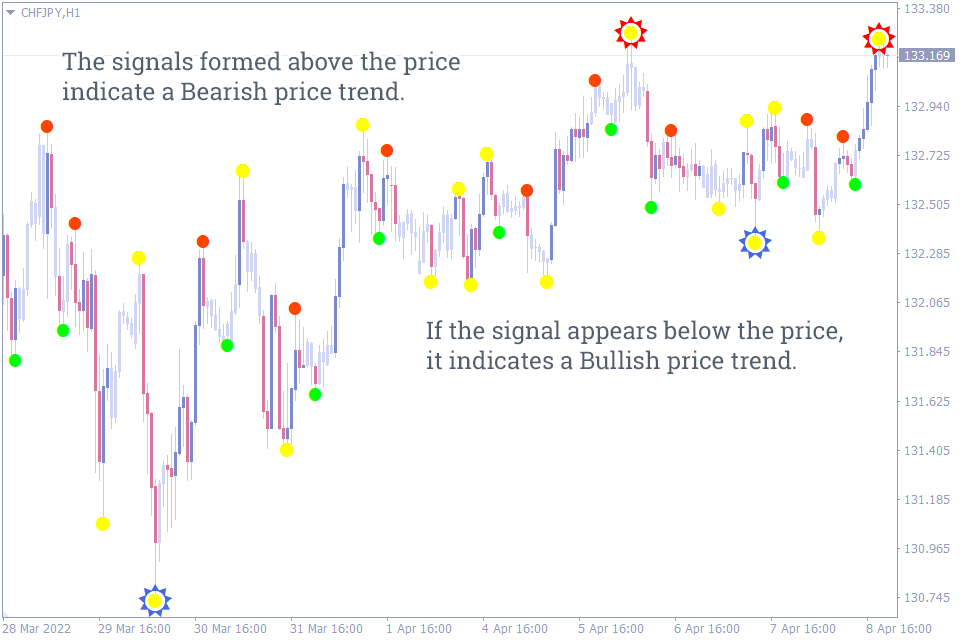
The Semafor Indicator uses the classic ZigZag Indicator data to identify entry and exit points. It generates alerts based on the low, medium, and high periods and is highly customizable to suit your trading personality. Traders can enable or disable alerts for any particular level.
The signals formed above the price indicate a Bearish price trend. So, forex traders can enter a SELL position with a stop loss above the previous swing high. The best take profit position is at the opposite trading signal.
If the signal appears below the price, it indicates a Bullish price trend. So, traders can take BUY trade with a stop loss below the previous swing low. The opposite trading signal is a good take profit point.
Also, you can integrate this indicator into an existing trading system, making it even more robust as it acts as an extra confluence for validating each trade.
#17 TRIX.Crossover Indicator
Number of Downloads: 1.2k
Score: 5/5
Timeframes: All
Repaints: No
Alerts: Yes
Signal Frequency: 3 – 5 Per Day
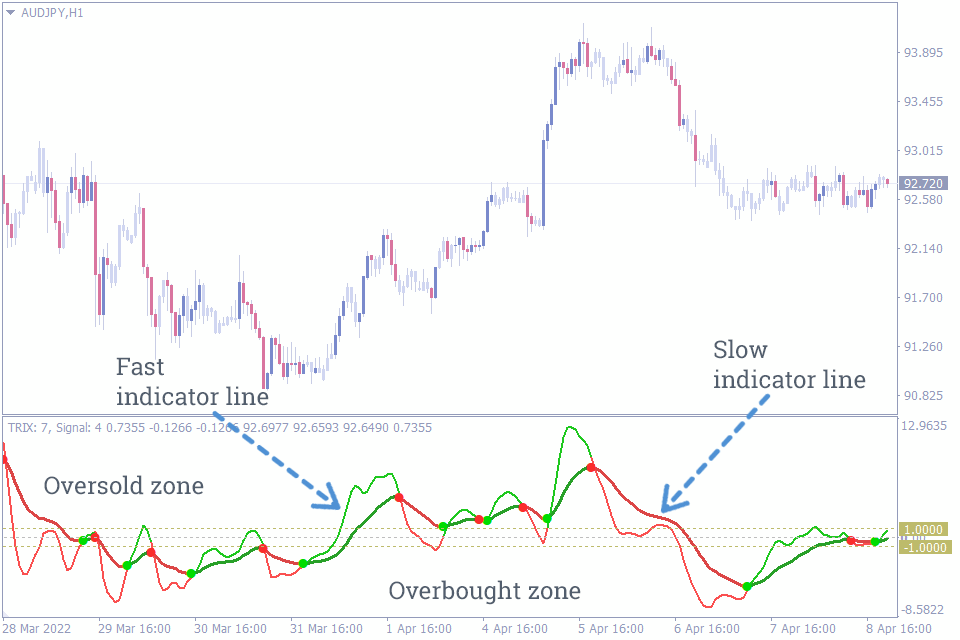
The Trix Crossover Indicator is an upgraded version of the default “Triple Exponential Moving Average” Indicator on the MT4 Terminal. Indicator signals generate two moving averages – fast (signal) and slow (main). When the fast one crosses the slow one, the indicator generates a signal for trade. Such moments are marked with dots. The lower you have specified the period of the fast moving average in the indicator settings, the more often you will get recommendations for opening trades. And vice versa.
What this indicator does is to ensure that you increase your winrate by only trading during the times when the market is trending and avoiding choppy or price ranges.
#18 SFI Indicator Entry And Exit
Number of Downloads: 1.4k
Score: 3.3/5
Timeframes: All
Repaints: No
Alerts: No
Signal Frequency: 5 – 10 Per Day
It is a non-repainting tool with an algorithm that follows the trend of an asset and tracks the historic price data for optimal trade entry/exit level. The SFI Indicator provides a premium Buy/Sell signal, which you can either use as a standalone indicator or alongside other indicators or technical tools to get even more precise entry or exit points.
The indicator has been backtested to be about 70% accurate, making it one of the best MT4 indicators for entry and exit. The high winrate and the overall simplicity of the indicator make it good for beginners and professional traders alike.
#19 EntryExit-Trend Indicator
Number of Downloads: 870
Score: 4/5
Timeframes: All
Repaints: Yes
Alerts: No
Signal Frequency: 3 – 5 Per Day
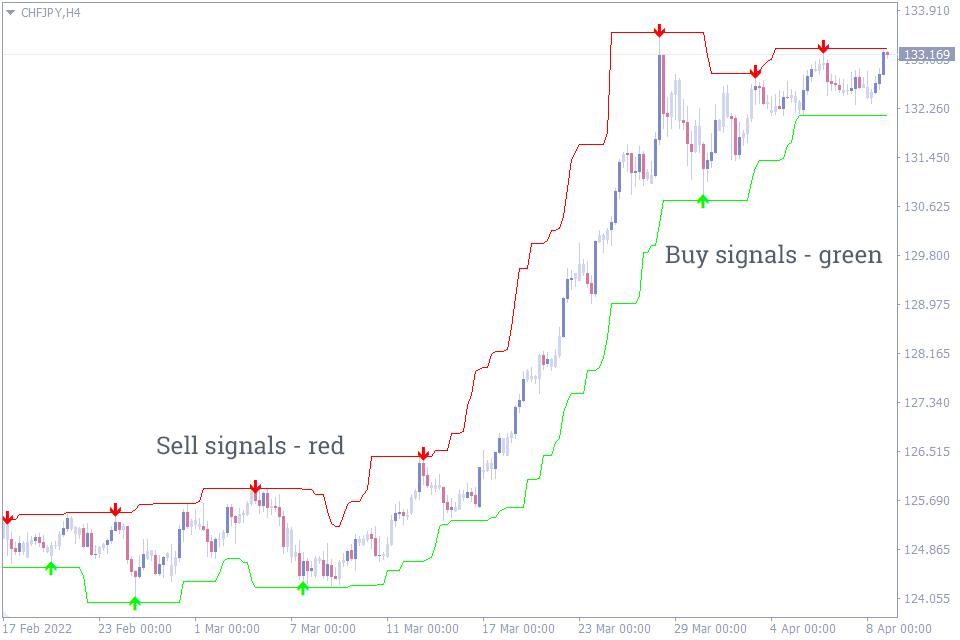
EntryExit-Trend Indicator uses ATR to print its entry and exit points. The indicator combines a trendline with an arrow, allowing traders to easily decipher the market trend and the entry/exit points. This ease of use makes it adaptable for beginners wanting to increase their market edge.
Many traders also use other tools to confluence this indicator before trading. However, because the indicator is newly introduced, it is advisable to backtest it with your chosen pairs and timeframes.
#20 MSP Indicator
Number of Downloads: 1.0k
Score: 3/5
Timeframes: All
Repaints: Yes
Alerts: Yes
Signal Frequency: 3 – 8 Per Day
It automatically analyzes the market with the inbuilt average true range (ATR) in the background plus other parameters and displays a BUY or SELL signal accordingly. Although the MSP indicator uses data from other tools like Support, Resistance, Trendline, or even market weakness at a particular zone, it majorly displays its signal after analyzing the ATR of the market for the traded pair.
The indicator is mainly used to catch a reversal trade from the beginning of the move. Using a complete tool like this adds a layer of confidence to your trading system, decreases the time you spend on the chart, and potentially makes you more profitable.
Bottom Line
There you go! From our classic Stop Loss Cluster (SLC) Indicator to the Profit Ratio indicator and everything in between, you don’t have to stay glued to the charts again.
These custom indicators have been around for several years and are going nowhere soon. Let them do the heavy analysis for you so that you can focus on managing risk and increasing your profit.
Depending on the indicator you try, you might have to combine them with other technical tools like support and resistance, trendlines, or other custom indicators. However, ensure you do your due diligence to backtest as much as possible before you commit your real cash to use them in live trades.


Comments (2)
Awesome! Its genuinely remarkable post, I have got much clear idea regarding from this post
I just like the helpful information you provide in your articles