

The Best Candle Patterns for Forex
Description of Candlestick Patterns
Candlestick patterns are a fundamental tool in technical analysis, employed by traders and investors to decipher the sentiments and potential future price movements within financial markets. These patterns are formed by the individual price bars on a chart, revealing critical information about the battle between bulls (buyers) and bears (sellers).
To understand candlestick patterns, it’s essential to dissect the anatomy of a candlestick.
Body of a Candle: The rectangular area between the open and close prices of a trading session is known as the candlestick’s body. If the close is higher than the open, the body is usually filled or colored green, signifying a bullish sentiment. Conversely, if the close is lower than the open, the body is typically hollow or colored red, indicating a bearish sentiment.
Upper Shadow: The thin line extending above the body represents the high price of the session. It demonstrates the highest level reached before sellers pushed the price back down.
Lower Shadow: Conversely, the thin line extending below the body signifies the session’s low price. It reflects the lowest point the price touched before buyers stepped in.
Table of Content – Bullish and Bearish Candlestick Patterns
Candlestick patterns come in various forms, each offering valuable insights into market psychology. Here are some of the most prominent bullish and bearish candlestick patterns:
- Doji (Basic Sentiment)
- Marubozu (Basic Sentiment)
- Hammer / Hanging Man (reversal)
- Inverted Hammer / Shooting Star (reversal)
- Harami (reversal)
- Engulfing (reversal)
- Hikkake (reversal)
- Three White Soldiers / Three Black Crows (reversal)
- Morning Star / Evening Star (reversal)
- Piercing Line / Dark Cloud Cover (reversal)
#1. Doji (Basic Sentiment)
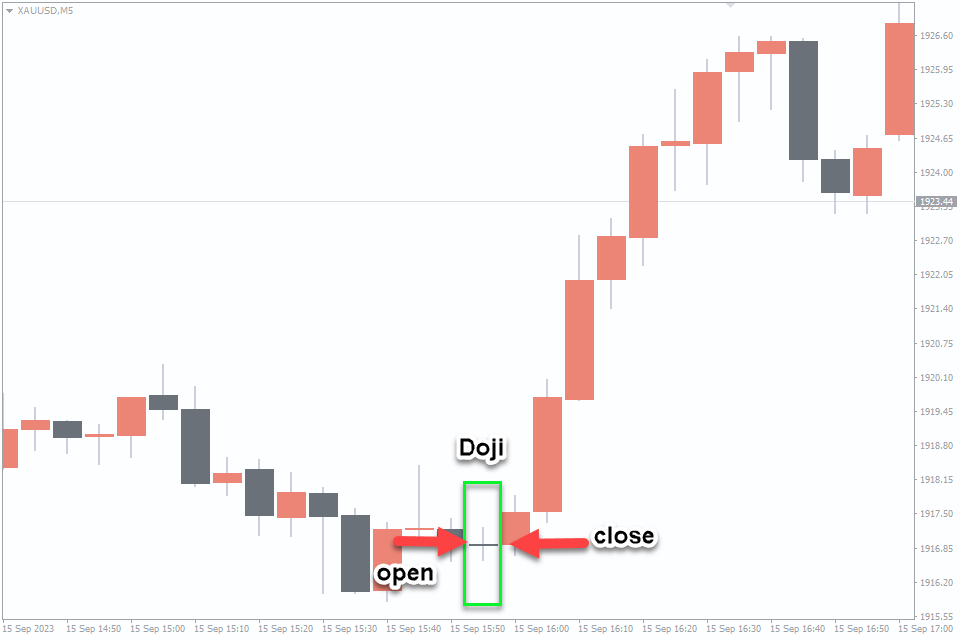
The Doji candlestick pattern signifies market indecision and potential reversals. It’s characterized by a small body, indicating the opening and closing prices are nearly equal. It can be:
Neutral Doji: Signifying indecision without a clear bullish or bearish bias.
Long-legged Doji: Reflecting even greater uncertainty, often occurring at key support or resistance levels.
Trading Strategy
Bullish Reversal: After a downtrend, a Doji can signal a potential bullish reversal. Consider a long (buy) trade if the price confirms by moving higher after the Doji, placing a stop-loss below its low.
Bearish Reversal: After an uptrend, a Doji may indicate a possible bearish reversal. Contemplate a short (sell) trade if the price confirms the reversal by moving lower, setting a stop-loss above the Doji’s high.
#2. Marubozu (Basic Sentiment)
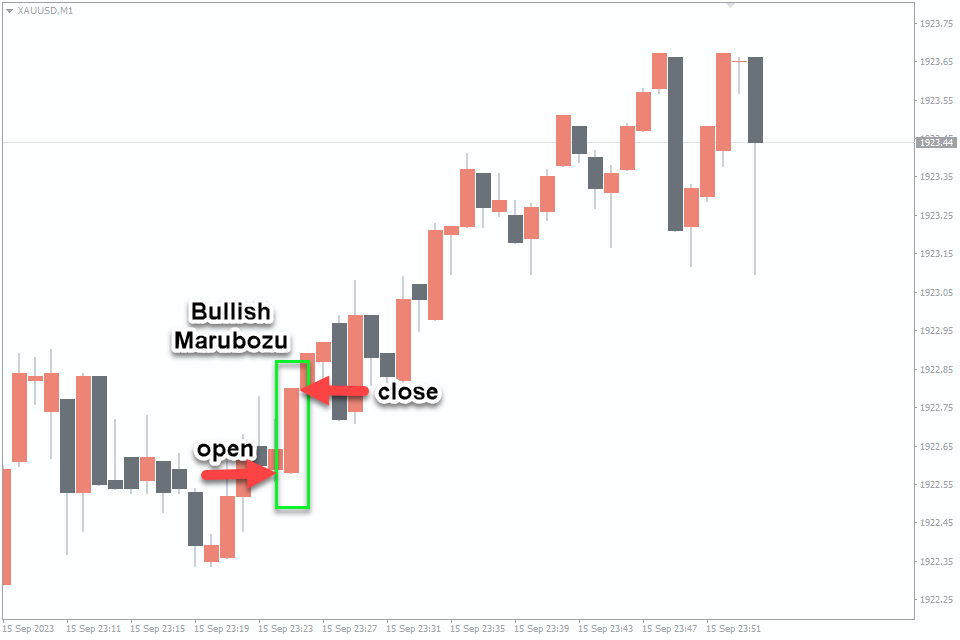
The Marubozu candlestick pattern represents extreme bullish or bearish sentiment with no shadows. These patterns represent strong market sentiment.
Bullish Marubozu: A full candle body with no shadows at the top or bottom signifies strong bullish sentiment. It suggests buyers dominated the entire session.
Bearish Marubozu: Similar to the bullish version, but it indicates intense bearish sentiment as sellers controlled the session.
Trading Strategy
Bullish Marubozu: Consider initiating a long (buy) position, entering above the pattern’s high, and placing a stop-loss below its low.
Bearish Marubozu: Ponder a short (sell) trade, entering below the low of the pattern, with a stop-loss above its high.
#3. Hammer / Hanging Man (reversal)
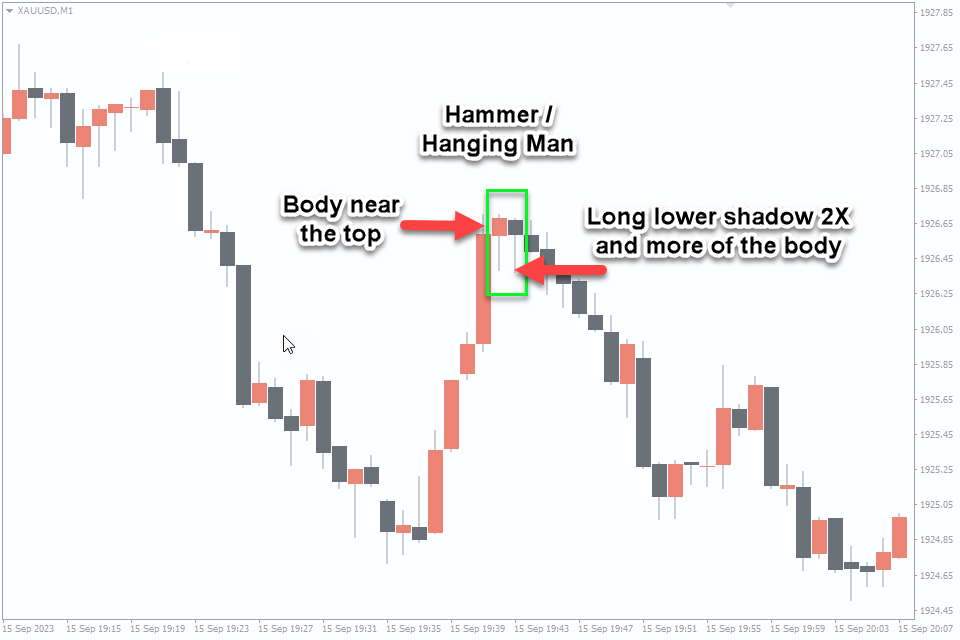
The Hammer and Hanging Man candlestick patterns are potent reversal signals.
Hammer (Bullish Reversal): This pattern forms after a downtrend, with a small body near the high and a long lower shadow. It suggests a potential shift from bearish to bullish sentiment.
Hanging Man (Bearish Reversal): Occurring after an uptrend, the Hanging Man has a small body near the low and an extended upper shadow. It hints at a possible change from bullish to bearish momentum.
Trading Strategy
Hammer: Consider a long (buy) position when you spot a Hammer. Enter above the high of the Hammer, with a stop-loss below its low.
Hanging Man: For a Hanging Man, think about a short (sell) trade. Enter below the low of the Hanging Man, with a stop-loss above its high.
#4. Inverted Hammer / Shooting Star (reversal)
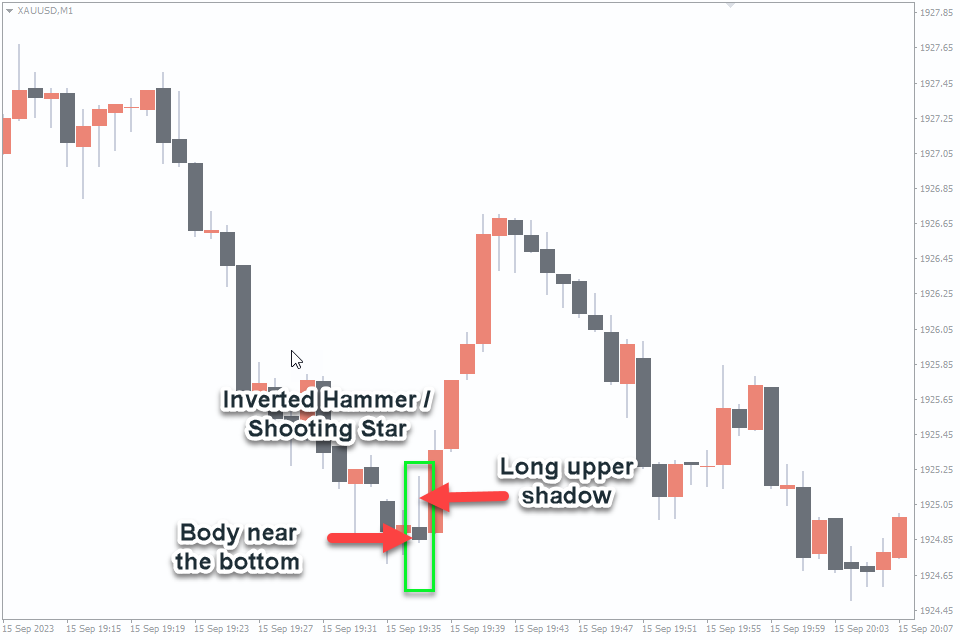
The Inverted Hammer and Shooting Star candlestick patterns provide vital reversal signals.
Inverted Hammer (Bullish Reversal): Forming after a downtrend, it has a small body near the high and a long upper shadow. This suggests a potential shift from bearish to bullish sentiment.
Shooting Star (Bearish Reversal): Occurring after an uptrend, the Shooting Star boasts a small body near the low and a lengthy upper shadow. It hints at a possible change from bullish to bearish momentum.
Trading Strategy
Inverted Hammer: Contemplate a long (buy) position when an Inverted Hammer appears. Enter above its high, placing a stop-loss below its low.
Shooting Star: For a Shooting Star, consider a short (sell) trade. Enter below its low, with a stop-loss above its high.
#5. Harami (reversal)
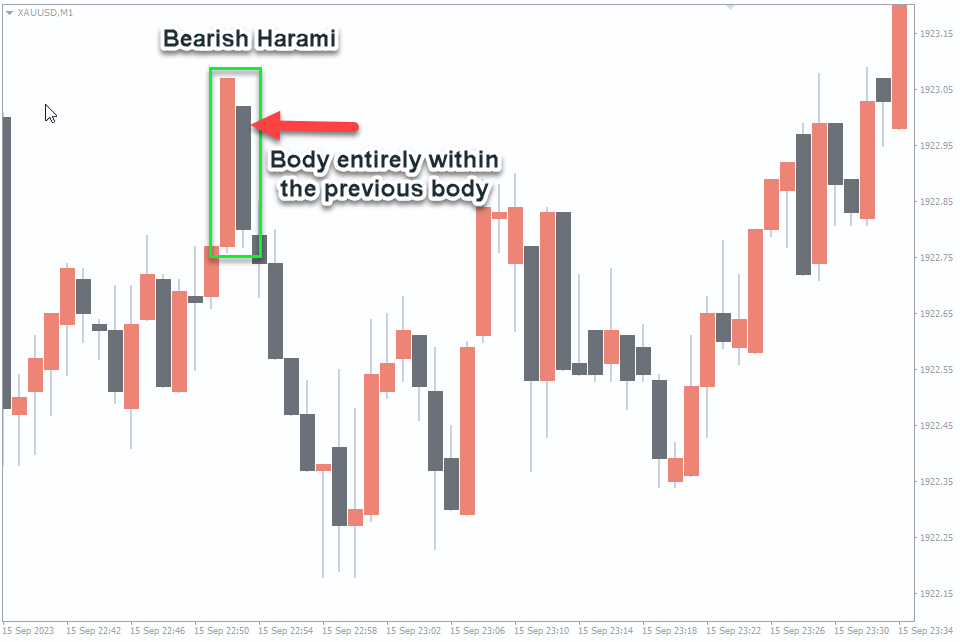
The term “Harami” means “pregnant” in Japanese. Picture the first candle as the mother and the second as the baby.
In a bullish Harami, the first candle closes lower than it opens, and the second closes higher. For a bearish Harami, it’s the opposite.
What does this mean? It suggests a potential reversal in the market, although it’s a weaker signal compared to patterns like Engulfing.
Trading Strategy
Bullish Reversal (Bullish Harami): In a downtrend, a small bullish (green or white) candle is followed by a larger bearish (red or black) candle. This signals a potential shift to an uptrend. Consider a long (buy) trade if the price confirms by moving higher after the Harami pattern, placing a stop-loss below the pattern.
Bearish Reversal (Bearish Harami): In an uptrend, a small bearish candle is followed by a larger bullish candle. This suggests a possible change to a downtrend. Think about a short (sell) trade if the price confirms by moving lower after the Harami pattern, setting a stop-loss above the pattern.
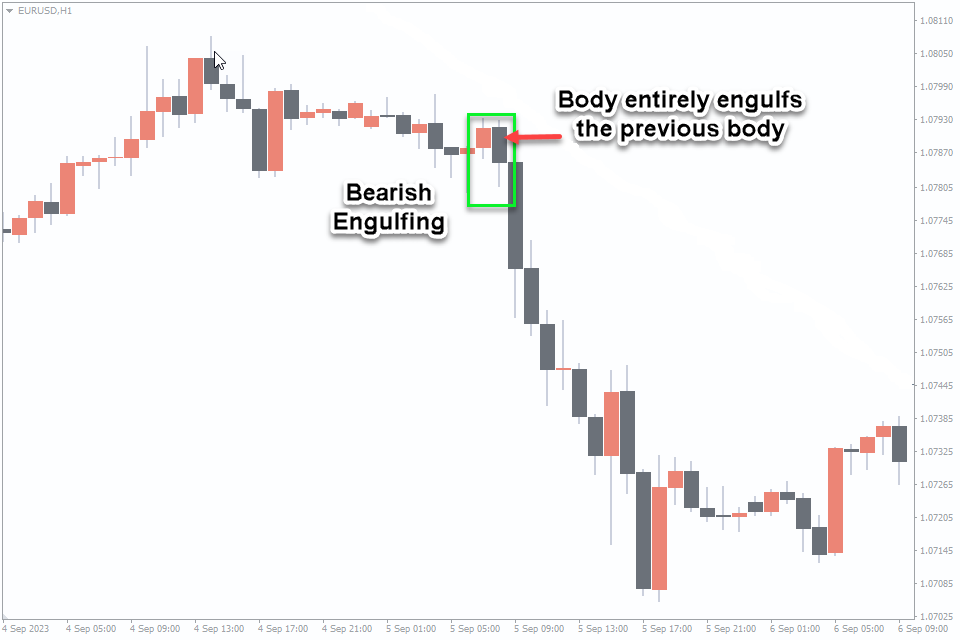
#6. Engulfing (reversal)
The Engulfing candlestick pattern is a potent signal of a significant shift in market sentiment. It suggests that the prevailing trend is about to reverse. There are two types of Engulfing patterns:
Bullish Engulfing: This pattern forms after a downtrend and indicates a potential reversal to an uptrend. It starts with a smaller bearish candle followed by a larger bullish candle that completely engulfs the previous one. This signals that buying pressure has overwhelmed selling pressure.
Bearish Engulfing: Conversely, a bearish Engulfing pattern emerges after an uptrend and suggests a possible shift to a downtrend. It commences with a smaller bullish candle followed by a larger bearish candle that engulfs the preceding one. This implies that selling pressure has surpassed buying pressure.
Trading Strategy
Bullish Engulfing: Wait for a clear downtrend, then enter a long (buy) position when the bullish candle closes. Set a stop-loss below the bearish candle’s low.
Bearish Engulfing: Wait for an established uptrend, then enter a short (sell) position when the bearish candle closes. Set a stop-loss above the bullish candle’s high.
Confirmation: Consider using other indicators or price action signals to confirm Engulfing patterns and reduce false signals.
#7. Hikkake (reversal)
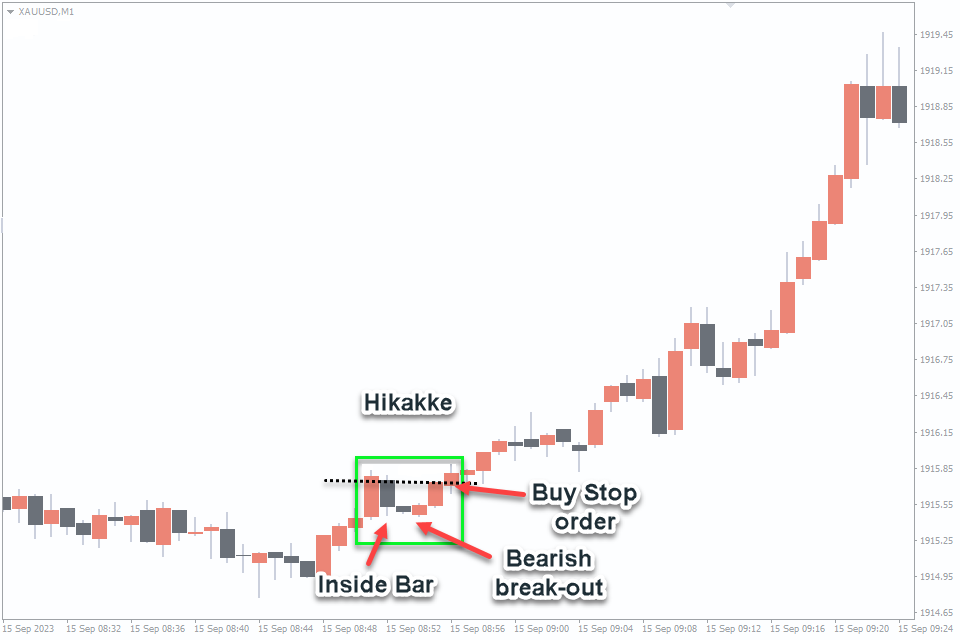
The Hikkake candlestick pattern signals potential trend reversals, and it comes in two forms:
Bullish Hikkake: This pattern suggests a possible shift from bearish to bullish sentiment.
Look for a bearish candle followed by a smaller inside candle with a higher low and lower high.
Consider a long (buy) position if the subsequent candle breaks the high of the inside candle.
Bearish Hikkake: This version indicates a potential change from bullish to bearish sentiment.
Spot a bullish candle followed by a smaller inside candle with a lower low and higher high.
Ponder a short (sell) position if the following candle breaks the low of the inside candle.
Trading Strategy
Rules for Long Setups: Look for an inside bar. Observe the following bar with a lower high and a lower low, signaling a bearish breakout of the inside bar. Set a buy stop order at the high of the inside bar. If the order is not triggered after three bars, cancel it.
Rules for Short Setups: Identify an inside bar. Watch for the next bar to have a higher high and a higher low, indicating a bullish breakout of the inside bar. Place a sell stop order at the low of the inside bar. If the order is not triggered after three bars, cancel it.
#8. Three White Soldiers / Three Black Crows (reversal)
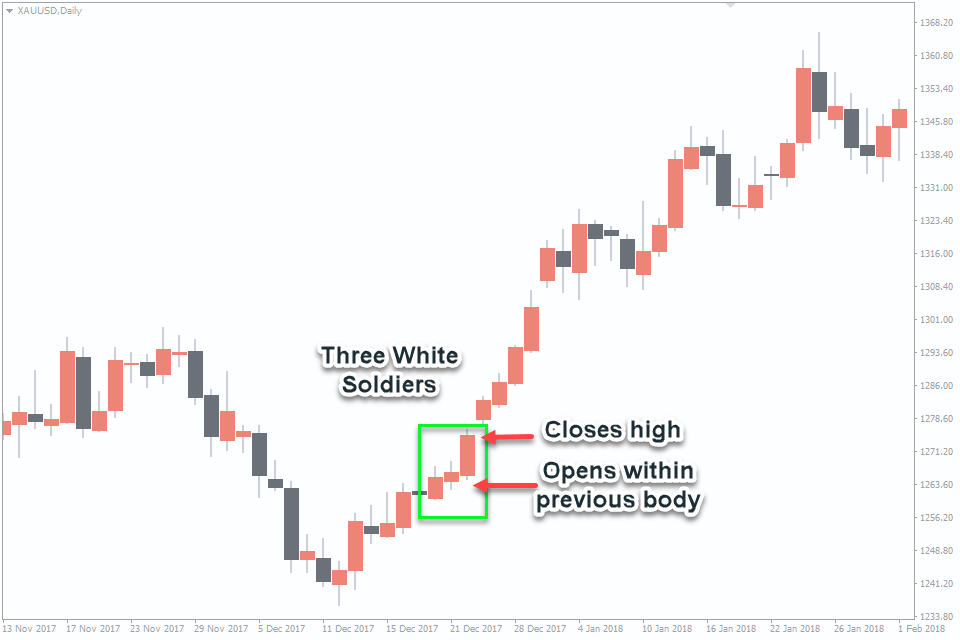
Three White Soldiers is a bullish candlestick pattern. It consists of three consecutive long white (or green) candles with small or no shadows. This pattern suggests a strong reversal of the previous downtrend, indicating increasing buying pressure.
Three Black Crows, on the other hand, is a bearish pattern. It comprises three consecutive long black (or red) candles with small or no shadows. This pattern signals a robust reversal of an uptrend, indicating growing selling pressure.
Trading Strategy
Trading Three White Soldiers: Identify a downtrend. Wait for the appearance of the Three White Soldiers pattern, signaling a potential reversal. Consider entering a long (buy) position at the open of the next candle after the pattern. Place a stop-loss order below the lowest point of the pattern for risk management.
Trading Three Black Crows: Look for an uptrend. When the Three Black Crows pattern emerges, it suggests a possible trend reversal. Think about initiating a short (sell) trade at the open of the next candle following the pattern. Set a stop-loss order above the highest point of the pattern to manage risk.
#9. Morning Star / Evening Star (reversal)
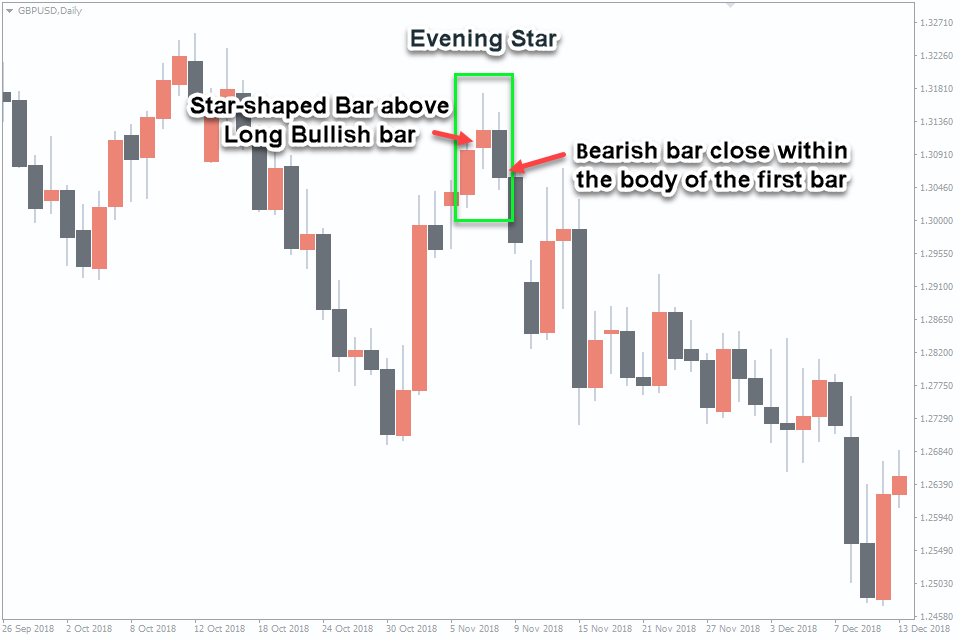
Both Morning Stars and Evening Stars are composed of three bars. In candlestick terminology, a “star” indicates a candlestick featuring a small body that doesn’t overlap with the body of the preceding candle. This non-overlapping characteristic inherently involves a Gap between candle bodies. Consequently, it’s relatively rare to spot Morning Stars and Evening Stars on intraday charts.
A Morning Star takes the following form (in sequence): A long bearish candlestick. A star-shaped candle beneath it, which could be either bullish or bearish. A bullish candlestick concluding within the body of the first candlestick.
On the other hand, an Evening Star unfolds as follows (in sequence): A long bullish candlestick.
A star-shaped candle above it, which could be either bullish or bearish. A bearish candlestick concluding within the body of the first candlestick.
Trading Strategy
Trading Morning Star: Identify a prevailing downtrend. Look for the Morning Star pattern as a potential reversal signal. Consider entering a long (buy) trade at the open of the candle following the bullish candle in the pattern. Place a stop-loss order below the lowest point of the Morning Star pattern for risk management.
Trading Evening Star: Recognize an ongoing uptrend. When the Evening Star pattern emerges, it suggests a potential trend reversal. Think about initiating a short (sell) trade at the open of the candle following the bearish candle in the pattern. Set a stop-loss order above the highest point of the Evening Star pattern to manage risk. While these patterns can provide valuable reversal signals, traders often use them in conjunction with other technical indicators and analysis to make well-informed trading decisions.
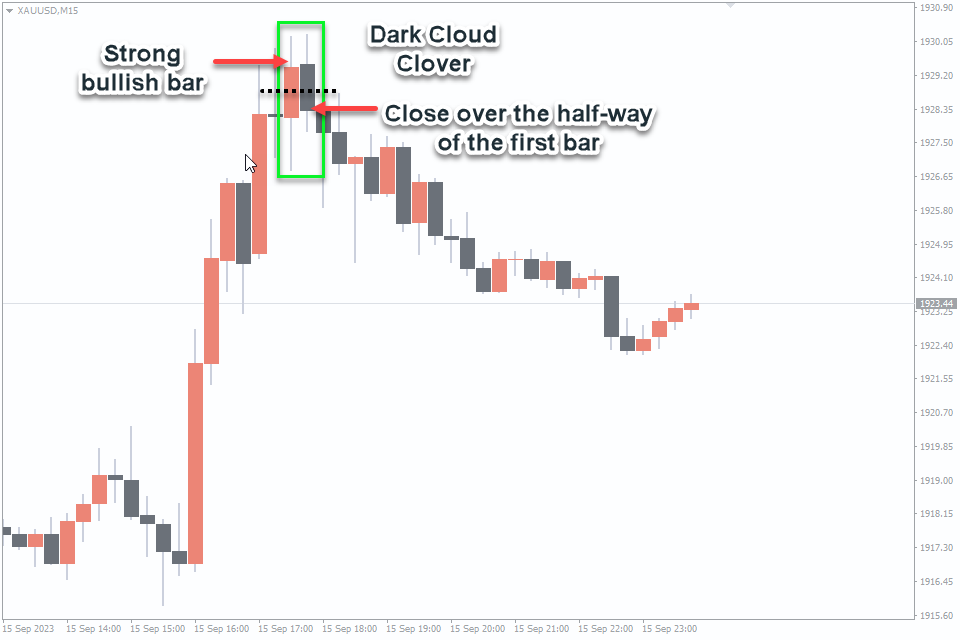
#10. Piercing Line / Dark Cloud Cover (reversal)
The Piercing Line and Dark Cloud Cover are candlestick patterns that provide insights into potential reversals in market sentiment.
Piercing Line: This bullish reversal pattern consists of two candlesticks. The first is a long bearish candle, followed by a second bullish candle that opens below the low of the first candle but closes deeply into its body. This suggests a possible shift from bearish to bullish sentiment.
Dark Cloud Cover: In contrast, the Dark Cloud Cover is a bearish reversal pattern. It also involves two candlesticks. The first is a long bullish candle, followed by a second bearish candle that opens above the high of the first candle but closes well into its body. This hints at a potential shift from bullish to bearish sentiment.
Trading Strategy
Piercing Line (Bullish): Consider entering a long (buy) trade after identifying a Piercing Line pattern. Place the trade at the open of the candle following the bullish one. Set a stop-loss below the low of the bullish candle and a take-profit target based on your risk-reward ratio.
Dark Cloud Cover (Bearish): When you spot a Dark Cloud Cover, contemplate initiating a short (sell) trade. Enter at the open of the candle following the bearish one, and set a stop-loss above the high of the bullish candle. Establish a take-profit target that aligns with your risk-reward ratio.
Conclusion
In conclusion, candlestick patterns are invaluable tools in the arsenal of every technical trader. These patterns provide a visual representation of market sentiment, allowing traders to gauge potential reversals or continuations in price trends. From the simplicity of the Doji to the power of the Three White Soldiers, each pattern tells a unique story about market dynamics. To enhance your convenience, there are freely available indicators that can be utilized and downloaded for MT4/5. These indicators are designed to automatically identify candle patterns and provide you with timely notifications about them:
By integrating candlestick pattern indicators with complementary tools like (Auto TrendLine Indicator, FXSSI.ProfitRatio, Lucky Reversal Indicator, Buy Sell Magic Indicator and/or others), you have the opportunity to construct a personalized trading strategy, consequently boosting your potential for profitability within the Forex market. Additionally, integrating various technical analysis patterns such as head and shoulders and double tops into your trading toolkit can significantly contribute to achieving success in your trading endeavors. And also, don’t forget to incorporate effective risk management strategies.
As you delve deeper into the world of candlestick patterns, practice and experience will refine your ability to spot these formations and apply them effectively. Whether you’re a day trader, swing trader, or long-term investor, incorporating candlestick patterns into your trading toolbox can enhance your understanding of market behavior and potentially lead to more profitable outcomes. So, keep studying, keep practicing, and may your trading journey be illuminated by the wisdom of these ancient yet ever-relevant patterns.


Comment (1)
Nice one. I like using the engulfing candles for entry confirmation..