
The Best Indicators For Swing Trading
Swing traders mostly rely on technical analysis tools, such as indicators, to make their analyses. But of the many indicators out there, here are some of the best for swing traders.
RSI Divergence Indicator
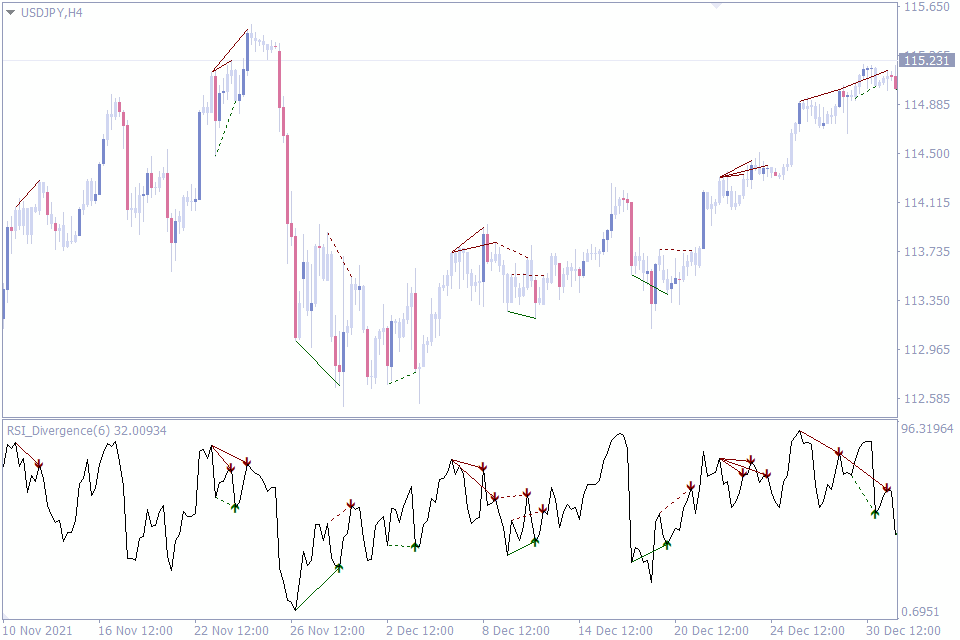
This indicator is based on the original RSI indicator, as the name suggests. But it’s not just another RSI indicator. Instead, it picks one of the most commonly used features of its base indicator, the RSI divergence, and develops signals based on it.
The RSI divergence indicator – one of the best indicators for swing trading. It helps you spot where the direction of the price diverges from the direction of the indicator lines. These points of diversion often lead to reversals, which swing traders can hope to profit from. A bullish divergence is a buy signal, while the bearish signal is a bearish signal.
While spotting divergences on the normal RSI indicator can be quite difficult for the untrained trader, the RSI divergence indicator marks out the divergence points for easy identification. This divergence indicator even makes use of arrows to predict the next move.
Another benefit that sets the RSI Divergence indicator apart for the swing trader is how it gives a lot of signals. Although traders don’t have to trade them all, it, however, offers the trader multiple opportunities to make trades.
Pros
- Novice traders will find it easy to use.
- It is comprehensive.
- Uses visuals to mark entry points.
- It is perfect for swing traders who want to get into reversals early.
- Gives many signals.
MACD Divergence Indicator
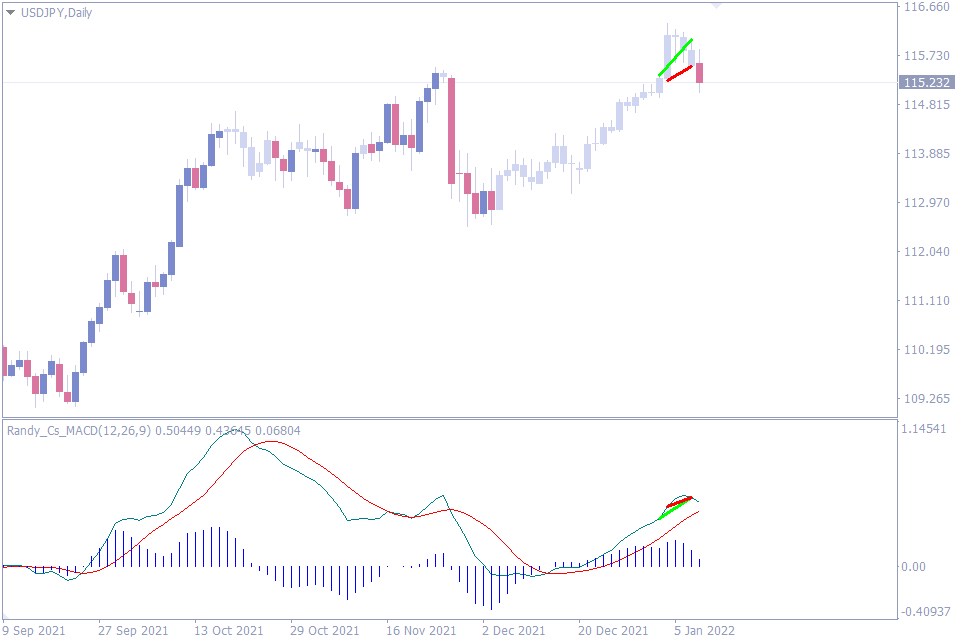
The MACD divergence indicator is another indicator that is based on a popular indicator, the MACD indicator.
One of the most popular uses of the MACD indicator is to help spot divergence points where the price direction goes against the indicator’s exponential moving average lines. These divergence points are often used to trade reversals.
For novice traders who are not familiar with spotting these divergence points on the normal MACD indicator, this indicator is very helpful.
When the bullish divergence appears on the divergence indicator, this is often followed by a reversal to a bullish trend. The bearish divergence, on the other hand, is a harbinger of bearish reversal.
What makes the MACD divergence indicator perfect for swing trading is that it is ideal for the daily timeframe. The only downside to this indicator, however, is that it only shows the MACD divergence for the most recent price. This means you can’t backtest to see how well it works. The only way to test it is to practice using it on your demo account
Pros
- Easy to understand.
- Helps novice swing traders identify divergences easily.
MA Rainbow Indicator
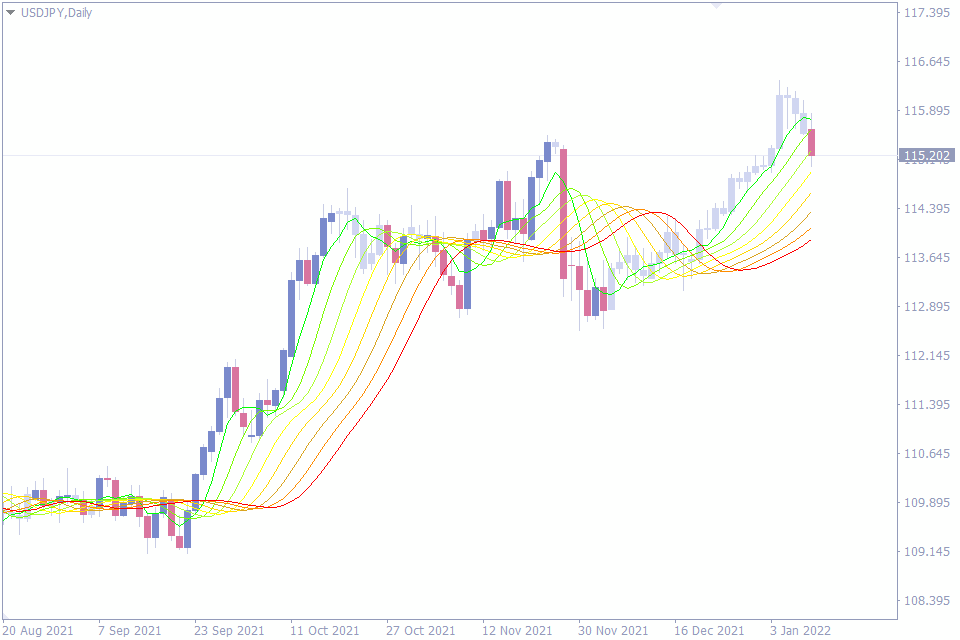
The moving average indicator is one of the simplest indicators out there. It is merely a single line drawn on your chart that curves in response to the price.
Despite its simplicity, however, many traders use the MA singly and in combination with other indicators to generate signals. The MA rainbow indicator is just another one of such uses.
The MA rainbow indicator is nothing but a set of eight moving averages. But their uses span from helping to determine market trends to measuring the strength of the trend. Besides that, this indicator can also generate entry and exit positions. The first four moving averages from the Lime colored MA are the bullish MAs and the last four are the MAs.
Perhaps, the best thing about this indicator is that it is perfect for novice and advanced indicators. Novice indicators can easily extract trade entries, trade exits, and stop losses, from this single indicator. Advanced traders can do the same, but they can also incorporate it into their trading systems.
The only potential disadvantage of this indicator is that it lags. And to be fair, this disadvantage is nothing it can help. The MA rainbow comprises 8 different moving averages. The indicator lays each indicator side by side, making it quite wide. So, it may take some time before the price makes it from one end of the moving averages to the other.
However, you can edit the settings to lessen the gap between the moving averages.
Pros
- Very easy to use for novice traders.
- Can be used for trade entries, trade exits, and stop losses.
- Advanced traders can fit the indicator into their trading systems.
Better Volume New Alerts Indicator
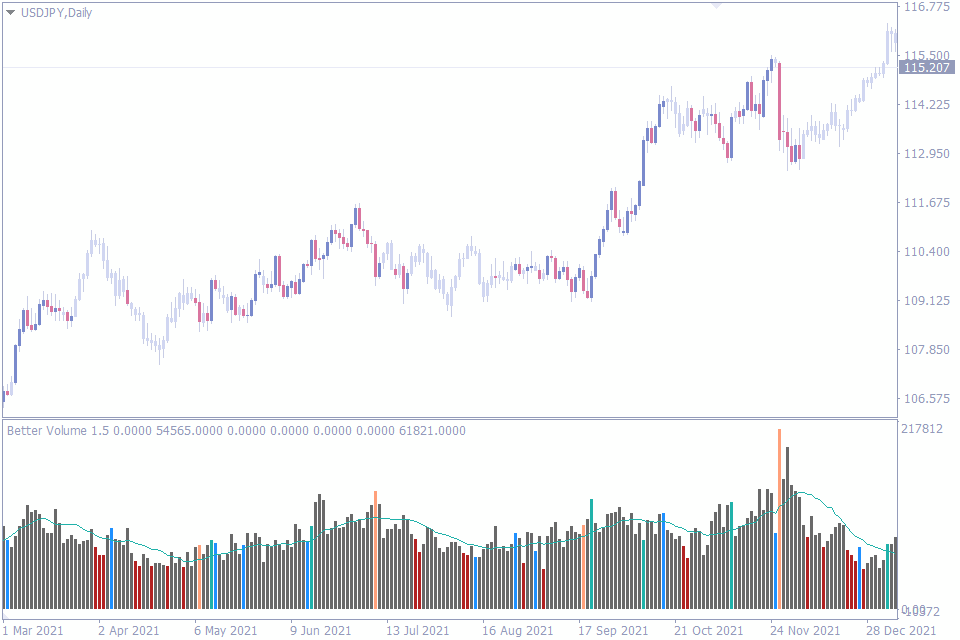
Another best indicator for swing trading – Better Volume New Alerts Indicator. The volume indicator is one of the must-have indicators for any forex trader. And the Better Volume News Alerts indicator is one of the best for swing traders because of its various potential use cases.
The better volume indicator differs from the traditional volume indicator in the range of colors it has. While the traditional volume indicator makes use of just two colors to signify bullish and bearish volumes, the Better Volume indicator has more colors to signify various market conditions.
On the indicator, white is for when there’s nothing spectacular happening on the chart. It also has colors for when the volume is gradually increasing (blue) or decreasing (red). The last pair of colors, turquoise and peach, are for when there is a huge bullish or bearish spike in volume, respectively.
The benefit of these colors is that the better volume news alerts indicator is useful when determining market trends. And swing traders will find it to be useful, as they can confirm trends and potential reversals with it.
Besides this benefit, the better volume indicator shares the features and benefits of the traditional volume indicator. For instance, it can be used to assess the probability of trade setups. It can also get you out of fakeouts from supports and resistance levels.
Pros
- With a wide range of colors, the better volume predicts market trends. This is something other volume indicators struggle with.
- It helps to assess the probability of trade setups.
VWAP Bands Indicator
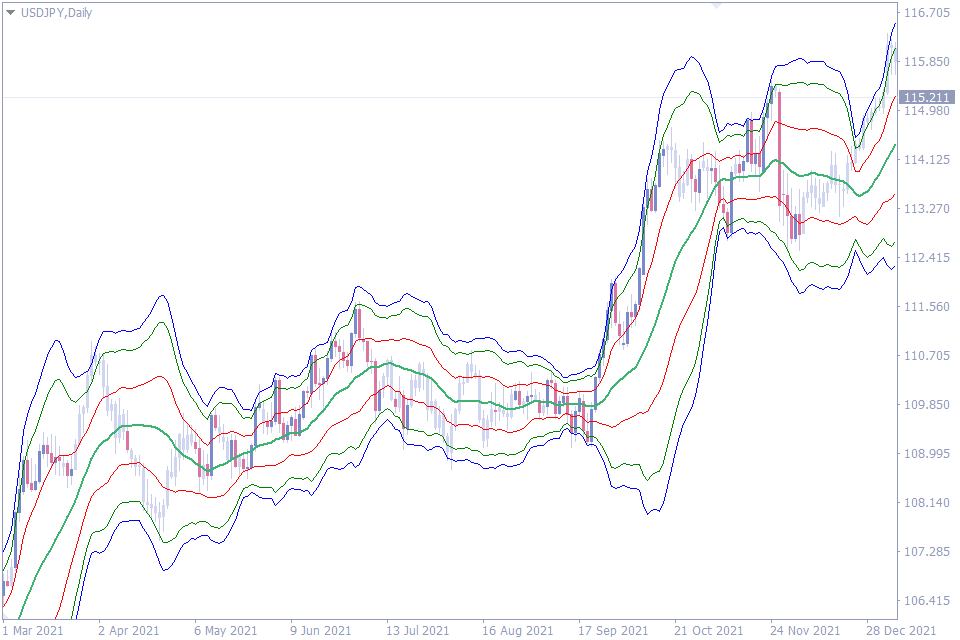
The Volume Weighted Average Price indicator is another innovative way in which the moving average can be deployed. Here, the moving averages are weighted moving averages. And they are structured in such a way that they form bands that surround the price.
The VWAP bands indicator has quite a number of uses. One of them is that the indicator is ideal for spotting potential reversal points on the chart. Swing traders would enjoy this benefit as trend trading is what they do.
Another use swing traders can put the indicator to is to enter trends that have already been established. Because of the nature of swing trading, traders make use of the daily charts and higher. And it may take a while for the trend to conclude and a new trend starts. But thanks to this use of the VWAP indicator, traders can know when to get into established trades. This benefit might be a favorite of swing traders who use this indicator.
One more thing that the VWAP indicator does well is that it works well as dynamic support and resistance levels. Price is often headed for the top of the band during an uptrend and the bottom of the band is the target in a downtrend. This strategy plays out best during a consolidation.
Pros
- Works in various market conditions, including trend continuation, trend reversal, and consolidation.
- Can be used to determine entry and exit points.
Conclusion
Although those are some of the the Best Indicators For Swing Trading, the effectiveness of each depends on the trader using them. The best way to use the best indicators for swing trading is to use them in confluence with other similar indicators.


Leave a Reply