
Best Volume Indicators For Forex Traders
The best volume indicators are a gem to have as you make your technical trade analysis in forex.
This article is dedicated to showing you some of them. Many professional forex traders never make a trade without consulting a volume indicator. The reason is that most trend indicators merely give you entry and exit signals. But not all signals are true.
Relying solely on trend indicators may cause you to get into more losses. This is where a volume indicator comes in handy.
With a volume indicator, you can filter out signals with a higher probability from others.
Table of Content
- Better Volume 1.5
- Volume Profile Indicator
- VWAP Plus Indicator
- Tick Volume Indicator
- OBV Divergence Indicator
- Market Facilitation Index
- Buy-Sell Volume Indicator
- Weis Wave Indicator
- Percentage Volume Oscillator
Without further ado, let’s head into why we think these Volume indicators stand out from the rest.
1. Better Volume Version 1.5
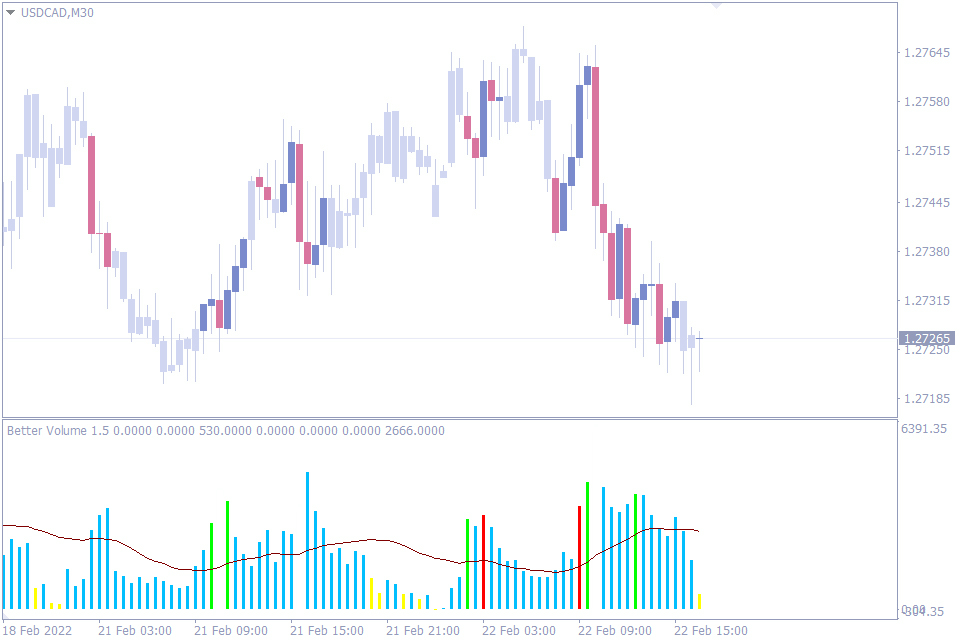
The Better Volume 1.5 indicator is based on the classic volume indicator that comes with the Metatrader 4 trading platform (MT4). And just like its source indicator, it makes use of bars that measure how much the price has moved in a period.
This indicator differs from its source indicator in that it gives more information about the instrument being traded than the source indicator. Better Volume makes use of colors that have distinct interpretations to help forex traders make more sense of what the forex market is doing.
Another standout feature of the better volume indicator is that it displays a moving average over the volume bars. This gives you an additional tool from which to draw information.
Perhaps, the best way to use the better volume indicator is as the developer intends it to be used. That is, by sticking to the color codes. Blue bars represent the average market condition. The red bar signifies a strong bullish signal while white is a strong bearish signal.
Yellow pops up when there is very low trading volume, and green when there is a somewhat increased attention on the currency pair by traders. Putting these together helps you know the best time to be in and out of any trade, and that is why the Better Volume indicator ranks on our list of the best Volume indicators for forex traders.
Another indicator, Better Volume News Alerts indicator, is similar to the better volume indicator we describe here. The only distinction is the difference in colors. What the Better Volume colors yellow, the Better Volume News Alerts colors it brick red. Similarly, blue becomes white, white is now peach, and red and green are blue.
2. Volume Profile Indicator
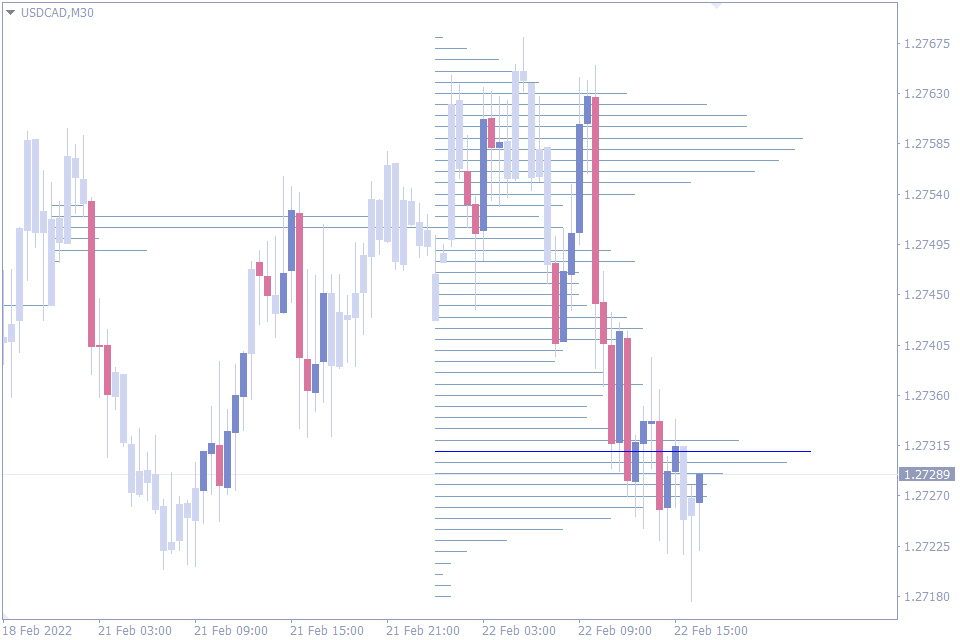
The Volume profile indicator appears on your chart as a series of horizontal lines that extend to the right once you install it on your MT4. The main idea behind this indicator is to help traders observe potential areas of high price action activity. But that’s not where the usefulness of this indicator ends.
Traders may have better results when they use the Volume profile indicator to spot potential reversals or dynamic and short-term support and resistance zones. You can use the lines of the indicator as support and resistance levels for that current period or the next.
When you’re using an indicator that displays on your chart screen, it is super important that it is customizable so that it doesn’t interfere with other pieces of information you’re trying to glean from the chart. The Volume Profile indicator does just that. It allows you to customize its settings to suit your preferences without obstructing other pieces of information on the chart.
Another standout feature of this indicator is that it allows you to customize the range period of the lines. By default, the range period is 1 day, but you can edit this to a weekly, monthly, or even 15-minute basis. This feature makes it perfect for all kinds of trading styles across all timeframes.
This indicator would always give an incomplete outlook on the market when you use it in isolation. The best way to use this indicator is by combining it with some other forex technical analysis tools. For instance, you can gain more accuracy when you combine the Volume Profile indicator with price action knowledge.
3. VWAP Plus Indicator
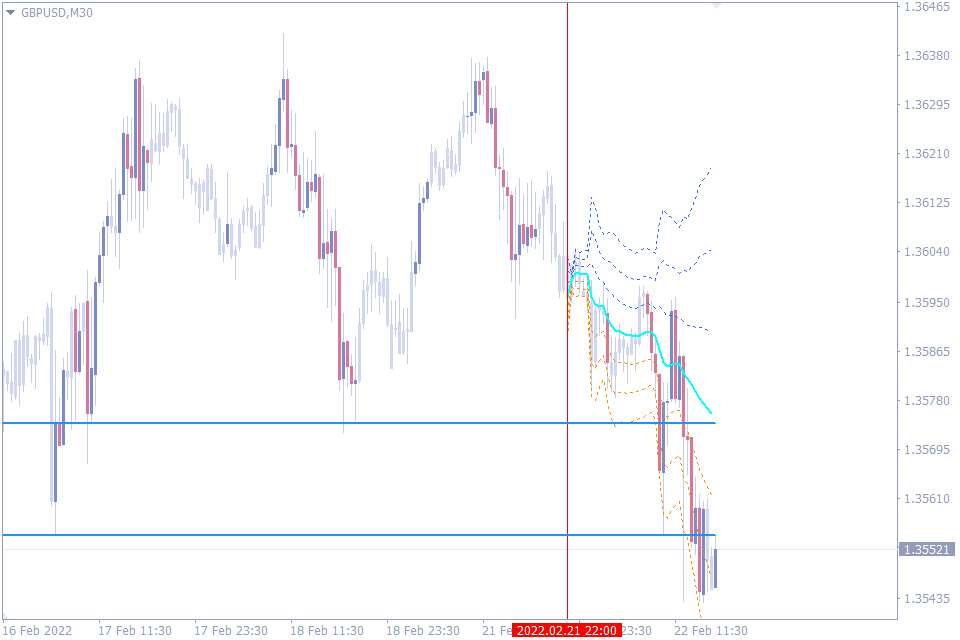
The VWAP plus indicator is one of those few indicators that combine volume with trend signals. VWAP stands for Volume Weighted Average Price, which testifies to the integral part volume plays in it. This indicator gives its signals by relying on volume to determine areas of dynamic support and resistance levels.
VWAP Plus appears on the chart as a series of lines that extend from a vertical line on the left. As soon as you install the VWAP plus indicator, advanced traders may already be able to guess that it tells zones of dynamic support and resistance.
The trading idea behind the VWAP is quite simple. The area above the aqua blue line of the VWAP is the bullish area, while the area below signifies the bearish area. And surrounding this line are yellow and white lines that signify areas of dynamic resistance and support levels, respectively. A trader may enter a trade after the price crosses this midline and take profit at any of the surrounding lines.
Another useful feature traders can always fall back to is that the VWAP plots blue horizontal lines that extend to the left of the chart. These lines can also be used as support and resistance levels, as the price tends to make reactions around these lines.
The category of traders who may enjoy the VWAP indicator best are the intraday traders.
4. Tick Volume Indicator
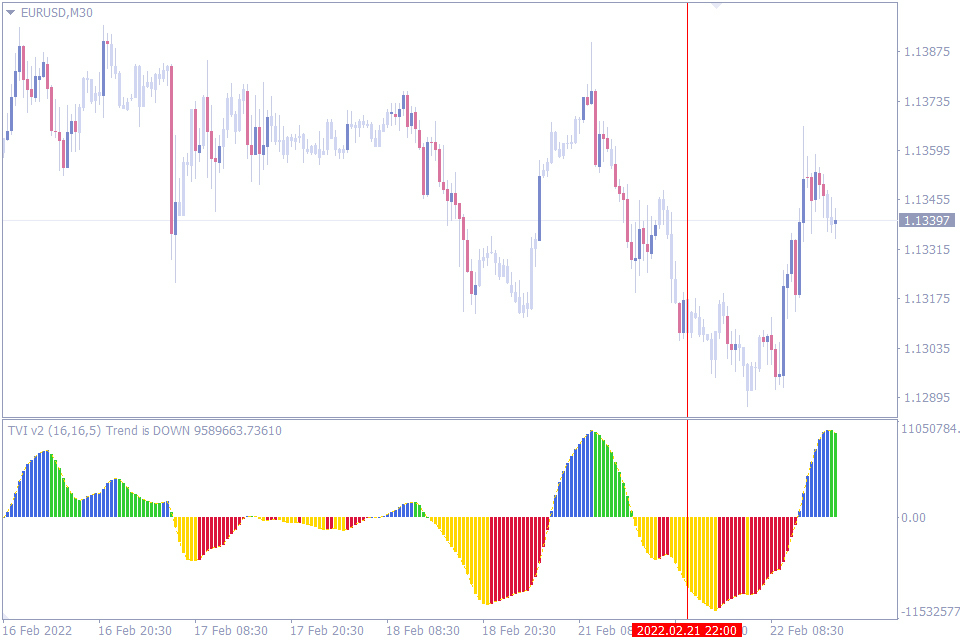
The Tick Volume indicator helps a trader determine the best time to enter a trade. It rides on the same tick per period concept that all other volume indicators in forex rely on. However, this one looks more appealing and less confusing as it uses four colors on wavelike bars to give clear predictions of market activity.
The Tick Volume indicator differs from other indicators in the way it presents its signals. It does so in such a way that its interpretations are objective and unambiguous.
For instance, the bars move in waves above and below a midpoint. These bars appear in four colors that have distinct interpretations and give trade entry signals. So, the Tick Volume indicator tells the volume while also generating automatic trade entry signals.
Because of the simplicity and unambiguity of the Tick Volume indicator, there’s hardly any better way to use it than the way it was intended for use by the developer.
The blue color signifies a rising volume in an uptrend while the green bars represent a falling volume in an uptrend. You should look to buy when the first few blue lines appear above the midline.
Similarly, the yellow bars represent rising volume on the downtrend while the red bars signify falling volume on the downtrend. Your sell orders should come in when the first few yellow bars appear.
5. OBV Divergence Indicator
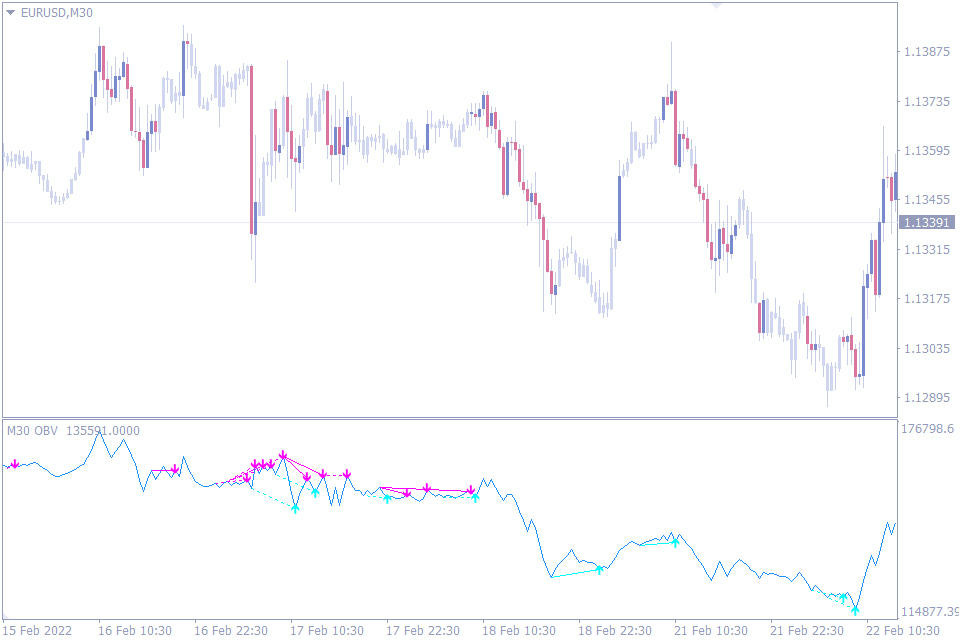 The On Balance Volume indicator is a popular indicator that most traders use to identify price momentum. A sharp momentum rise often signifies that the price may soon rise, while a sharp drop is a precursor for a drop in price level.
Another feature you can take advantage of on the OBV indicator is divergence trading. And this is where OBV divergence comes in handy.
Traders use the OBV indicator to spot areas where the price diverges from the indicator line. This is often a sign that a trend is weakening or a reversal is about to appear.
However, spotting divergences is sometimes hard for novice traders. Even professional traders miss some divergences. And when a novice trader spots a divergence, knowing what direction to make their trade can be confusing too.
But this OBV divergence indicator neutralizes these problems. It draws out divergence lines on the chart, helping you to not miss any new divergence that appears in the forex live market.
This indicator takes it a step further by attaching arrows at each divergence to tell you what to trade. This makes it easy for novice traders who still don’t know what to do when a divergence appears. They can now simply enter trades based on the arrows.
The deftness with which the OBV divergence points out its signals is what makes it rank on our shortlist of the best Volume indicators for all traders.
This indicator can have its accuracy increased by comparing it with other divergence indicators, such as the RSI divergence and Stochastic Divergence indicators.
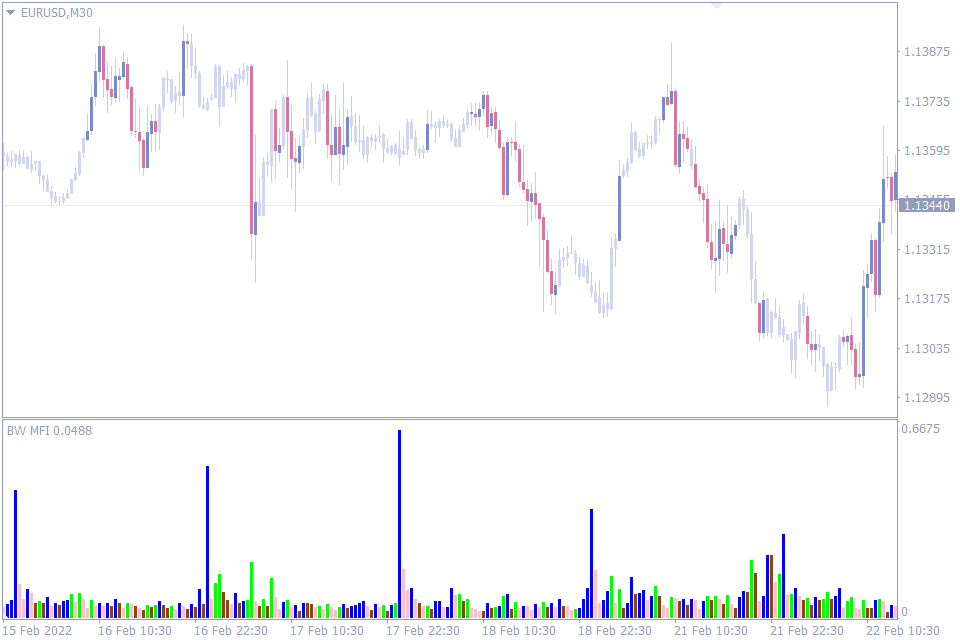
6. Market Facilitation Index Indicator
 Many forex traders rely on volumes when looking for the optimum trade entry positions, which is a good thing. The more the volume, the more volatile the pair is going to be, and the more trading opportunities there will be.
However, Bill Willaim, the developer of the Market Facilitation Index indicator argues that it is not enough to just know what the volume says. It is just as important to understand the reaction of the traders to what the volume says. The MFI indicator measures the price movement in relation to the volume.
Traders aren’t always interested in all chart signals that signify the beginning of a new trend, regardless of whatever the volume indicator says. And when this happens, it simply means that whatever trend that volume is predicting may not last long because there aren’t enough traders to see it through. And this is where the MFI shines.
The MFI indicator is one way to filter out the “bad volume,” which often leads to weak trends from the “good volume” which predicts strong trends. It also helps you know what other traders are thinking about your currency pair.
If the MFI increases with volume, for instance, this is a good sign that the trend may be strong. The MFI uses the green bar for this. The direct opposite is the brown bar which appears when both MFI and volume are dropping on a trading instrument.
The other two scenarios are when the MFI and volume are going in different directions, and the MFI represents these with white and blue bars. You should approach with caution when these bars appear.
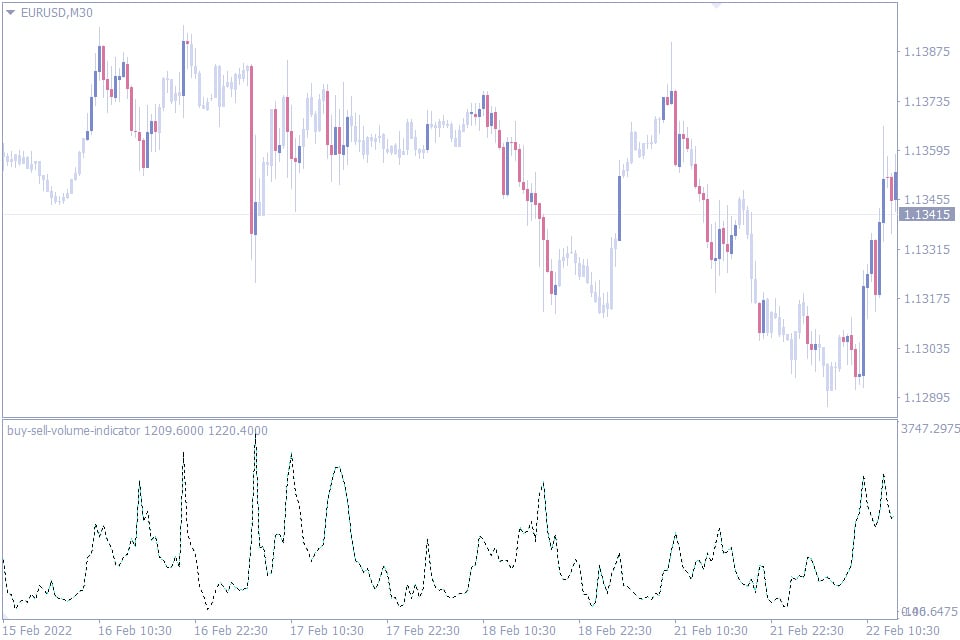
7. Buy-Sell Volume Indicator
It is easy to treat the buy-sell volume indicator as just another confusing indicator, especially of your first contact with the indicator. But when we spent some more time analyzing the indicator, we realized that there’s actually a positive to the indicator that many other volume indicators can’t boast of.
The buy-sell volume indicator uses a rising and falling wave of dotted lines to interpret the volume of the forex instrument you’re analyzing. While it doesn’t give its own buy or sell signals, it does help the trader filter out these signals so that only the most probable are left.
There are a number of ways to use the buy-sell volume indicator. Some involve making use of the rising and falling of the dotted lines to predict when there’s enough strength behind a trend.
However, one way to use this indicator that is not so popular is looking for places where a color edges out of the other color. When green edges out red on the high or rise of the indicator, buy. Sell when the red color edges out of the red in a high of the indicator.
It is easy to miss these signals, and you may even need good eyesight to spot these edges. But once you’re able to spot them, you’ll find that these edges do give signals that can be somewhat relied upon. This strategy on smaller time frames for intraday traders.
8. Weis Wave Indicator
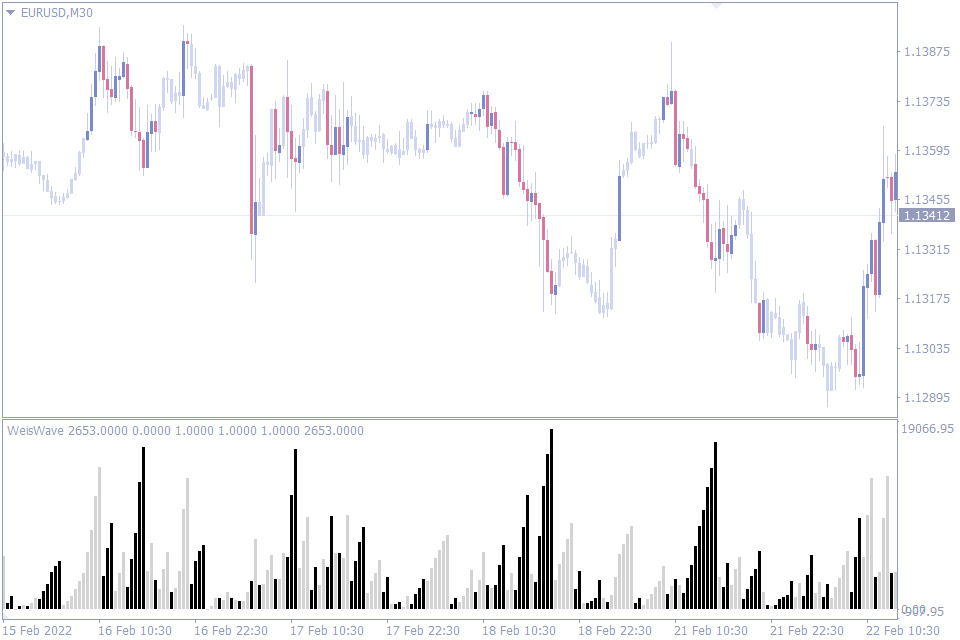
The strength of the Weiswave indicator is in the way it attempts to reproduce the efforts of traders with a series of waves of bars. Traders who know how to interpret these waves often claim that their trading is better for it.
Perhaps, one of the standout uses of the Weiswave indicator is the way it clearly signals potential reversals. When you notice that the height of each wave is shorter than the previous ones, this might be a sign that your current trend is weakening and a reversal might happen soon.
What the indicator does not do, however, is to attempt to predict the exact time the reversal is going to appear. The waves may continue to reduce in size for a while before the reversal eventually happens. So, when using this indicator to spot reversals, treat it more as a warning indicator and not an entry or exit indicator.
For instance, if you’re about to get in on a trend where the waves are shortening, you may be getting in on a dying trend.
9. Percentage Volume Oscillator
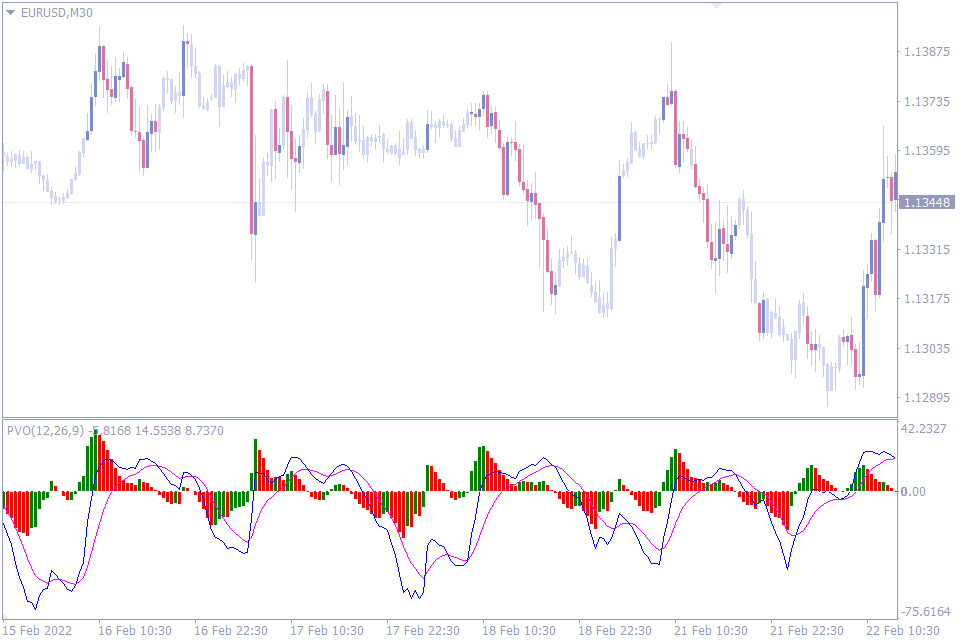
At the first glance, you may think the Percentage Volume Oscillator is the MACD, but it is not. The Percentage Volume Oscillator indicator makes use of volume as an integral part of its calculation.
This non-repaint indicator not only gives you bearish and bullish signals, but it also helps you filter out the weak trends from the strong ones.
One of the best parts of the indicator is that this: because it looks so much like the MACD, traders may find it familiar to use.
The textbook use case of this indicator is to enter a trade when the moving average lines cross each other. The bars use green and red colors to help with the filtering. So, you are looking to buy when the faster moving average crosses over the slower moving average and the bars are above the zero line and green. Similarly, you wait for the fast-moving average to cross below the slow-moving average and the bars are below the zero line and red.
While that trading strategy can be useful, another innovative way to use this indicator is to trade divergences with it. For instance, you look for where the indicator is forming higher lows when the price is forming lower lows.
The design of this indicator makes it easy for not only advanced traders but also novice traders as well. Its signals are clear and uncomplicated.
Conclusion
We’ve comes to the end of the list. But we should mention that this list isn’t by any means exhaustive. There are many more indicators out there that are just as good. But we found these to have unique features that make them some of the best Volume indicators for traders.
However, intraday raiders aren’t the only ones that can draw some honey from the beehive of these indicators. Swing traders and even stock traders may benefit from these indicators, if not for trade entry and exit signals, but for the sake of analyzing whatever reading instrument on their screen.


Leave a Reply