
The Best RSI Indicator For MT4
These are some of the best indicators to be based on the RSI and how to make the best use of them in your trading.
The RSI is an indicator that has many expert and novice forex traders relying on its signals. Some use the indicator for its overbought and oversold levels. Some others use it to tell the trend. Another instance the RSI excels at is in telling currency pair momentums.
These signals offer these traders useful insights into the forex market while also guiding them on the next steps to take.
The RSI is so useful that many other indicators base their signals on it. This article is dedicated to the best of those indicators; the best RSI indicators.
Table of Content
- The RSI Divergence Indicator
- RSI Heat Map Indicator
- RSI 3TF Alert Indicator
- StochRSI Indicator
- RSI Trend Catcher Signal Indicator
- Br RSI Multi Signal Scanner Indicator
- StochRSI Basic Indicator
- Smoothed RSI Indicator
- Laguerre RSI Indicator
- Adaptive RSI Indicator
Without further ado, these are some of the best RSI indicators for MT4.
The RSI Divergence Indicator
The impressive thing about the RSI is that it does a lot of things quite well. It tells the trend and predicts reversals using overbought and oversold price levels. When you add divergence trading to that list, what you have is a versatile indicator.
The RSI is designed in such a way that it almost mirrors the movement of the price on the chart. That means the indicator reaches a peak when the price reaches a peak, and it troughs when the price troughs— both indicator and price are in convergence.
But a divergence happens when the price and the indicator seem to go in different directions. And when these divergences happen, they are almost always followed by reversals. This appears on the chart as any of these scenarios:
- The indicator has lower highs between two consecutive peaks while the price has higher highs, and vice versa.
- The indicator has lower lows between two troughs while the price has higher lows, and vice versa.
Divergences are a great way to use the RSI indicator because of their relatively high success rates. But they can be hard to spot for novice traders. And this is where the RSI Divergence indicator comes in.
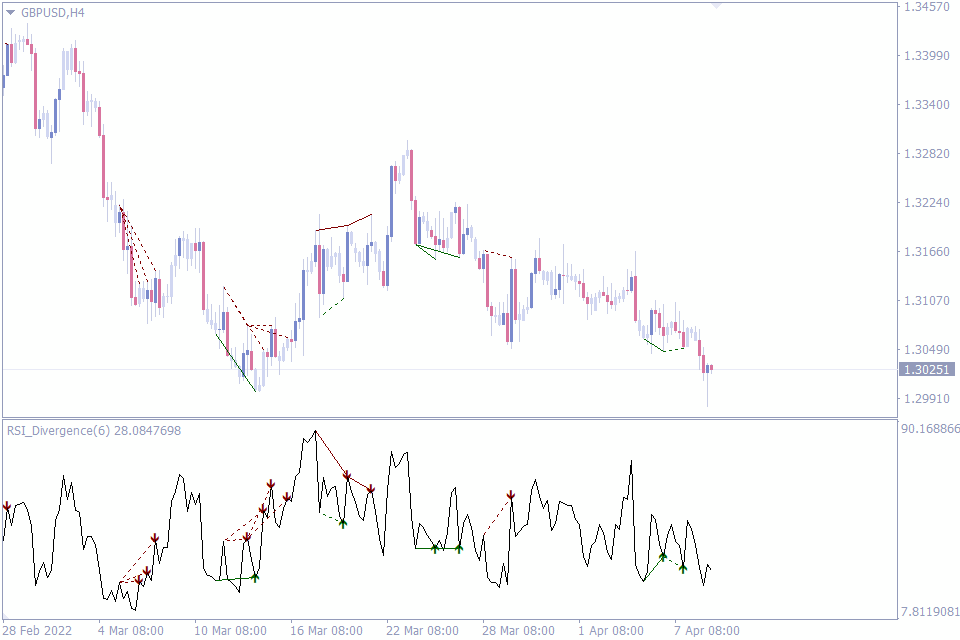
The RSI Divergence draws lines on the price chart and the indicator window to specify where divergences have occurred. It also supports these lines with arrows that help novice traders know what positions to enter; buy or sell.
With the help of the RSI Divergence, novice forex traders can always catch divergences as they happen on live charts. Experts who already know how to spot divergences on charts can also use the RSI Divergence to help them save time.
Ultimately, it is these abilities to spot divergences while pointing at what direction to trade after these divergences that make the RSI Divergence one of the best RSI indicators.
RSI Heat Map Indicator
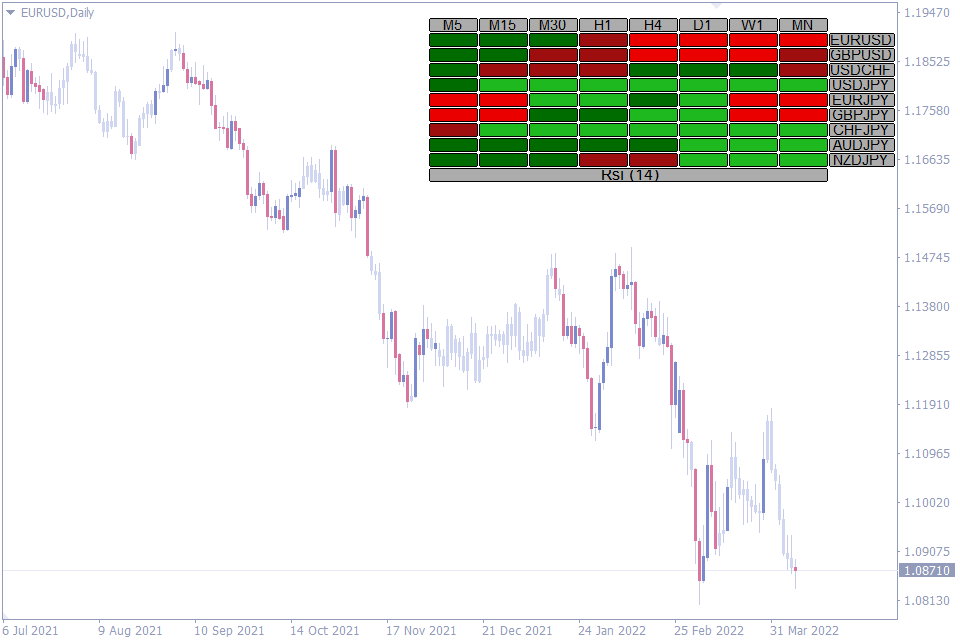
The RSI Heatmap indicator calculates the strengths of various major currency pairs at once using RSI. With the use of four colors, this indicator represents the strength of any currency pair at the 5-minute, 15-minute, 30-minute, hourly, 4-hour, daily, weekly, and monthly charts.
The four colors are brick red, red, green, and lime green, with lime green being the strongest level and brick red being the weakest. According to its design, traders can use this information to know if a major currency pair is strong enough to be traded at a given time.
Another way this indicator comes in handy is when you’re looking for a pair with a currency you’re not already over-exposed to. For instance, assume you have an active trade in the EURUSD pair, and you find another good entry on the GBPUSD pair. These two pairs have the USD currency in common, which could expose you too much to the currency if you trade the pair.
So, what you do instead is that you find a correlating pair that doesn’t have USD, and is also very active on the RSI heat may. This way, you avoid overexposure and still get into active markets.
An additional detail that makes the RSI Heatmap an even better indicator is how it shows the strength of each currency pair across different timeframes. This allows traders of all trading styles, intraday, positional, swing, or scalp, to jump on the indicator.
By the way, it is worthy of note that the RSI Heatmap is not a trend indicator. So, don’t expect to enter or exit positions with it. It instead uses colors to represent the strength of a currency pair. What you do with this information depends on your trading strategy.
RSI 3TF Alert Indicator
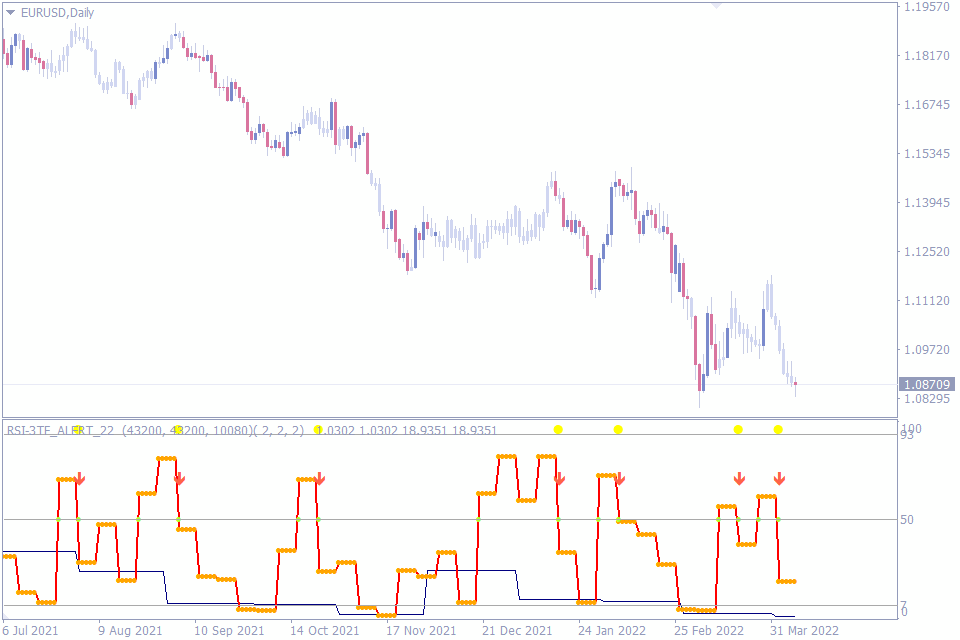
The RSI 3TF Alert indicator is another useful trend trading indicator that is based on the RSI. It collates RSI values across three timeframes for any currency pair. These values are then used to plot new indicator signals that appear as the RSI 3TF Alert indicator as we now see it.
This indicator has colored lines and dots that are used to represent various calculated metrics. For instance, red, blue, yellow lines denote RSI values from various timeframes. But perhaps, the most important of them are the arrows that denote when to buy and when to sell.
With these arrows, any trader using this indicator knows just when to get in on a trend. They don’t have to do extra analysis, as an upward-facing arrow represents a buy and a downward-facing arrow denotes a sell.
Another feature that the RSI 3TD Alert indicator imports from the classic RSI indicator are the overbought and oversold features. But while RSI uses the 70 and 30 marks to denote these levels, the RSI 3TF makes use of 93 and 7 levels.
Finally, the RSI 3TF works well across all timeframes. And as a result, forex traders of all trading styles can enjoy using this indicator without limits.
When you put all of these features together, it isn’t hard to see why the RSI 3TF is one of the best RSI indicators around.
StochRSI Indicator
The stochastic and the RSI are indicators that have gained the trust of traders over time. Each is a powerful tool in the hands of a forex trader who knows how to use it. However, both share a common shortcoming: They lag.
In other words, the market might have been halfway into a move before any of the indicators signals that a new move has begun. Tweaking the settings of these indicators may help, but not without a cost.
Intraday traders who hope to use this indicator on lower time frames often find themselves on the losing end, as the indicators just seem too slow. This is where the StochRSI indicator shines.
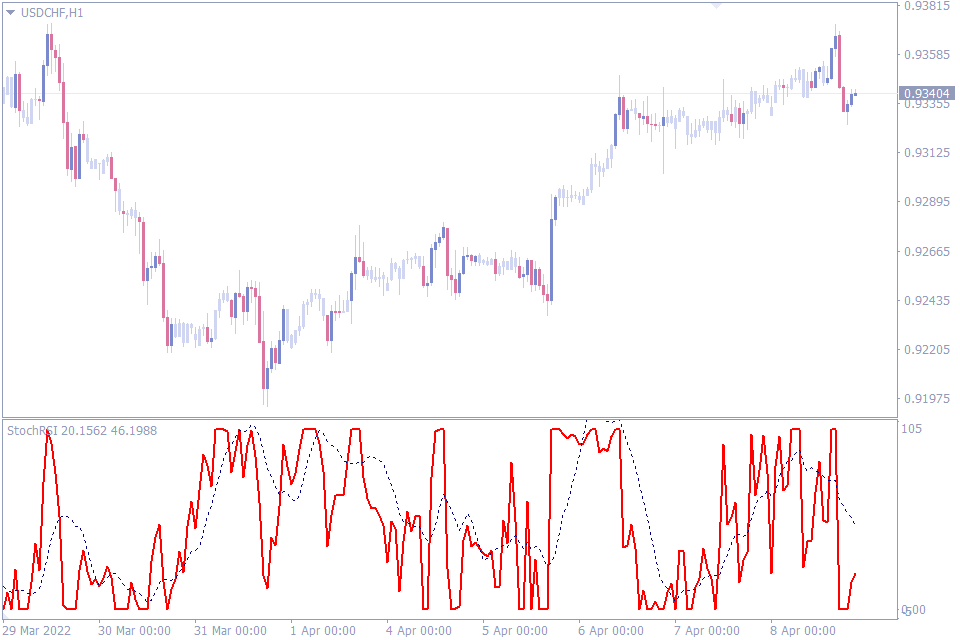
The StochRSI makes use of RSI values on the Stochastic formula. With this tweak, the StochRSI offers a new perspective to the forex market. An immediate effect is that this indicator gives signals much more quickly.
This higher sensitivity can be either good or bad, depending on how you use it. It is a good thing for intraday traders, as they now have many fast signals to work with. Swing traders, on the other hand, may find it too impulsive.
What we like best about the StochRSI indicator is how it marries the best of the two individual indicators to birth a new one that intraday traders would like better.
RSI Trend Catcher Signal Indicator
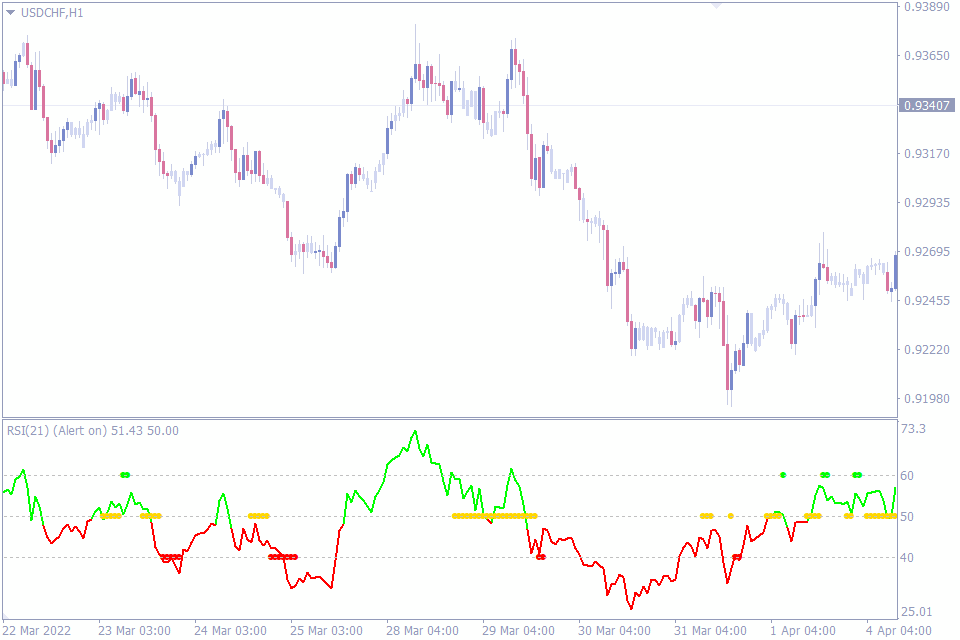
The RSI Trend Catcher is a simple indicator that helps traders spot trend changes. The lines of the indicator are those of the RSI indicator. But the signals that this Trend Catcher generates are different from what the classic RSI generates.
The RSI Trend Catcher changes the color of the RSI line from green to red, depending on the trend. When the color changes to green, it is suggesting a buy. And when the color changes to red, the indicator suggests a sell.
Another useful feature of the RSI catcher is how it also tells overbought and oversold levels on the chart. Only that these levels are closer to each other here than in the classic RSI. The classic RSI sets its oversold and overbought levels at the 30 and 70 levels, respectively, while the Trend Catcher uses the 40 and 60 levels.
However, if you’re not comfortable with these levels, you can easily edit them in the indicator settings.
One more feature that makes the Trend Catcher one of the best RSI indicators out there is that it can also be used to trade divergences.
This Trend Catcher indicator is basically the classic RSI with some alterations that make it more suited to novice traders, thanks to its color changes. Expert forex traders would also benefit from including this indicator in their trading system.
Br RSI Multi Signal Scanner Indicator
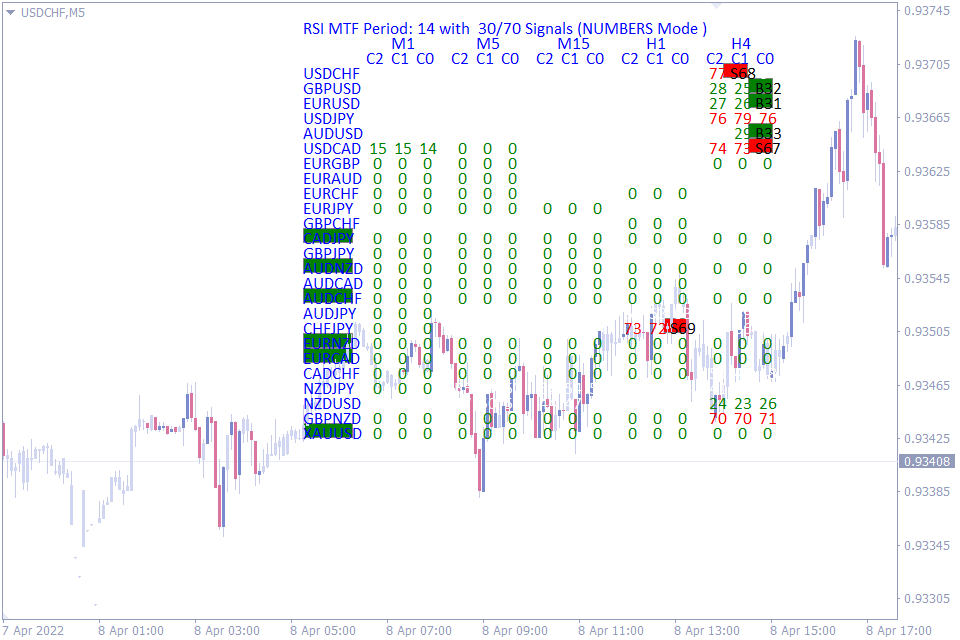
At a first glance, the Br RSI Multi Signal Scanner can be quite confusing. However, if you have the fortitude to give this indicator a second look, it can be a useful tool in your armory.
The best thing about this indicator is how it puts a nice spin on how you view the RSI overbought and oversold signals. Before now, you could only check if a currency pair is in the overbought or oversold level for any timeframe by opening the chart on that timeframe. But with the Br RSI Multi Signal Scanner, you can view these details at once.
The Br RSI Multi Signal Scanner brings the RSI values for the last three periods on various timeframes to you. This information can come in handy when you need to know which currency pairs are on the overbought and oversold levels, and on what timeframes.
It is important to note, on the other hand, that this indicator should not stay for too long on your chart, as it makes your chart look cluttered. Instead, you can use it to glean useful insights into the market before removing it.
Also, the indicator only goes as far as the 4-hour chart. This means swing traders who need the daily chart and higher timeframes may not be able to benefit from the indicator. On the flip side, however, day traders would enjoy using it.
StochRSI Basic Indicator
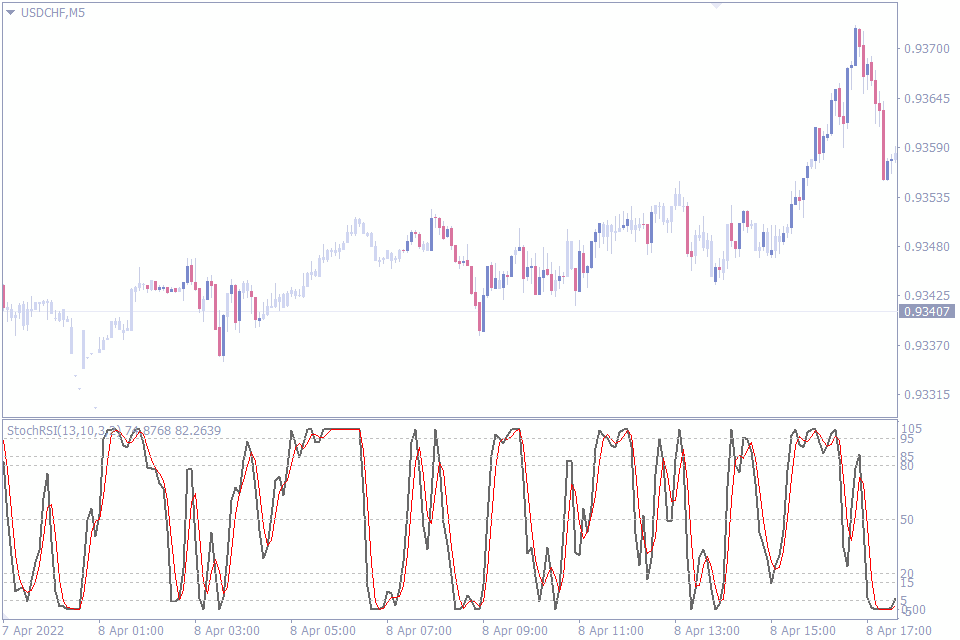
The StochRSI Basic Indicator is similar to the StochRSI we discussed above. Both indicators combine two of the most reliable indicators; the RSI and the Stochastic.
However, the difference between the StochRSI Basic and the StochRSI is that the former is better for trading overbought and oversold levels.
Perhaps, the best thing about the StochRSI Basic indicator is how it marks out various oversold and overbought levels. For the overbought levels, the indicator marks out the 80, 85, 95, and 105 levels. And for the oversold levels, the indicator marks out the 0, 5, 15, 20 levels.
The benefit of having these various levels all marked out is that you can choose one that best predicts the oversold and overbought signals for each timeframe from any of the levels. And you can do this without tweaking the settings of the indicator.
Novice and expert forex traders of all trading styles would benefit from the StochRSI Basic, especially if the indicator is used in confluence with other price action tools.
Smoothed RSI Indicator
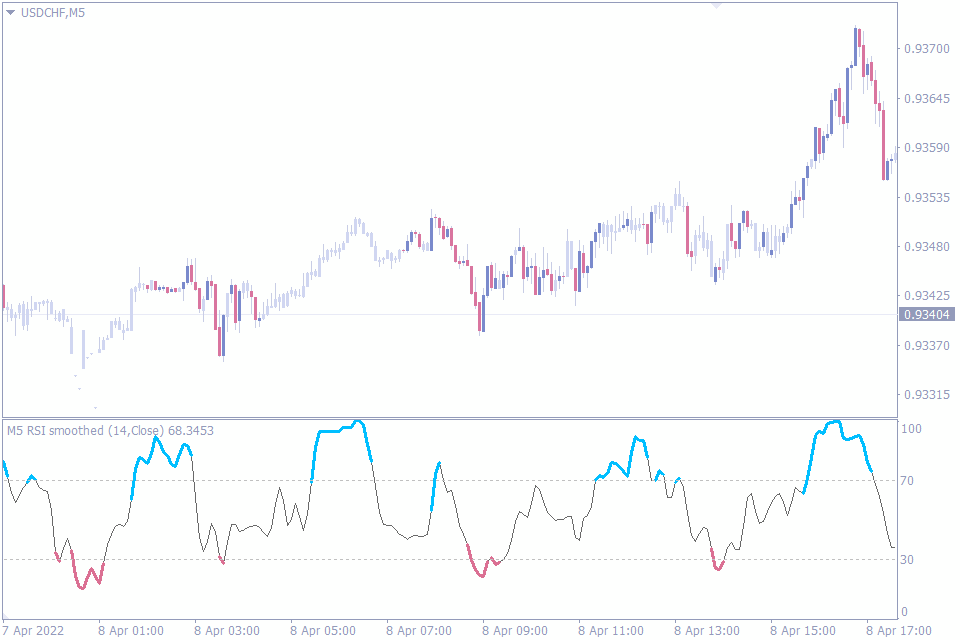
Although the RSI was a favorite among many forex traders, some traders didn’t fancy it. A reason many of them gave for not fancying the indicator is how it sometimes looks choppy. For such traders, the Smoothed RSI solves this problem.
The Smoothed RSI is based on the classic RSI. However, its lines differ from that of the RSI because the Smoothed RSI is smoothened to look more like a flow, rather than the choppy look the RSI gives.
Another feature of the Smoothed RSI is how it uses colors to denote when the price is overbought or oversold. The blue color comes on when the indicator predicts the price to be in an overbought zone, while the peach color appears when the price is in the oversold range.
This feature is perhaps the best thing about the Smoothed RSI, and it is one reason we have this indicator as one of the best RSI Indicators.
To get the best out of this feature, only buy when the peach color ends. This often collides with when the RSI line is rising out of the oversold level. Similarly, only sell when the blue color ends, which often collides with when the RSI is bowing out of the overbought level.
Laguerre RSI Indicator
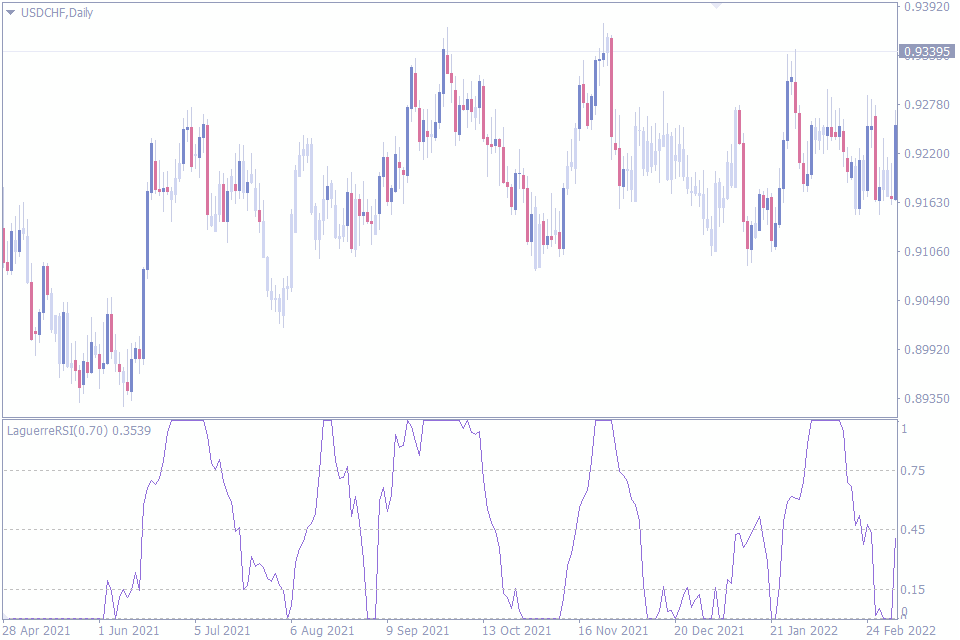
The Laguerre RSI is just like the Smoothed RSI we discussed above. Only that the signal line of the Laguerre RSI is even more smoothened than that of the Smoothed RSI. Beyond that, however, there aren’t so many more differences.
The intended use of the Laguerre RSI is to trade overbought and oversold levels. It would be hard to find another use for this indicator other than what it was intended for.
However, this variation of the RSI indicator does its job so well that it earned itself a space on this list of the top 10 RSI indicators for the MT4.
Forex traders of all styles would enjoy using this indicator, as it maintains its relatively high effectiveness across all timeframes.
Adaptive RSI Indicator
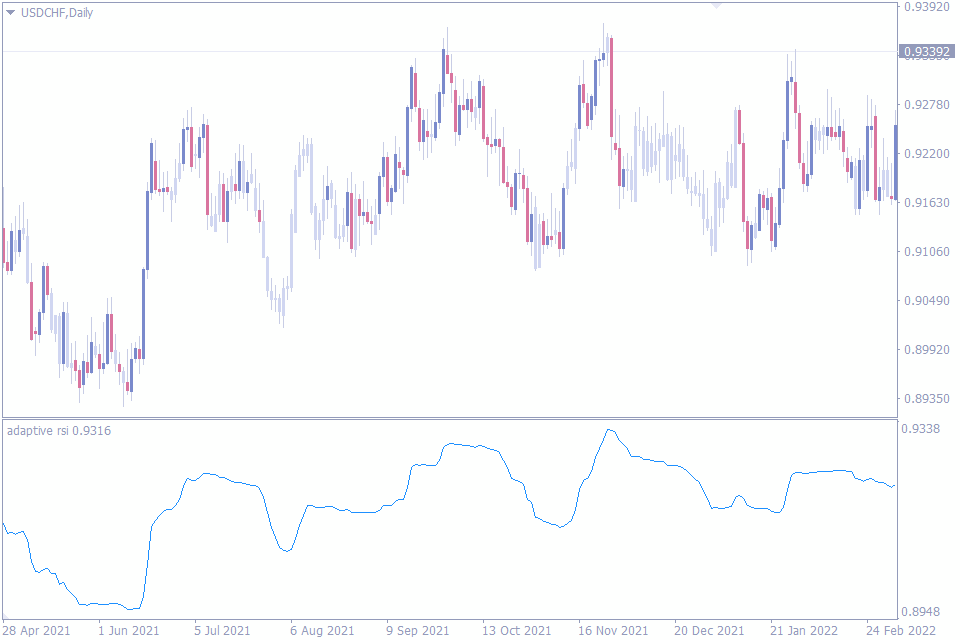
The Adaptive RSI is by far one of the best RSI indicators for many reasons. When you install this indicator on your MT4, all you see is a single line on the indicator window. But this line can be a very powerful tool in the hands of any forex trader.
The first reason the Adaptive RSI is a standout indicator is how it uses the slope of the line to represent the trend. It does this so effectively without getting you into many false trades. When the line slopes upwards, this suggests an uptrend. And when the indicator slopes downwards, the indicator suggests a downtrend.
Another reason this indicator is one of the best RSI indicators is its simplicity. There aren’t many other indicators that can offer this much effectiveness using just one single line.
But like many other strong indicators out there, the Adaptive RSI is not without its shortcomings. A major one is how it can be misleading in ranging markets.
However, the indicator makes up for this in how effective it can be during trending markets and even at reversals.
Adaptive RSI is best suited for all forex traders, regardless of their trading style and their preferred time frame.
Conclusion
All these indicators are very effective, especially after you’ve spent time studying them and using them on your demo trades. They are truly some of the best RSI Indicators around. But they all have a common weakness. In fact, almost every other indicator ever designed shares this same weakness. And what’s this weakness?
They all aren’t meant to be used in isolation. Rather, they are most powerful when you combine them with other price action tools and other technical indicators.


Comment (1)
Bro can you make chop zone like indicator