
Best Indicators For Intraday Trading
Intraday trading relies so heavily on technical analysis and indicators. But of the plethora of indicators out there, which of them are best for intraday trading?
After we reviewed numerous indicators, we came up with 5 that consistently looked promising for intraday trading across various timeframes.
Let’s dive in.
Hull Moving Average Indicator
 The Hull Moving Average Indicator is your normal moving average indicator, but with an extra bit of advantage. It has all the tweaking features of the moving average indicator that comes with the MT4 trading platform. But take note; the strength of the Hull MA can be easily mistaken for a weakness.
On reviewing this indicator, we observed that the Hull moving average indicator tends to stick very closely to the candlesticks, irrespective of whether you’re using the simple, exponential, smoothed, or weighted variant. The advantage of this is that signals are generated on the fly and as quickly as possible. It is this feature that makes the Hull moving average one of the best indicators for intraday trading.
The disadvantage, however, is that this indicator is not useful for long-term analyses because the line is so close to the candlesticks that only immediate short term signals can be generated. Most intraday traders may not mind this disadvantage, however, as they are short term traders.
Another potential disadvantage of this indicator is its high sensitivity, which you would expect from a moving average that sticks this close to the candlesticks. This then leads to many false signals. However, a tweaking of the settings can remedy, or at least, limit, this oversensitivity.
But overall, intraday traders would enjoy having this indicator in their arsenal for quick analysis and decision making.
Pros
- The moving average does not lag.
- It is best for short-term trades.
Bollinger Bands Bicolor Indicator
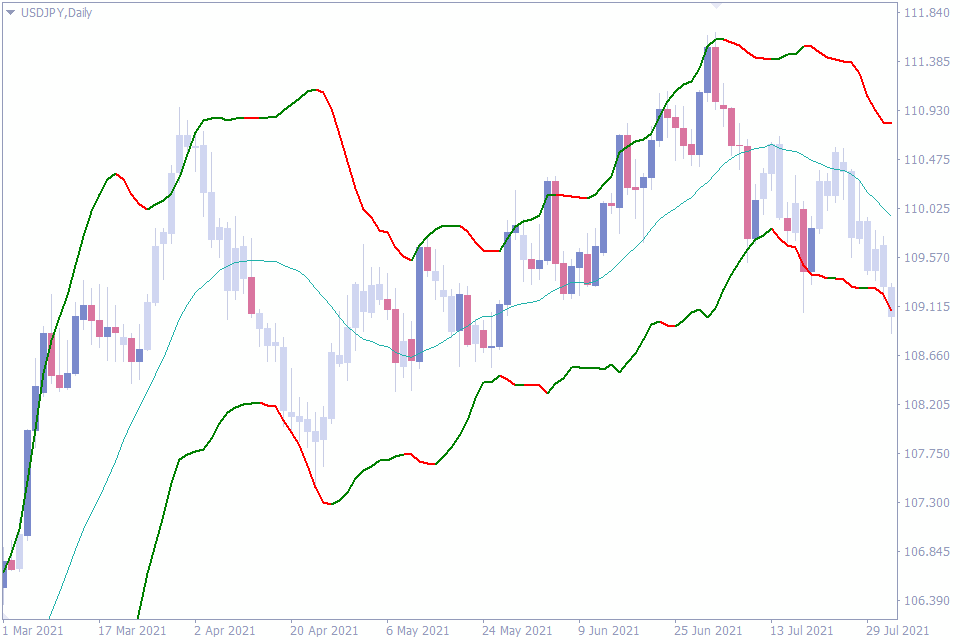
The Bollinger bands bicolor indicator is a child indicator of the original bollinger bands indicator. As such, it inherits the benefits of its parent indicator.
For instance, the gap between the bands can tell how volatile the market is at every point. The farther the upper band is from the lower band, the more volatile the currency pair is, and vice versa. Another feature the Bollinger bands bicolor indicator shares with its parent indicator is the middle MA line that dictates entry and exit positions for many traders.
Although the similarities stop thereabout, it is at this point that the bicolor indicator gets better. To make it easier for intraday traders to spot entry points, the outer bands are either colored green or red. “Green” is for buy while “red is for “sell”.
This additional tweak makes trade entry and exit more automated for intraday traders who can trade when the price crosses the middle line and both bands have the same color. For instance, when the price crosses the middle band to the upside and both bands are green, this is a signal to buy the currency pair. And when the price goes below the mid band and both bands are red, this is a signal to sell the pair.
Pros
- Easy to spot buy and sell signal.
- Best for novice intraday traders who don’t yet know how to use the bollinger bands.
StochRSI Indicator
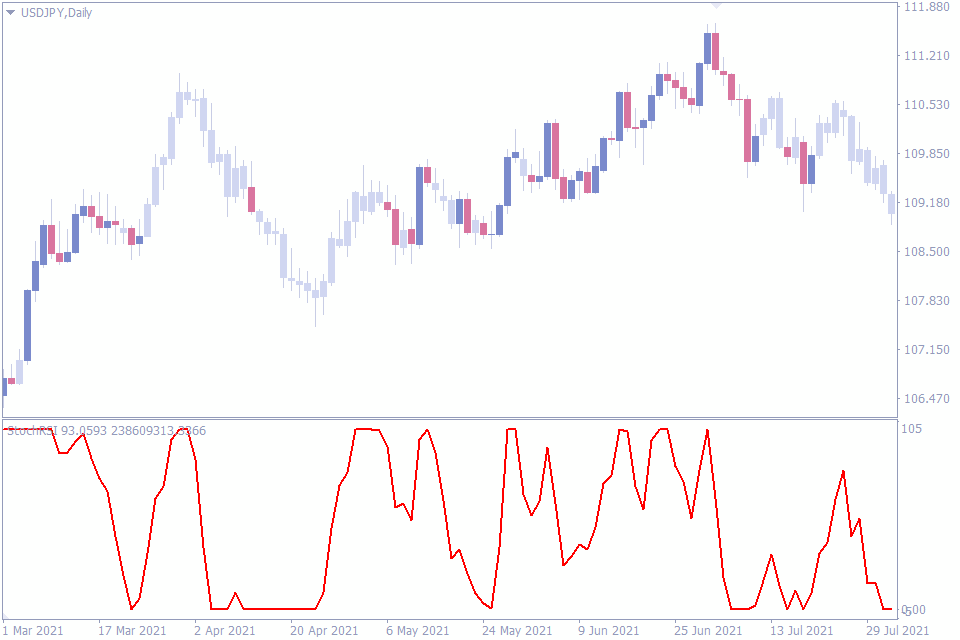
The stochastic and RSI indicators are two indicators that have been passed down from traders from decades ago. That many forex traders of our time still resort to these indicators to analyze their charts is a testament to how useful these indicators are. But each is not without its shortcomings, which is the problem the StochRSI indicator attempts to fix.
The StochRSI indicator copies the best parts of the stochastic indicator and the RSI indicator. It combines the two indicators and gives you a new perspective to viewing the charts.
Perhaps, one of the best advantages the StochRSI indicator has over any of its component indicators is that it has a higher sensitivity. With the increased sensitivity, it is able to generate signals as soon as they appear on the chart, allowing day traders to get in and out of trades on time.
Another advantage that might not necessarily improve your trading signals but will improve the user experience is the simple looks of the StochRSI. Although two indicators are combined to make this indicator, the indicator window on your MT4 doesn’t look cluttered
Pros
- Increased sensitivity makes it more suitable for intraday traders.
- Simple looking aesthetics.
Commodity Channel Index Indicator
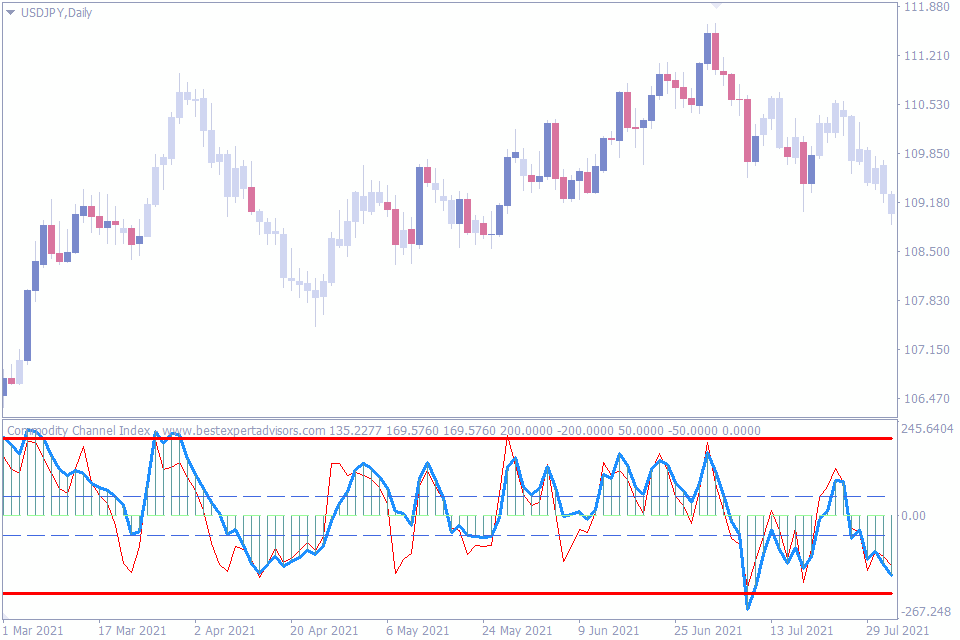
The Commodity Channel Index (CCI) Indicator was originally developed by Donald Lambert. The many dimensions of the CCI indicator are what make it a good indicator for intraday traders who want to be able to glance at charts and make up their minds the next minute.
An advantage of this indicator is its ability to show divergences between its lines and the price, just the way the MACD and the RSI do it. The divergences often signal a potential reversal in trend, or a weakening trend at the very least. Intraday traders who see a weakening trend, for instance, can get out of the trend.
The CCI also predicts when the market is overbought or oversold. These pieces of information help the intraday trader know when a trend is about to end and a reversal is impending. Another thing the CCI indicator does well is that it gives trade entry and exit signals.
And so, with just one indicator, a trader can predict oversold and overbought levels, see divergences, and get entry and exit signals. This all-in-one nature is what makes it one of the best for intraday traders.
Pros
- Predicts overbought and oversold levels.
- Price divergences.
- Entry and Exit signals.
- Traders can get a good view of the pair with a glance at the indicator.
Stochastic Divergence Indicator
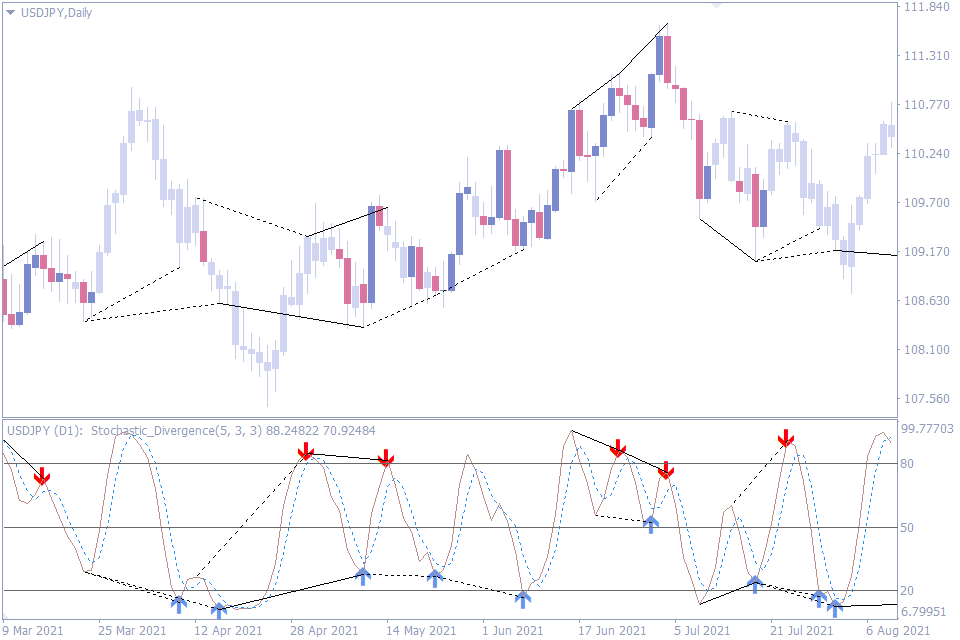
The stochastic divergence indicator finds its source in the popular stochastic indicator. But instead of being a pointless duplicate of the original stochastics, as we have with many other indicators, this one concentrates on just one of the features of the original and makes it better.
On the original stochastic indicator, the appearance of divergences between the indicator and the price is often good news for traders who are looking for trade entries. This is because divergences oten signify a weakening trend or a trend reversal. And this is the feature that the Stochastic Divergence indicator improves on.
The stochastic divergence indicator spots all the divergences that appear on the chart on any timeframe. And when it spots a new one on a live trade, it alerts you. With this alert, an intraday trader can afford to relax without having to always be on their toes to catch all trading opportunities on the chart.
Another thing to note about the stochastic divergence indicator is that it is very sensitive. While this is a good thing for intraday traders who want to get as many signals as they can, the signals can often be incorrect. But this concern can be abated by simply limiting the sensitivity of the indicator in the settings to suit any intraday trader’s preferences.
Pros
- Alerts traders when a buy or sell signal appears.
- Uses arrow to give clear buy and sell signals.
- Settings are adjustable to fine-tune the sensitivity to a traders’ preface.
Conclusion
We just reviewed 5 of the best indicators for intraday trading, and we hope you find them useful.
However, we would be doing you a great disservice if we didn’t remind you that none of those indicators is meant to be used in isolation. The strength of indicators is in how they complement one another. So, no matter how complete an indicator is, it is best to use it in conjunction with other similar indicators to help you get a clearer and more conservative outlook of the chart.


Leave a Reply