
The Best Divergence Indicators For MT4
Don’t miss divergences anymore. Choose from this list of the best divergence indicators to help you spot divergences on your forex chart in real-time.
Divergence is a situation on the forex chart where the indicator and the price go in different directions. Examples are any of these two scenarios:
- The indicator has lower highs between two peaks while the price has higher highs, and vice versa
- The indicator has lower lows between two troughs while the price has higher lows, and vice vera
The peculiar thing about divergences is how well they foretell reversals. These reversals may not always be significant, but the price still tends to bend in their direction.
An issue with these divergences is that they are hard to spot for the untrained eye. But that is the problem most of the indicators on this list solve. And in addition to solving this problem, they also have nuances that make them the best divergence indicators for the MT4.
Table of Content
- The RSI Divergence Indicator
- FX5 MACD Divergence Indicator
- MACD Divergence Indicator
- CCI Divergence Indicator
- Stochastic Divergence Indicator
- TDI RT Alerts Indicator
- OBV Divergence Indicator
- OsMA Divergence Indicator
- AO Divergence Indicator
1. The RSI Divergence Indicator
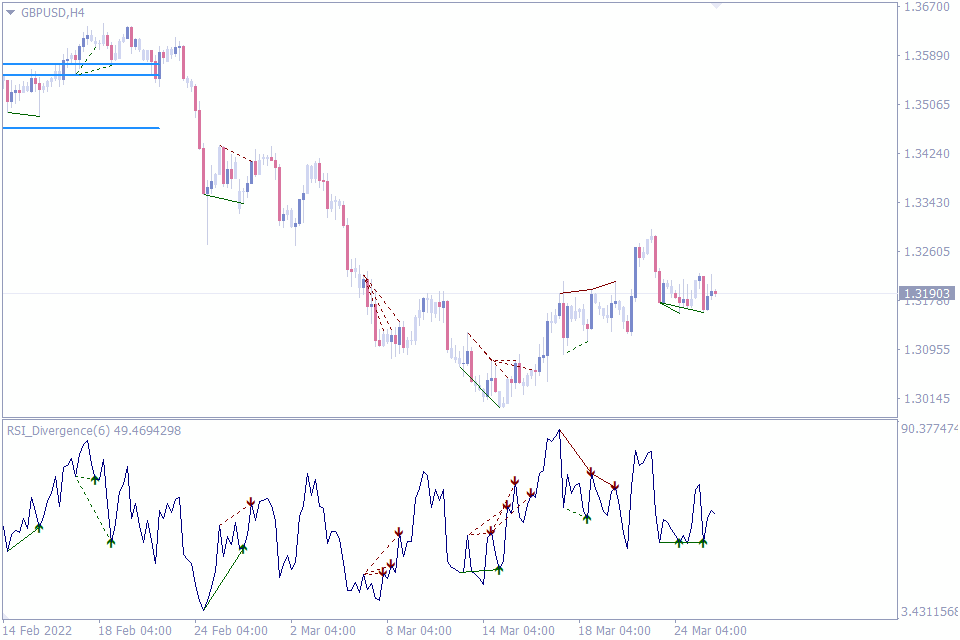
As the name suggests, this indicator has its origin in the classic RSI. The RSI is a momentum indicator that traders use to trade trends. Traders also use the RSI to mark overbought and oversold levels, from which the price is likely to reverse.
Another relatively uncommon use where the RSI excels is divergence trading. But spotting these divergences on the original RSI can be tedious. Even experts sometimes miss out on these divergences.
Fortunately, this is the problem that RSI Divergence helps to solve.
The RSI divergence marks every single divergence between the RSI and the price. It uses straight lines to connect the tips of the highs or lows to show that divergence has occurred in that place.
The indicator displays arrows on each divergence to signify where the price is likely to go next to carry novice traders along with these divergence signals. This simple feature makes trading divergences with the RSI Divergence indicator very easy.
The easy and intuitive way the RSI Divergence solves the problem of spotting divergences is why we have the indicator on our list of the best divergence indicators for MT4.
Because of the sensitivity of the RSI Divergence, intraday traders may stand to gain the most from the indicators. However, swing traders may also be able to put the indicator to good use.
Ultimately, this tool is most powerful in the hands of a trader who knows how to use it in confluence with other significant price action tools.
2. FX5 MACD Divergence Indicator
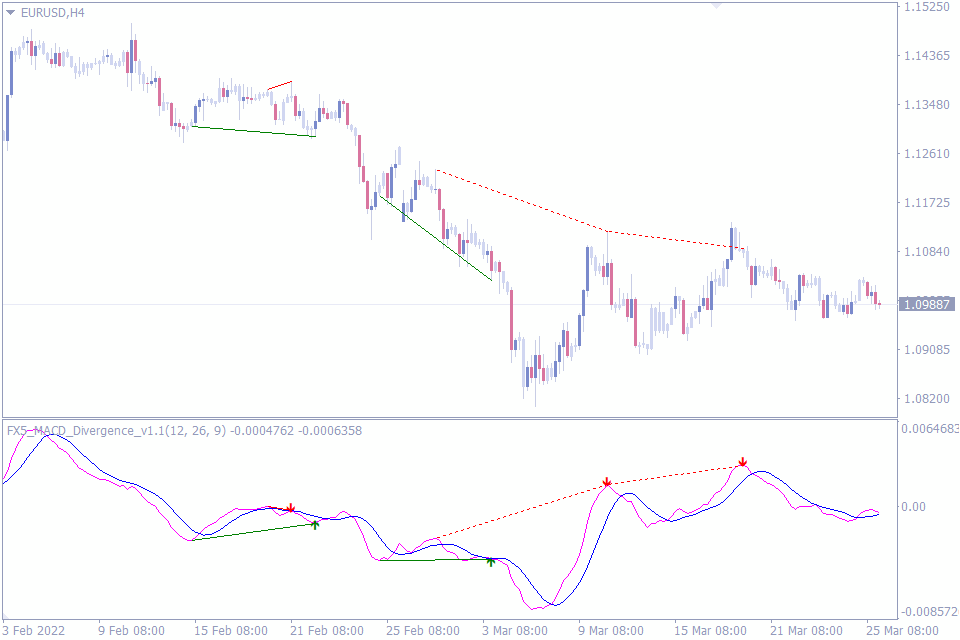
The FX5 MACD Divergence indicator is based on the moving averages of the MACD indicator.
This divergence indicator doesn’t spot too many divergences. However, the ones it spots and displays on the chart have high success rates. We believe swing traders would prefer this indicator above all other forex traders for that reason.
There’s, however, one unique use that is not immediately obvious about this technical indicator. In fact, chances are that the developers of this indicator didn’t even build it to fulfill this unique use. But the indicator serves this purpose surprisingly well:
The FX5 MACD Divergence indicator can help spot the ends of trends, or at least temporary pauses in trends. How? Anywhere you find the indicator giving a lot of signals within a short period, many of which are overlapping, these instances often coincide with the end of trends.
Although the FX5 MACD divergence indicator does its divergence duties exceptionally well, this hidden feature convinces us to rank it among one of the best divergence indicators.
But before we mention our number three divergence indicator, it is worth noting that the FX5 MACD divergence indicator is useful across all timeframes and for all forex trading styles.
3. MACD Divergence Indicator
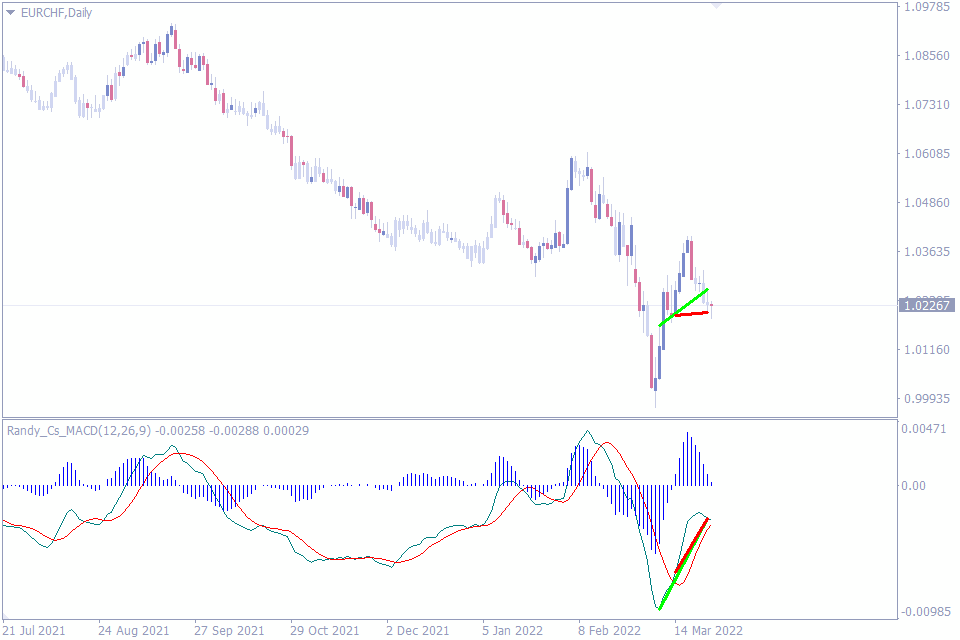
The MACD Divergence indicator is next on our list of the best divergence indicators for the Metatrader 4. And just like the FX5 MACD divergence up there, this one is also based on the MACD.
However, what makes them different is that this one paints the complete picture of the MACD. In other words, you can use this indicator like your regular MACD, with the bars and the moving averages.
When you install the MACD Divergence on your MT4, it is immediately apparent that this indicator only shows you the most recent divergence on the chart. It doesn’t record the past divergences at all. And there are pros and cons to this approach.
The number one benefit is that this indicator concentrates more on the MACD part than the divergence part. You might as well call it an enhanced MACD. And the benefit of this is that you get two indicators in one; MACD divergence and the classic MACD.
Another advantage of not recording the divergences it spotted in the past is that it makes your analysis chart look clean and less confusing. When there are too many indicators on your chart, or the few indicators on your chart are too noisy, it makes the chart look cluttered. And this could hamper your judgment.
The only major disadvantage of the lack of signal record is that there’s no way to backtest the indicator to see its effectiveness. You can only know as you use it to make trades on a demo account. But this can be time taking.
If you can look beyond this significant disadvantage, though, the MACD Divergence is just as capable as other divergence indicators on this list.
4. CCI Divergence Indicator
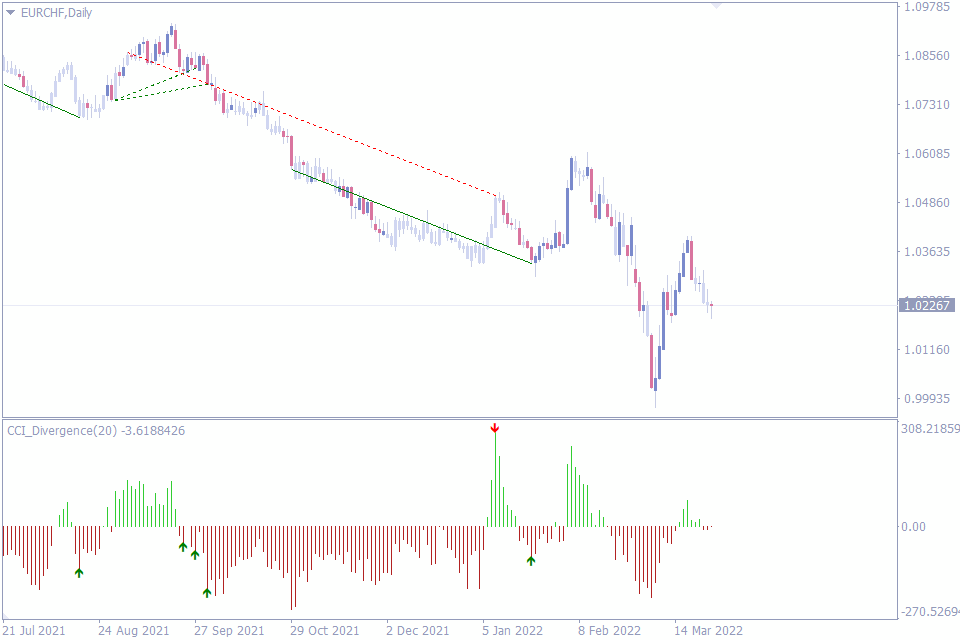
One of the standout features of the CCI Divergence indicator is that it does not have those lines on the CCI indicator window that denote divergence. These lines can sometimes be cumbersome and make your chart look cluttered. It draws those divergence lines on the price chart, however.
How then does the CCI Divergence tell you when a divergence has occurred and in what direction to trade? Through the use of arrows. Upward pointing arrows denote a buy, while downward-facing arrows denote a sell.
This simplicity often separates the indicator for many forex traders who don’t need the extra clumsy details of the divergence; they just want to know whether to buy or sell and nothing more.
This same simplicity, however, comes at a cost for novice traders. Without the divergence lines on the indicator window, novice traders would struggle to understand how the divergence came to be. And this might limit their knowledge of divergences.
Some expert forex traders who already know how to spot divergence may also have issues with this indicator because they won’t be able to vet the signals and filter out the true ones from the false ones. In other words, their trades are in complete control of the signals, which is not something many expert forex traders want.
However, if you don’t belong to any of those two sets of forex traders, you may find this simplicity to be the best thing about the indicator.
5. Stochastic Divergence Indicator
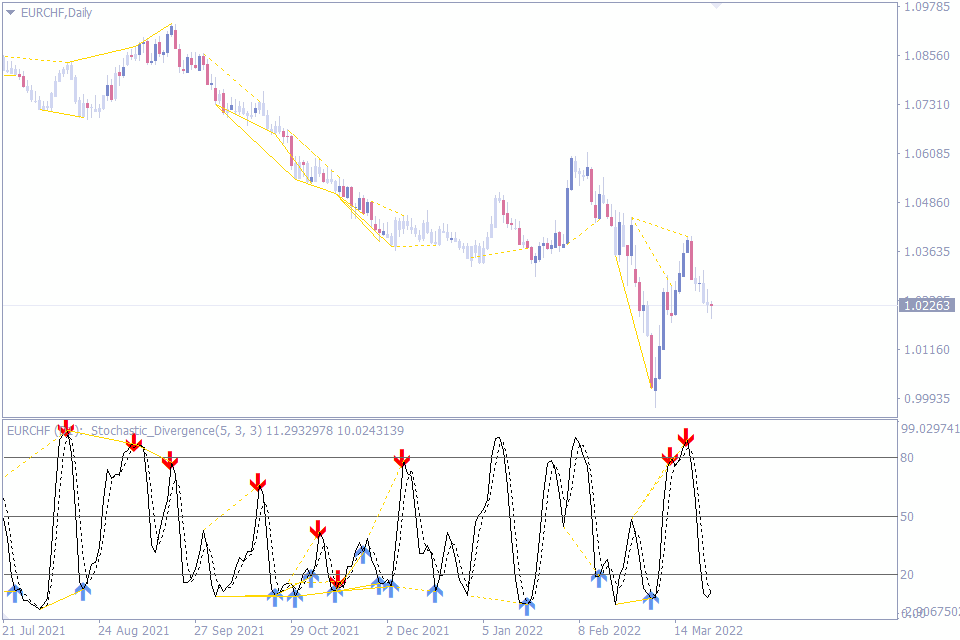
Here’s another divergence indicator based on a popular indicator; the stochastic oscillator indicator. Many professional traders rely on the indicator to tell trends and spot reversals through overbought and oversold levels. Divergence is another way to use this indicator to spot reversals.
The Stochastic Divergence draws lines on the price chart and the indicator window where there are divergences between the price and the indicator. It also uses arrows to point traders in the direction in which the reversal may happen.
Another helpful feature of the stochastic divergence indicator is how it alerts you whenever a new divergence signal appears.
From a first glance, you may already notice that the Stochastic Divergence gives off too many signals. While this may look suspicious at first, closer inspection helps us realize that the indicator, in this default setting, is not for all traders.
Swing traders may not enjoy the seemingly endless signals of the indicator. Intraday traders who are looking to make as many trades within a day as possible, on the other hand, may enjoy receiving the numerous signals of the Stochastic Divergence.
Putting all these together makes the Stochastic Divergence one of the best divergence indicators for day traders.
6. TDI RT Alerts Indicator
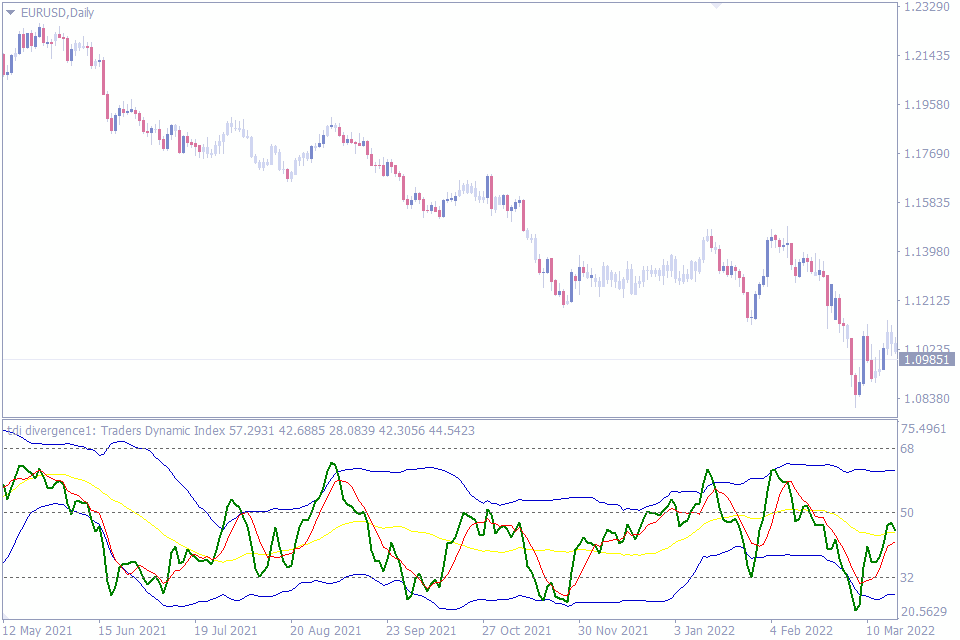
The TDI, at first glance, may confuse you with its lines. However, on paying closer attention, you may realize each line makes up the famous and well-relied-upon indicator, the TDI.
Dean Malone developed traders’ Dynamic Index (TDI) in 2005. When he created it, he intended the indicator to measure the volatility of the price and measure the momentum of a trend. He wanted one indicator that could easily replace two or more indicators on the chart and give him a better view of the market.
However, he may not have intended for his indicator to be used as a divergence indicator, just like the other indicators on this list. And when using the TDI RT to spot reversals, you only need to pay attention to the green line on the indicator, which represents market sentiment.
Unlike the others on this list, the TDI RT Alerts indicator does not display divergence lines on the chart. This means only traders who are already good at spotting divergences in real-time can really make the best use of it.
The many uses of the TDI RT Alerts indicator that help traders glean insights into trend momentums, volatility, and divergences made us consider the indicator for this list of the best divergence indicators.
7. OBV Divergence Indicator
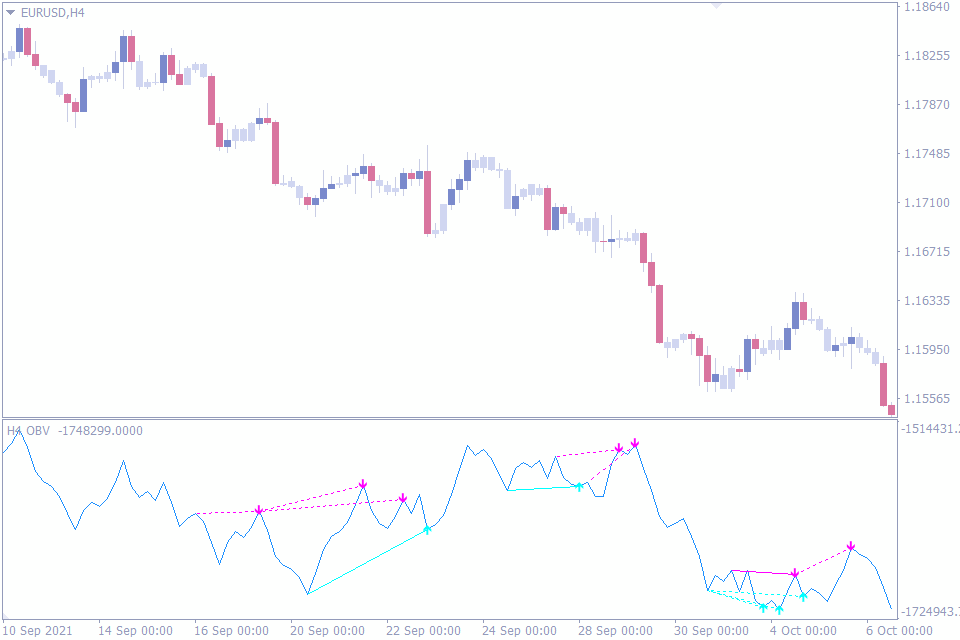
The classic OBV indicator is a momentum indicator that predicts market sentiment using changes in volume.
Many analysts and traders rely on the indicator to reveal the actions of big bank traders who drive the price up to make their profits, only to sell and bring the price down when retail traders buy. And one way the indicator does this is through divergences between volume and price.
However, traders who don’t know how to spot divergences might struggle when trying to interpret the divergence function of the indicator. Fortunately, that is the problem the OBV Divergence solves.
This divergence indicator, just like many others on this list, uses lines and arrows to represent the spotted divergences. These divergence signals are often many, so they may not be best for swing traders. But the indicator would be a more useful tool in the hands of an intraday trader.
The OBV Divergence indicator takes things up a notch in how it helps you ensure that you don’t miss its signals. It can send you alert notifications on your chart. But when you’re not on your chart, you can also tweak the settings to receive notifications through your mail.
The OBV divergence doesn’t have a single huge feature that makes it stand out from the rest. However, these little things that it does well make it one of the best divergence indicators for forex traders.
8. OsMA Divergence Indicator
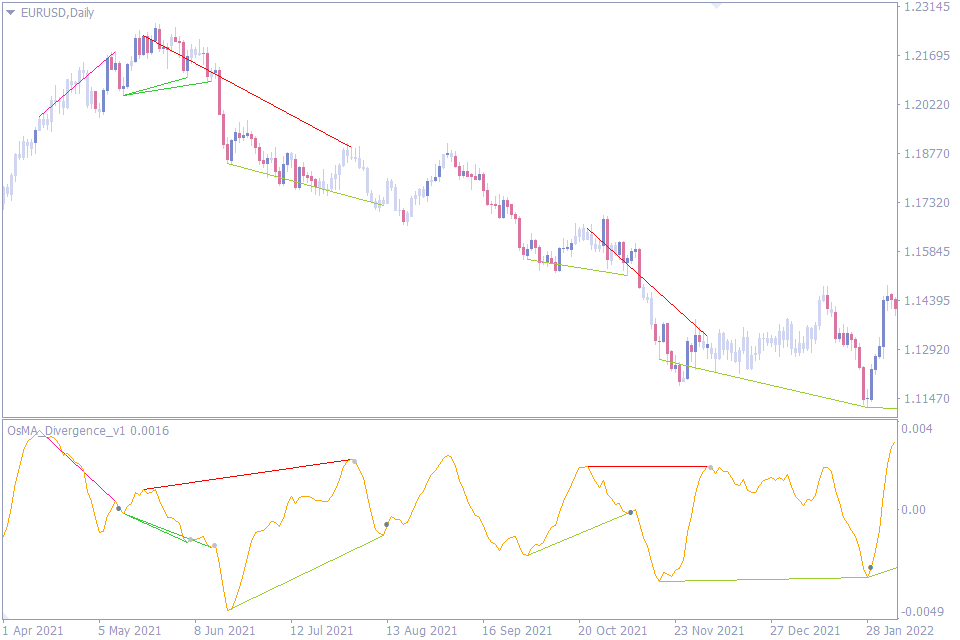
The classic OsMA indicator was derived from the MACD indicator. It simply traces the outline of the edges of the MACD histogram.
In the FX5 MACD Divergence above, we have seen how you can use the moving averages of the MACD for divergences. It so happens that the outline of the MACD bars can do the same. And so, the OsMA Divergence indicator was born.
The OsMA Divergence spots divergences between the price and the outline of the MACD histogram bars, and it uses colored lines to denote these signals.
However, the OsMA Divergence doesn’t do as well as most of the other indicators on this list in that it does not use arrows to denote the buy or sell action. Instead, it uses a dot to signify the end of the divergence. So, even after seeing that a divergence has formed, novice traders may still be at a loss on how to trade it.
The OsMA divergence is sensitive, giving many signals. The chances of false alerts are, thus, higher. One way to filter out some of these false signals on the OsMA divergence is to ignore the divergence lines that cut across the price.
Beyond this sensitivity, however, the OsMA divergence is a good indicator.
9. AO Divergence Indicator
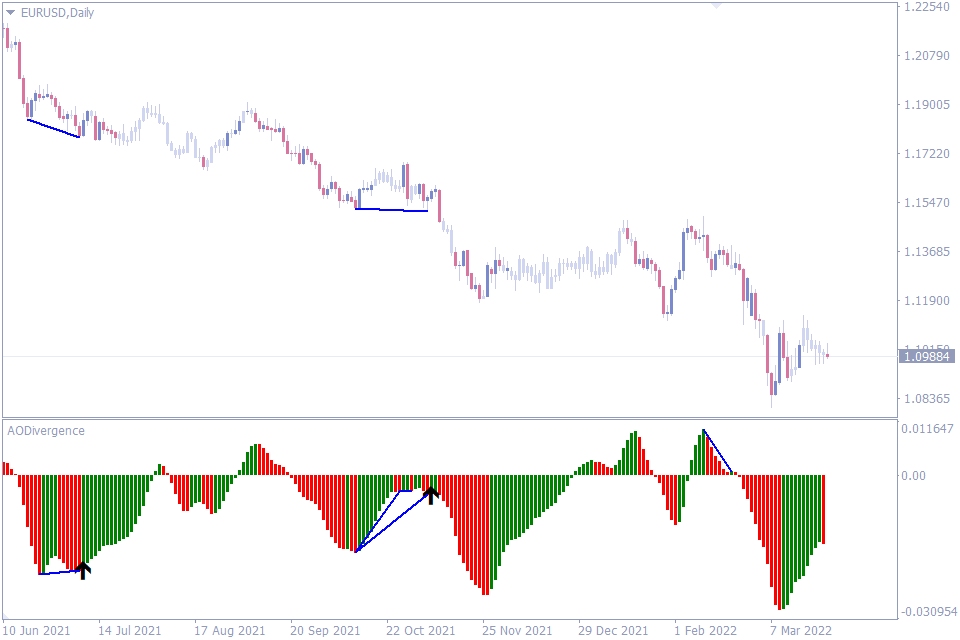
The AO Divergence Indicator is based on the AO indicator. Just like other divergence indicators, lines appear on the chart and the price to denote where divergence has occurred.
The immediately noticeable thing about the AO Divergence is that it doesn’t give too many signals. So, the false signals are limited. However, you can still get something better out of this indicator by doing this:
Steer clear of divergences whose lines are not sitting or underlining two apparent bumps in the AO bars. Those tend to be false. Also, approach the divergence lines that cross the price with caution.
Another reason the AO Divergence may be slightly inferior to some indicators on this list is that it does not use arrows to denote what direction the price is likely to reverse to after a divergence. This can be a slight disadvantage for novice forex traders who don’t know how to trade divergences.
Beyond these three caveats, however, the AO Divergence is a very impressive indicator. Its signals are reliable, and it is easy to see why it is on our list of the best divergence indicators for the MT4 trading platform.
However, day traders who hope to get into many trades using this indicator may be disappointed because there aren’t many signals here. Depending on the market condition, the frequency of the signals of the AO Divergence can increase. But mostly, these divergences appear infrequently.
Conversely, we can easily see the AO Divergence being a favorite among forex swing traders.
Conclusion
And that completes our list of the best divergence indicators for the MT4. Of course, there are more divergence indicators out there. But among those we tested, we found these to be some of the best.
But before we close the curtain on this topic, we want to remind you that none of these indicators were designed to be used in isolation. They get better when combined with other indicators and price action tools.


Comments (3)
Everything is certainly entrance subsequent to a extremely distinct augmentation of the issues. It was in reality informative. Your website is entirely helpful. Thank you for sharing!
GREAT INDICATORS
Thx =)