
Best Forex Indicator Combinations
In the world of Forex trading, the right tools can make all the difference. Seasoned traders know that no single indicator can guarantee success. Instead, it’s the combination of indicators that offers a comprehensive view of the market. Finding the best combination, tailored to your trading strategy, can significantly boost your chances of making informed and profitable decisions. In this article, we will look at the best examples of combining Forex indicators for more accurate analysis and trading signals. Whether you’re a beginner or an experienced trader looking to refine your strategy, this guide will help you navigate the vast world of Forex indicators effectively.
Table of Content
The effectiveness of forex indicator combinations can vary depending on the trader’s strategy and preferences. However, here are five popular forex indicator combinations used by traders:
- Moving Average and Relative Strength Index (RSI)
- Bollinger Bands and Stochastic Oscillator
- MACD (Moving Average Convergence Divergence) and Fibonacci Retracement
- Ichimoku Cloud and Parabolic SAR
- Average True Range (ATR) and Moving Average Convergence Divergence (MACD)
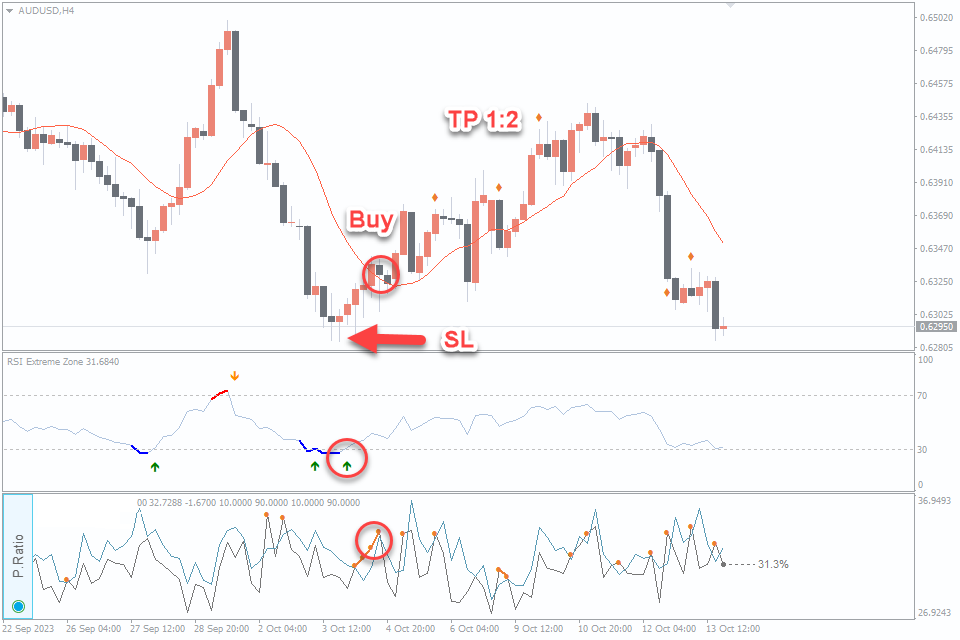
#1. Moving Average and RSI
The Moving Average helps identify trends, while the RSI measures overbought and oversold conditions. When used together, they can confirm trend strength and potential reversal points.
Timeframe: all timeframes, but it’s often effective on H1 and higher
Currency Pairs: all major and minor currency pairs
Indicators: RSI Extreme Zone Indicator, Best Moving Average Indicator, FXXSI. ProfitRatio (optional)
BUY Strategy
Look for a potential buy signal when the following conditions are met. Trend Confirmation – Ensure that the price is above the 13-period Moving Average (MA 13) to confirm an uptrend. RSI Confirmation – Check the RSI indicator. Buy when the RSI crosses above the 30 level, indicating that the currency pair was previously oversold and might be reversing upwards.
Confirmation FXXSI.Profit Ratio (optional): Watch for a trend change signal, if there is one the likelihood of your strategy will be significantly increased.
Entry Point: Enter a buy trade at the market price or consider a pending order just above the high of the candle that confirmed the RSI crossover.
Stop-Loss: Set the stop-loss just below the recent swing low or the low of the candlestick pattern that confirmed the trade.
Exit Strategy: Exit on RSI Reversal – if the RSI crosses below the 70 level, consider closing the trade as it may indicate a potential reversal.
Take-Profit: If the price reaches your predefined take-profit level, close the trade.
SELL Strategy
The selling strategy is absolutely mirror and opposite to the buying strategy.
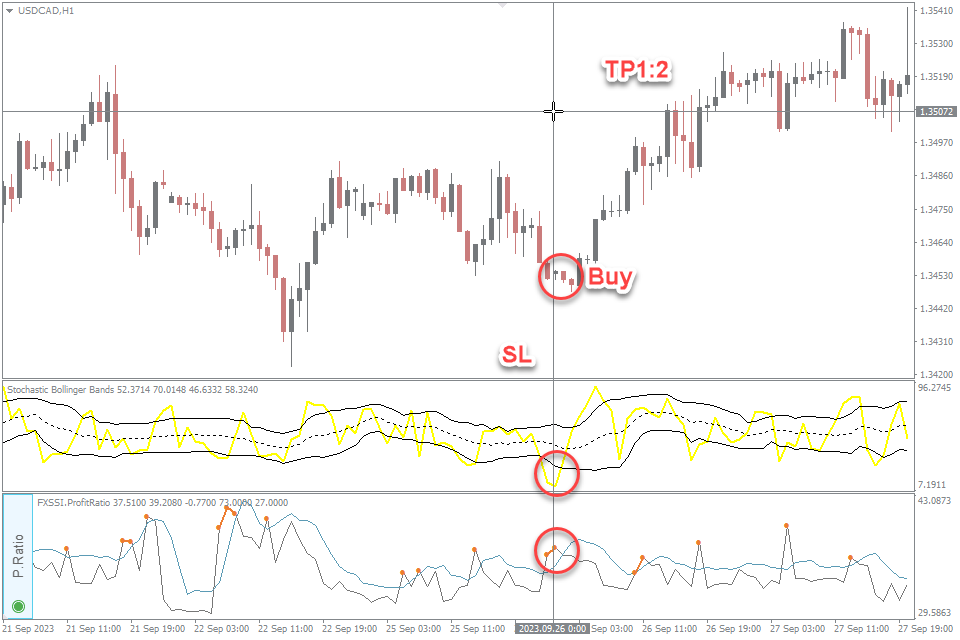
#2.Bollinger Bands and Stochastic Oscillator
Bollinger Bands indicate volatility and potential price reversals, while the Stochastic Oscillator identifies overbought and oversold levels. Combining these two helps traders spot potential entry and exit points.
Timeframe: all timeframes, effective on H1 and higher for swing trading
Currency Pairs: all major and minor currency pairs
Indicators: Stochastic Bollinger Bands Indicator, FXXSI. ProfitRatio (optional)
BUY Strategy
Look for a potential buy signal when the following conditions are met. Price at Lower Bollinger Band – Ensure that the current price touches or closes near the lower Bollinger Band, indicating that the price may have reached a potential support level. Stochastic Crosses Oversold Level – Check the Stochastic Oscillator. Buy when the Stochastic crosses above the oversold level (usually below 20), indicating a potential upward reversal.
Confirmation FXXSI.Profit Ratio (optional): Watch for a trend change signal, if there is one the likelihood of your strategy will be significantly increased.
Entry Point: Enter a buy trade at the market price or consider a pending order just above the high of the candlestick that confirmed the Stochastic crossover.
Stop-Loss: Set the stop-loss just below the recent swing low or the low of the candlestick pattern that confirmed the trade.
Exit Strategy: As the trade moves in your favor, consider trailing your stop-loss to lock in profits. Use the lower Bollinger Band or a moving average to trail your stop. Exit on Stochastic Reversal – If the Stochastic crosses below the overbought level (usually above 80), consider closing the trade as it may indicate a potential reversal.
Take-Profit: Aim for a risk-reward ratio of at least 1:2 or higher. Set the initial take-profit level near the middle or upper Bollinger Band. If the price reaches your predefined take-profit level, close the trade.
SELL Strategy
The selling strategy is a complete mirror image and opposite of the buying strategy.
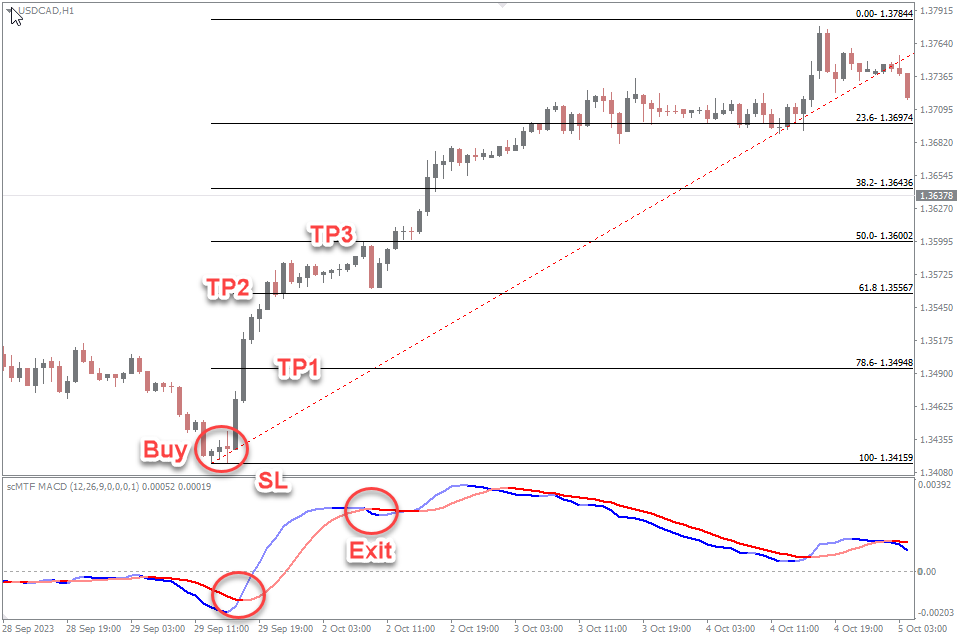
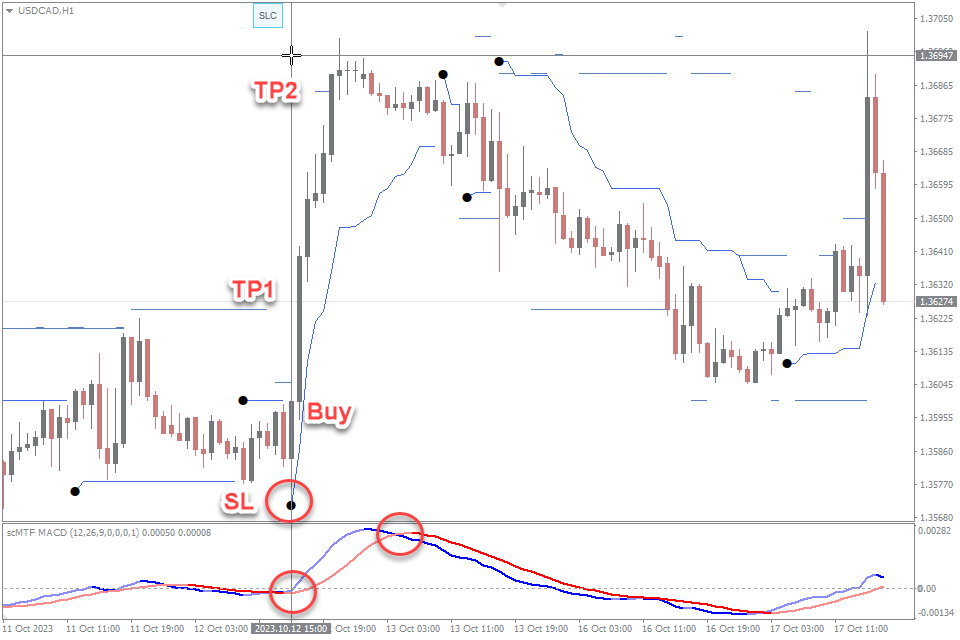
#3. MACD and Fibonacci Retracement
MACD provides trend-following signals, while Fibonacci retracement levels highlight potential support and resistance zones. This combination helps traders enter trades with the trend at key levels.
Timeframe: all timeframes, effective on H1 and higher for swing trading
Currency Pairs: all major and minor currency pairs
Free Indicators: MACD Alert Indicator, Auto Fibonacci Retracement Indicator,
BUY Strategy
Look for a potential buy signal when the following conditions are met.
MACD Crossover – Wait for the MACD indicator to generate a bullish alarm. This happens when the MACD line crosses above the signal line. Fibonacci Retracement Level – Identify a significant Fibonacci retracement level (e.g., 38.2% or 50%) during an uptrend. This level should act as support.
Candlestick Confirmation (Optional): Seek bullish candlestick patterns like Hammer or Bullish Engulfing near the Fibonacci retracement level for additional confirmation.
Entry Point: Enter a buy trade at the market price or consider a pending order just above the support level identified by the Fibonacci retracement.
Stop-Loss: Set the stop-loss just below the recent swing low or the low of the candlestick pattern that confirmed the trade.
Exit Strategy: Consider trailing your stop-loss to lock in profits as the trade moves in your favor, using a trailing stop or a moving average. Exit on MACD Reversal – If the MACD generates an opposite crossover (e.g., bearish crossover during a long trade), consider closing the trade as it may indicate a potential reversal.
Take-Profit: Set the initial take-profit level near the next significant resistance level. Close the trade when the price reaches your predefined take-profit level.
SELL Strategy
The Sell strategy is similar and opposite to the buying strategy.
#4. Ichimoku Cloud and Parabolic SAR
The Ichimoku Cloud offers a comprehensive view of support, resistance, and trend direction, while the Parabolic SAR provides stop-loss levels. Traders use this combo for trend confirmation and setting stop-loss orders.
![]()
Timeframe: all timeframes, effective on H1 and higher for swing trading
Currency Pairs: all major and minor currency pairs
Free Indicators: Ichimoku Signals Cloud Indicator, Parabolic Sar Indicator
BUY Strategy
Look for a potential buy signal when the following conditions are met.
Ichimoku Cloud – Check that the price is above the Kumo Cloud (the shaded area). This indicates a bullish trend. Parabolic SAR – Confirm that the Parabolic SAR dots are below the price candles, signifying an upward trend. Ichimoku Kinko Hyo Tenkan-sen and Kijun-sen Crossover – Watch for a bullish crossover where the Tenkan-sen (Conversion Line) crosses above the Kijun-sen (Base Line).
Entry Point: Enter a buy trade at the market price once the conditions are met and confirmed.
Stop-Loss: Set the stop-loss just below the Kumo Cloud or the most recent swing low.
Exit Strategy: Consider trailing your stop-loss to lock in profits as the trade moves in your favor, using the Parabolic SAR dots. Exit on Reversal – If the Ichimoku Cloud switches from bullish to bearish (or vice versa), consider closing the trade as it may indicate a trend reversal.
Take-Profit: Aim for a risk-reward ratio of at least 1:2 or higher or set the initial take-profit level at the next significant resistance level.
SELL Strategy
The Sell strategy is the same like buy strategy but it is just opposite.
#5. ATR and MACD
ATR measures market volatility, helping traders set appropriate stop-loss and take-profit levels. When combined with MACD, it offers a well-rounded approach to trend-following and risk management
Timeframe: all timeframes, effective on H1 and higher for swing trading
Currency Pairs: all major and minor currency pairs
Indicators: ATR Stop Indicator, MACD Alert Indicator, FXSSI.StopLossClusters
BUY Strategy
When the following conditions align, consider initiating a buy trade. ATR Confirmation – Confirm that ATR is rising, indicating increasing volatility and the potential for a strong trend. MACD Crossover – Look for a bullish crossover of the MACD line (the faster line) over the signal line (the slower line).
Entry Point: Enter a buy trade at the market price when both ATR confirmation and the MACD crossover conditions are met.
Stop-Loss: Set the stop-loss just below the most recent swing low or at a significant support level for buy trades.
Exit Strategy: As the trade moves in your favor, you have several options. Consider using a trailing stop to capture additional profits. You can trail your stop-loss using a moving average or ATR multiplier. Alternatively, exit the trade if the MACD line crosses below the signal line for buy trades, as this may signal a potential trend reversal.
Take-Profit: Place your take-profit just below the stop-loss zone of sellers’ clusters using the FXSSI.StopLossClusters indicator or at the next significant resistance level.
SELL Strategy
The selling strategy is absolutely mirror and opposite to the buying strategy
Conclusion
In conclusion, the search for the perfect combination of Forex indicators is a journey toward more precise trading. The Forex market’s complexity demands a strategic approach, and by thoughtfully selecting and combining indicators that align with your goals, you can gain a deeper understanding of market movements. A combination of indicators in the Forex market will allow you to find more confident entry and exit points, as well as filter out market noise and reduce unprofitable orders.
However, it’s crucial to remember that no strategy is foolproof, and risk management is always a top priority. Being aware of economic and geopolitical factors impacting the Forex market is essential for making well-informed decisions.
With the right indicator combination and a commitment to ongoing improvement, you can navigate the intricacies of the currency market and come closer to achieving your trading goals.
Good luck!


Leave a Reply