

How to Use Relative Strength Index in Forex
Navigating the dynamic terrain of Forex trading necessitates a robust technical strategy, underscoring its paramount significance. An invaluable asset in this domain is the “Relative Strength Index”, conveniently accessible for free download on the widely used MT4 platform. This indicator stands out with its unique array of features, granting traders crucial perspectives on market trends and prospective trading prospects.
Understanding the Basics of RSI
The RSI is a bounded oscillator, typically ranging between 0 and 100. Traditionally, RSI values above 70 indicate overbought conditions, potentially signaling an upcoming price correction or downtrend. Conversely, values below 30 signify oversold conditions, hinting at a potential upswing or an emerging uptrend.
Understanding the technical aspects of the Forex market is vital for any trader. From reading candlestick charts to analyzing trading strategies and utilizing various indicators, the toolkit for a successful trader is vast. The Relative Strength Index stands as a beacon, aiding traders in deciphering complex market movements and making informed trading decisions.
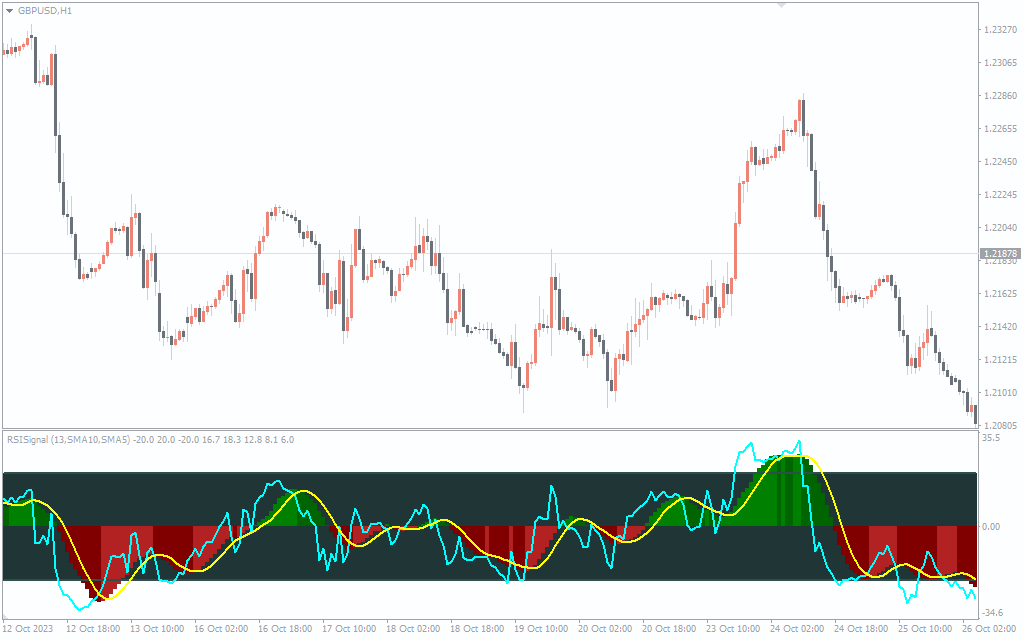
On our website you can download for free such popular RSI MT4 indicators as Color RSI With Alert, Two Period RSI, Improved RSI Signal.
 Functions and Features of the RSI Indicator
The RSI undergoes meticulous mathematical computations, factoring in average gains and losses over a predetermined period, often the standard 14 periods. This indicator operates on a scale of 0 to 100, with levels typically marked at 70 (overbought) and 30 (oversold). These delineated thresholds play a pivotal role in deciphering possible market conditions and anticipating shifts in price.
How the RSI Indicator Can Be Used by Traders
When the Relative Strength Index breaches the 70 mark, a clear signal emerges: the currency pair is overbought. This signifies that prices have surged significantly and a pullback in prices is likely to follow. Overbought conditions often prompt traders to exercise caution, evaluate their positions, and anticipate a potential market correction. Conversely, when the RSI falls below 30, the currency pair is deemed oversold, implying an impending price bounce.
Divergences manifest when the Relative Strength Index and the price of the currency pair take contrasting paths, moving in opposite directions. This can be a significant indicator for traders, highlighting a potential shift in the prevailing market trend or momentum. This is a strong signal that a potential trend reversal is on the horizon, assisting traders in making timely trading decisions.
 Indicator Settings Description

Typically set at 14 periods, traders retain the flexibility to tailor this timeframe to align with their trading approach. Overbought and oversold levels conventionally rest at 70 and 30, respectively. However, savvy traders can fine-tune these levels based on their risk tolerance and astute market analysis.
The Relative Strength Index emerges as an indispensable tool for Forex traders, furnishing vital insights and empowering well-informed decision-making within the market. By gauging the vigor and pace of price shifts, it offers crucial cues on potential trend reversals, enabling traders to make calculated choices. Utilizing the RSI effectively, traders can set appropriate entry and exit points, manage risks, and ultimately enhance their trading strategies in the complex and competitive world of Forex trading.


Leave a Reply