
Best Indicators For Day Trading – Top 10 Indicators For MT4
Forex day trading is the most popular method of retail forex trading. Institutional and long-term forex traders provide substantial volume to the forex marketplace and act as potential market movers. On the other hand, day traders include scalpers and short-term traders who open and close positions within the same day to benefit from price fluctuations.
Day traders form a major part of the retail forex traders. Nowadays day trading arena is flooded with automatic trading systems or forex robots. Day traders enhance liquidity, the essential component of the forex trading market. Since the day trader aims to enter and exit the markets multiple times a day, they mostly tend to capture a small trending move in the market.
Since day traders look to benefit from small price movements, they employ intraday price charts ranging from 1 minute to 1 hour. Although, day traders look at the daily, weekly, and monthly price charts to identify the trend direction, support, and resistance levels. They primarily use the lower time frame charts to zoom into and locate the best entry point.
The important goal of a day trader is to identify the best entry point. On this quest, forex day traders apply many aggressive trading strategies which may not be the favorites of institutional or long-term traders.
In this article, we will look into the top 10 best indicators for day trading that are popular in 2022. This compilation consists of indicators that help in the technical analysis of day trading. The indicators take into consideration of various factors like volume, support resistance, and Fibonacci levels. Elliot waves, Keltner channels, Pivot Points, and price action to name some.
Let’s dive in and look at the indicators and understand how they help the day traders to formulate technical trading strategies and assist them in making profitable forex trading decisions.
Top 10 Indicators For Day Trading
- Volume Profile Indicator
- Lucky Reversal Indicator
- Buy Sell Magic Indicator
- Auto Support Resistance Zones Indicator
- Currency Power Meter Indicator
- Fibonacci Retracement Indicator
- Elliott Wave Count Indicator
- Order Block Breaker Indicator
- Keltner Channel Indicator
- Pivot points All In One Indicator
Volume Profile Indicator
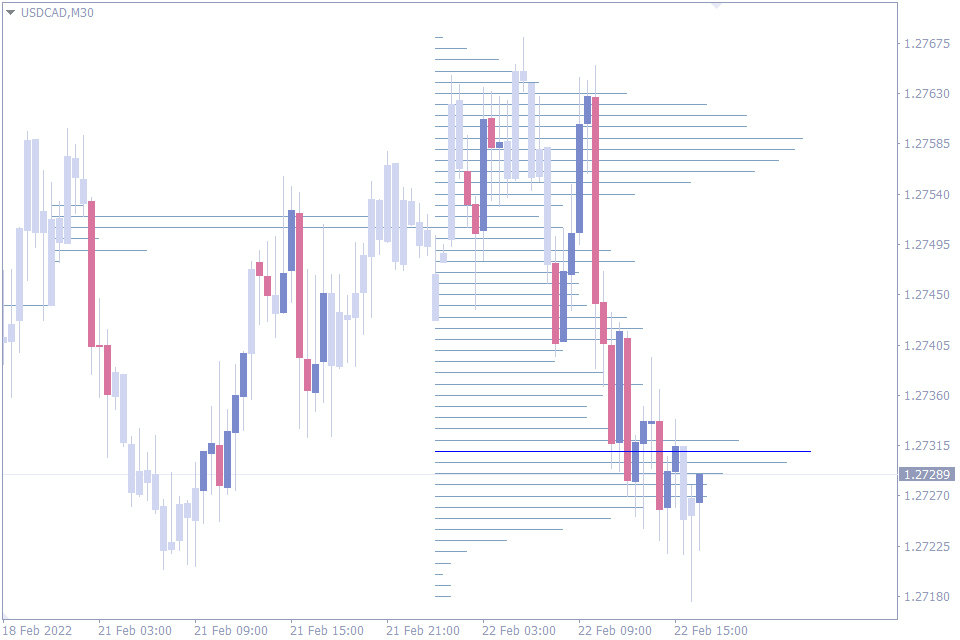
Let’s look at the first indicator of our list. The Volume profile indicator exclusively relies on the trading volumes to identify and plot the potential price reversal points. Furthermore, this indicator calculates the peak volume levels and plots the Volume Point of Control VPOC or simply known as the point of Control POC.
The VPOC or POC acts as an important support and resistance level. In general, volumes increase substantially during a price reversal and breakouts. So, forex traders look for these POC levels and look for increased trading volume to identify the best entry and exit points.
There are many trading strategies that identify areas of high and low volumes. These high-volume trading areas act as potential trend reversal zones act as future potential support and resistance levels. So, traders can identify the future support and resistance levels by extending the current levels.
Due to the fact that the POC levels act as reversal points. Forex technical traders use the POC levels to identify the best stop loss points and take profit points. Moreover, the indicator plots lines and bars for easy visual identification of these areas where the price is expected to retest.
Additional confirmation of the price reversal from these POC levels can be achieved by looking at the price action at these levels. For best results, forex traders who use trading volumes can use the visual clues of this indicator and trade profitably.
Lucky Reversal Indicator
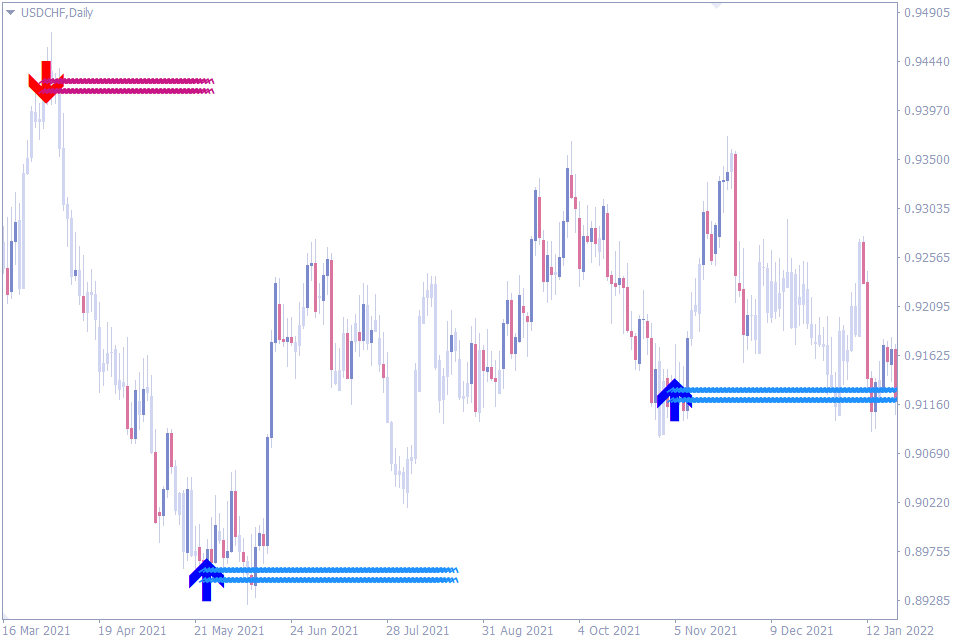
The second indicator on our list is a trend following indicator which signals trend reversals. The Lucky reversal indicator simplifies the trading by providing bullish and bearish arow trading signals. So, the indicator helps new and advanced forex traders to buy and sell using the trend reversal levels.
The signals are easy to interpret, a blue arrow marks the beginning of a bullish price reversal. On the other hand, the red arrow marks a potential bearish trend reversal point. Additionally, this MetaTrader indicator plots wavy horizontal lines beside the Buy and Sell arrow trading signals.
Another special feature of this indicator is the appearance of white squares. These white squares suggest a temporary price correction or a potential reversal of the trend. This special feature alerts of an impending price reversal, so traders can take advantage and plot bullish or bearish forex trading strategies accordingly.
This MetaTrader4 indicator signals potential reversal signals in advance. So, forex traders can prepare themselves to place trades if this potential reversal signal gets confirmed to a trading signal. The Lucky reversal indicator plots a white square as a potential reversal signal. This white square changes to a Sell or buy trading signal once the signal is confirmed.
According to the trading position, traders can place the stop loss above or below the horizontal wavy lines. Traders can book their profits at an opposite trading signal or with a good risk-reward ratio.
To summarize, the Lucky reversal indicator is quite helpful for forex traders to identify the trend reversal levels with simple arrow-based buy and sell trading signals.
Buy Sell Magic Indicator
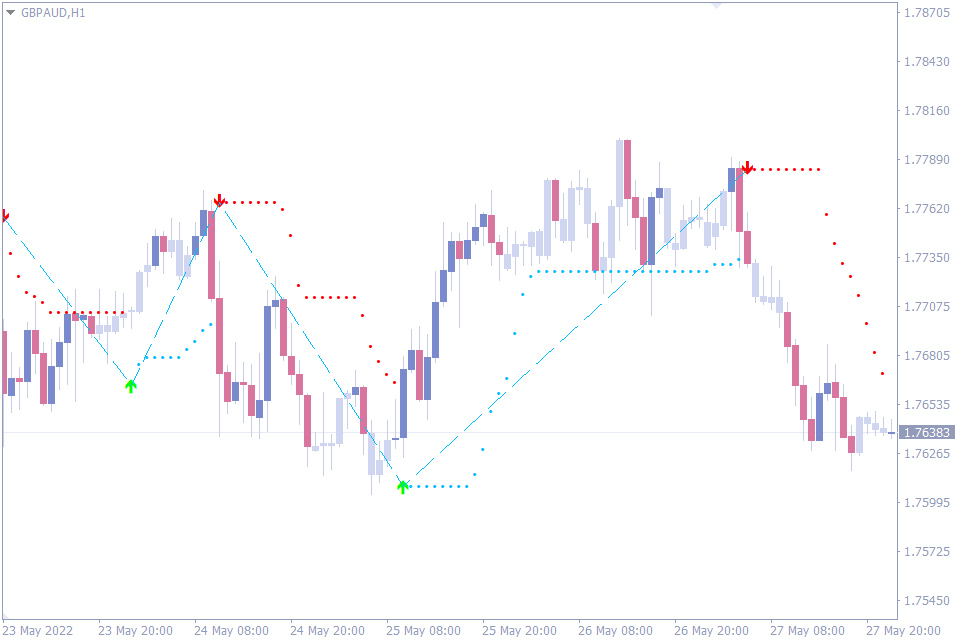
The third in the list of best indicators for day trading is the Buy Sell Magic indicator. The indicator plots the buy and sell signals as arrows on the price chart. Moreover, it provides you with the best stop loss point. The indicator is a trend following indicator and spots the trend reversal points which act as entry and exit points.
Another important feature is that the indicator does not repaint the arrow signals. The signal does not repaint once the signal candle closes. And is well suited for new and advanced forex traders. Additionally, the indicator works well in lower time frame charts on all currency pairs and is well suited for intraday forex traders.
Forex traders can enter the market with a Buy position upon a green arrow signal. The stop loss is just below the grey dotted line. The best profit booking strategy is to exit the trade at an opposite trading signal.
Similarly, once the indicator plots the red arrow it indicates a bearish trend reversal signal. So, forex traders can place a Sell trade with a stop loss above the grey dotted line. To maximize the profits and ride the trend, technical forex traders can hold their positions and exit at an opposite trading signal.
In summary, the Buy Sell Magic indicator is a simple arrow-based non-repainting day trading indicator.
Auto Support Resistance Zones Indicator
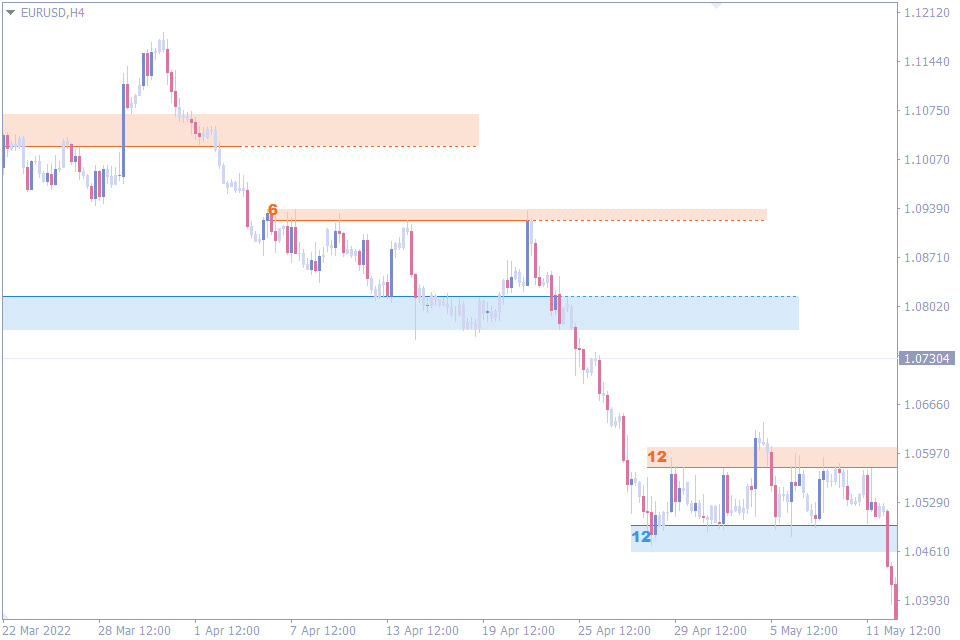
Now, let’s look at the fourth indicator on our list and understand the reason behind the success of this day trading indicator. The Auto support and resistance zones indicator automatically looks for support and resistance zone and plots them. This helps the new and advanced forex traders to match the manual and auto support and resistance zones for additional confirmation.
Most technical forex traders will agree that support and resistance levels are the building blocks of technical analysis. The auto support and resistance zone indicator take it one notch higher by using the fractals to identify the support and resistance levels. Thereby, this MetaTrader day trading indicator combines the fractal theory with support and resistance.
The indicator plots the resistance levels in red and the support levels in blue. The indicator plots the support and resistance levels based on the number of fractals at that level. The higher the number of fractals present in a level, the stronger the level becomes.
During a ranging market, traders can easily identify the range using the auto support and resistance level. Once the range is identified traders can place a buy or sell trade accordingly. On the other hand, traders can place trades in the direction of breakout too.
Thus, the indicator helps the forex traders by automatically plotting the support and resistance levels.
Currency Power Meter Indicator
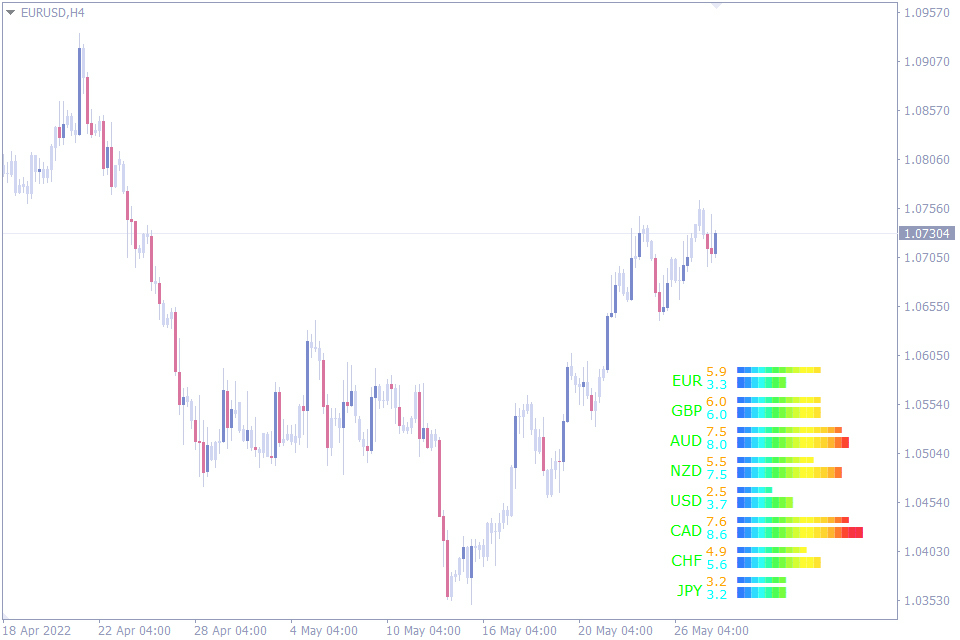
The fifth indicator on our list for best day trading is the Currency power meter indicator. The currency power meter helps the forex trader to assess the individual strength of currency rather than the strength of a currency pair.
This MetaTrader indicator is for technical forex traders who pit the strongest currency against the weakest currency. Traders form a currency pair by combining a strong currency and a weak currency. The resulting trade correlates to the theory of currency trading of selling the weak and buying the strong.
The currency power meter indicator can be used as a stand-alone technical indicator. The indicator reflects the underlying strength or weakness of the currency but is prone to fluctuations from fundamental factors. So, forex traders should avoid using the indicator during news releases.
Since the currency power meter indicator provides the basic understanding of the strength of the currency. So, technical forex traders can use other technical tools and look for precise entry points in the direction of the currency strength and trade with confluence.
The indicator plots a wide and narrow histogram per currency. The wide histogram shows the currency strength on a daily chart, while the narrow one indicates the strength in any desired chart time frame. So, traders can combine this information to identify the strength in a snap.
The currency power meter indicator suits well for new and advanced forex traders and is an essential tool for forex traders using the currency strength for trading decisions.
Fibonacci Retracement Indicator
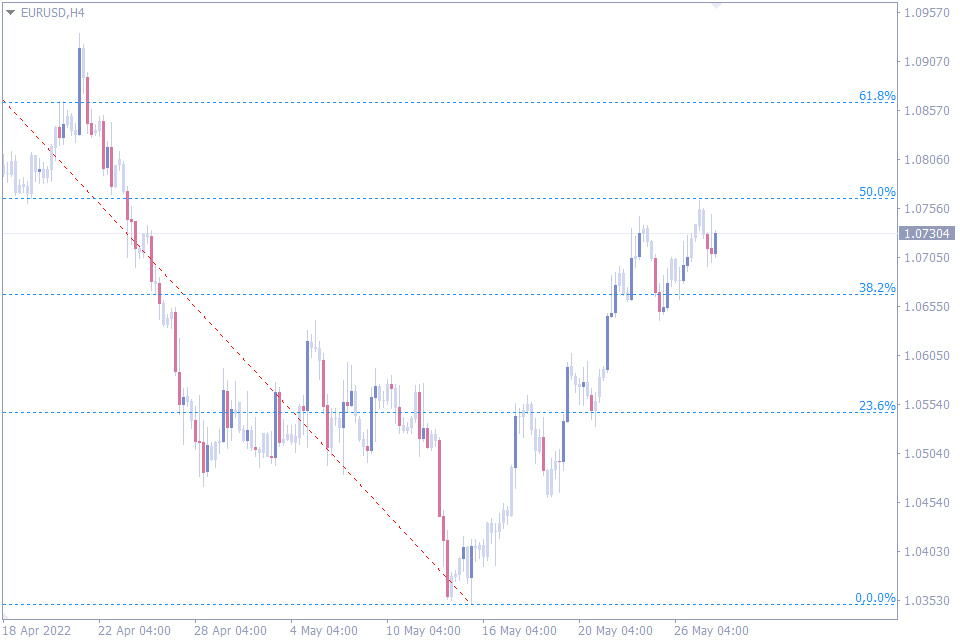
Now let’s move on to the sixth indicator of this list of best indicators for day trading. The Fibonacci retracement indicator applies Fibonacci levels for calculating the best entry point during a retracement. Fibonacci levels are applied in technical analysis and are appreciated by most forex day traders for providing support and resistance levels.
The indicator plots the Fibo levels automatically on the price chart. The Fibo levels help the forex trader to identify the potential level the price will retrace before it reverses and resumes in the direction of the initial trend. The Fibonacci levels act as the best pivot points for the price to reverse. Thus, providing the forex trader with the best entry point.
The best retracement levels are 50% and 61.8% based on the strength of the pullback. These retracement levels will be stronger if they occur near trend lines, channels, or established resistance and support zones. In general, a deeper pullback will result in a better price movement in the initial trend direction.
The Fibo levels above or below the entry points act as stop loss and take profit levels. Moreover, the indicator can be applied to all intraday price charts and helps the traders to identify the best day trades. Additionally, the indicator can support the forex trades on scalping, day trading, and long-term trading.
To summarize, this indicator identifies the best day trading entry point, stop loss, and take profit points based on mathematical calculations to eliminate ambiguity.
Elliott Wave Count Indicator
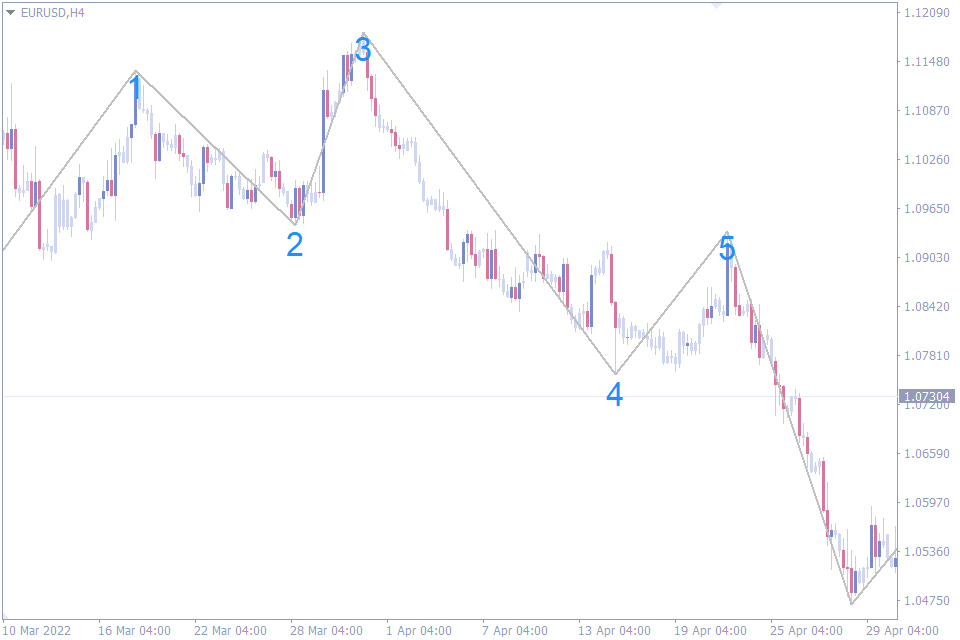
Our seventh indicator in our list applies the Elliott wave to identify the potential entry points for day trading. The indicator uses the classic Zigzag MetaTrader indicator for identifying the waves. The Elliott wave count indicator visually plots the number of the waves.
Once the Elliott wave count indicator plots the numbers, forex traders can apply the Elliott wave theory. Forex traders can identify the progressive and impulsive waves and prepare the entry points, stop loss and take profit points accordingly.
For best trading results, forex traders can combine the Elliott waves with Fibonacci levels. Both indicators are based on famous mathematicians and support each other. The Elliott wave indicator works on all intraday time frames. However, forex traders should use price action to confirm the entry signals.
The indicator may not be suitable for new forex traders as it requires a basic understanding of Elliott’s wave theory.
Order Block Breaker Indicator
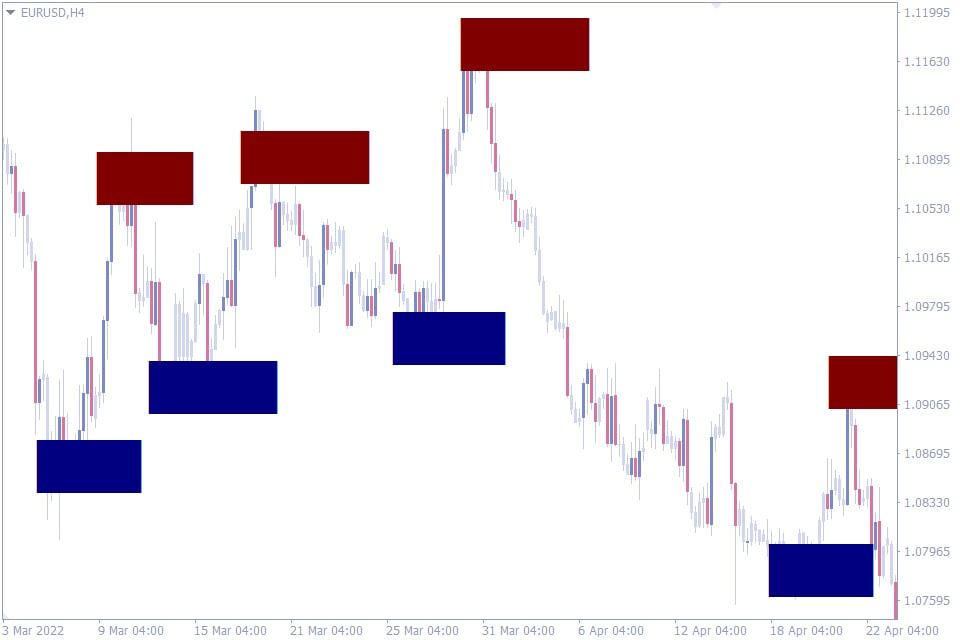
Our next indicator in the list helps retail forex traders to identify the potential entry zones of institutional traders. The order block breaker indicator automatically scans and plots the potential order block zones. Additionally, the indicator helps forex intraday technical traders to stay in the direction of the institutional traders and benefit from profitable trades.
An order block is where institutional traders split their large orders into small executable sizes. These smaller order sizes are easy to execute and do not disturb the forex marketplace. A bearish candle before the bullish move is a bullish order block. Similarly, a bullish candle before the bearish move is a bearish order block.
So, forex traders can enter the market in the direction identified by the order block breaker indicator. In general, order block trading has a risk-reward ratio higher than 1:3 as the stop loss is relatively smaller. So, order block trading requires precise entry points and requires patience.
This trading strategy requires additional confirmation of the price reversal using price action.
Keltner Channel Indicator
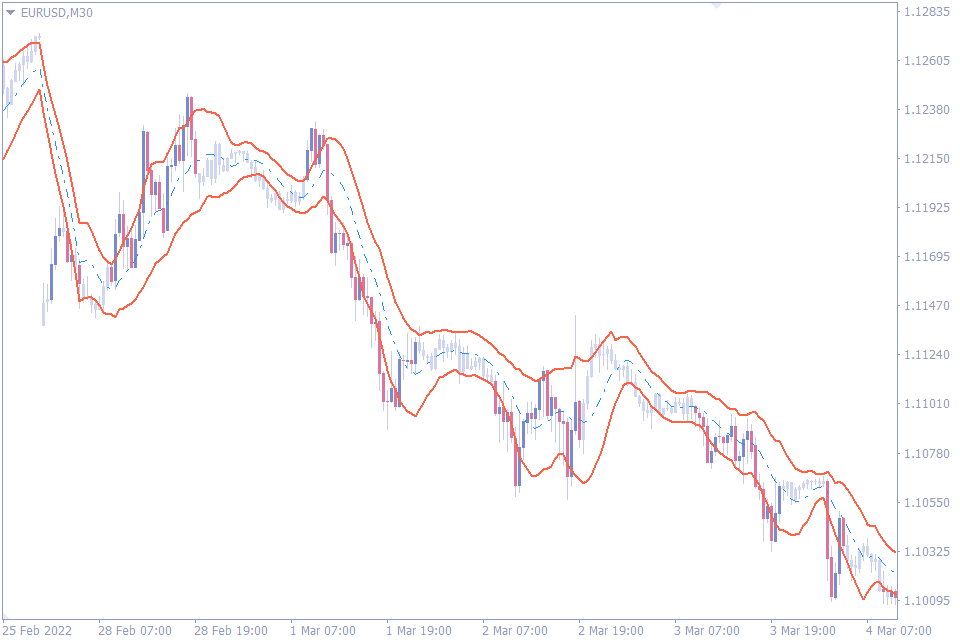
Now we will discuss the ninth indicator in our list of best day trading indicators. The Keltner channel indicator simplifies trading, it has an upper and lower band and a mid-band. The mid-band is calculated using EMA, while the upper and lower bands are calculated using EMA and the ATR values.
The Keltner channel indicator is very helpful for trend following. If the direction of the channel is up, it indicates a bullish price trend. Similarly, in a downtrend, the direction of the channel is down. Generally, price tends to stay within the bands. So, forex traders can combine the direction of the channel and also the relative position of the price within the channel to identify the entry points.
In effect, the bands of the Keltner channel act as dynamic support and resistance. The bands act as trailing stop loss and help forex traders to hold positions and ride the trend.
Pivot points All In One Indicator
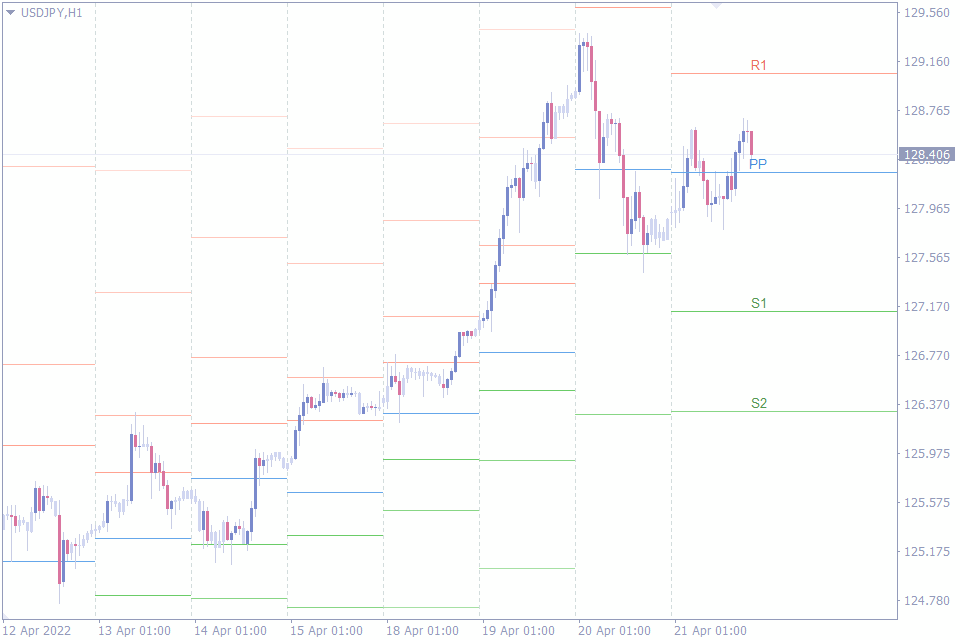
The final indicator on our list is based on pivot points. The Pivot points all in one indicator automatically calculates and plots the pivots on all intraday price charts. Pivot points act as support and resistance levels based on the previous day’s market movement.
Though there are various methods for pivot point calculation, they use the high, low, open, and closing values for basic pivot calculation. The indicator plots up to 4 levels of support and resistance from the pivot level automatically, eliminating the need for calculating manually.
If the price is above the pivot, the trend is bullish. Similarly, the trend is bearish if the price is below the pivot. However, if the price reaches the extreme levels of support and resistance at level 3, the price is expected to reverse due to overbought or oversold conditions.
Forex traders should confirm the price reversal using candlestick patterns, price action, and other technical indicators. The pivot levels above and below the entry points act as stop loss and take profit levels.
Conclusion
The above list provided the best indicator for day trading. Forex traders should practice them in demo before applying in LIVE trading accounts. Though most of the indicators can be used stand-alone, for best trading results forex traders should trade in confluence with multiple indicators.


Leave a Reply