

xMaster Review — good, old, reliable, makes sense
Say, you don’t want to overpay for TradingView Pro yet, but want to test out a reliable indicator. Traders Union has you covered — read to find out more about xMaster Formula Indicator, how it works, which traditional indicators it combines, what are its limitations and how to use it properly.
What makes up the xMaster Formula Indicator?
The indicator we’re talking about is called xMaster, but some people name it xHMaster — just a regular naming confusion. Not to be confused with other project, which has nothing to do with trading. For the record — here and further this article refers to xMaster Formula Indicator. It comes in two flavours — as TradingView script and as Metatrader MT4 and MT5 package. In this article we’ll discuss both types of xMaster Formula Indicator.
Initially, xMaster Formula Indicator was made for the Metatrader MT4 Trading Software System in the late 2010ies, but then folks made it open source for TradingView. Later on, it was adapted for a newer Metatrader version, and is available for Tradingview, MT4 and MT5.
xMaster Formula Indicator combines 5 different indicators:
- EMA, or exponential moving average to track price changes over a long, medium and short periods and combine them into a single dataset. It’s advantage over SMA — simple moving average — is the use of recent data, such as latest prices;
- MACD, or Moving Averages Convergence/Divergence, uses a set of EMAs to determine strength and direction of the trend in question. It is a good old school indicator, reliable on daily and weekly timeframes, but weak for 1-hour candles;
- RSI, or Relative Strength Index, another old school indicator made in 1978 used to determine strength and probability of trend change. In xMaster Formula Indicator, the RSI is used to enhance its accuracy.
- Parabolic SAR, also known as Parabolic Stop and Reverse price indicator — useful for determining TP/SL limits for a given order. It shows just as high or as low a price can get and if a candle moves past the Parabolic SAR prediction, it assumes the trend has changed and calculates the maximum upper or lower price for the next candle. In xMaster Formula Indicator, Parabolic SAR is used for risk management purposes.
Stochastic Oscillator, old school, made in 1950ies, used to determine if the stock is oversold or overbought — much like the Bollinger Bands — over the 14 day period.
From the set of indicators we can tell the limitations of the xMaster Formula Indicator:
- It relies on huge amounts of historical data to work properly, and won’t help with a stock that is 1 to 5 days old;
- It will work best on medium to long timeframes — 3H, 6H, 12H, 1D to 1W — and won’t be as helpful on 1H timeframes as the underlying indicators rely on historical data. The higher the time resolution, the better;
- It is fine-tuned for predictable markets with historical records of known volatility movements, such as currency pairs, stocks, metals, Forex, bonds, shares and spot market;
- Like all indicators, it can produce false positives you have to filter out by yourself;
- It uses different flavours of moving averages, which take into account past prices and aren’t good at predicting price movements during rapid volatility events;
- Built-in SAR helps to determine TP/SL, but it won’t predict them;
- Rapid price movements aren’t covered by xMaster Formula Indicator — flash crashes, short squeezes or rapid consequent long liquidations are still natural forces of the market you have to account for.
xMaster combines 5 old school indicators into one powerful tool, but it has its limitations.
xMaster Formula Indicator vs Other Indicators and which one is the best?
Better to ask which ones you can combine the xMaster Formula Indicator with. At its core, the xMaster is a blend of EMAs, MACD, P. SAR, Stochastic and RSI, so naturally — it outperforms them by using combined accuracy of 5 different indicators. Therefore, you can look up non-standard indicators to pair it with.
What indicators can you combine the xMaster Formula Indicator with? Suppose, you want to filter as much noise, as possible — here are two options:
- Market Structure Break, or MSB — a useful tool to confirm strong support and resistance levels of the asset in question, it tracks where price breaks out of trend and labels the corresponding level in the proper colour — red or green.
- Ichimoku Cloud, developed in 1930ies by a Japanese financial journalist to take a single look at the asset and get as much information as possible.
By using both, MSB and Ichimoku you effectively account for weaknesses of in-build indicators that come in xMaster Formula Indicator: MSB helps to determine strong support and resistance levels and double-confirm the SAR readings, while Ichimoku shows where MACD fails and helps to filter out possible misses in your trading strategy. Furthermore, Ichimoku is helpful for volatile assets, as it plots maximum expectable support and resistance levels of the asset even at 1H timeframes. By using MSB and Ichimoku, together with xMaster Formula Indicator you can bridge the gap and enter 1H timeframe much safer, as well as get better readings at 3H and 6H timeframes for long strategies.
How can you filter out false positives from xMaster Formula Indicator with the Ichimoku and MSB?
- xMaster Formula Indicator + Ichimoku = helps to filter buy and sell signals with Lagging Span and Kumo Cloud twists. When price comes to hit the Kumo cloud from above, but xMaster gives off a BUY signal it may indicate a false positive. Same goes when price aims to collide with Lagging Span, which indicates it is safer to consider the reversal of trend before opening any position;
- xMaster Formula Indicator + MSB = helps to confirm buy and sell signals by showing the most probable high density support and resistance levels. If xMaster gives a signal too close to red resistance level it is best to set up a SL at 10% loss ratio and TP at 20% — this could help to remain in position if the price breaks through the strong level, but will secure you if the price does the opposite and lags back;
How accurate is the xMaster Formula Indicator?
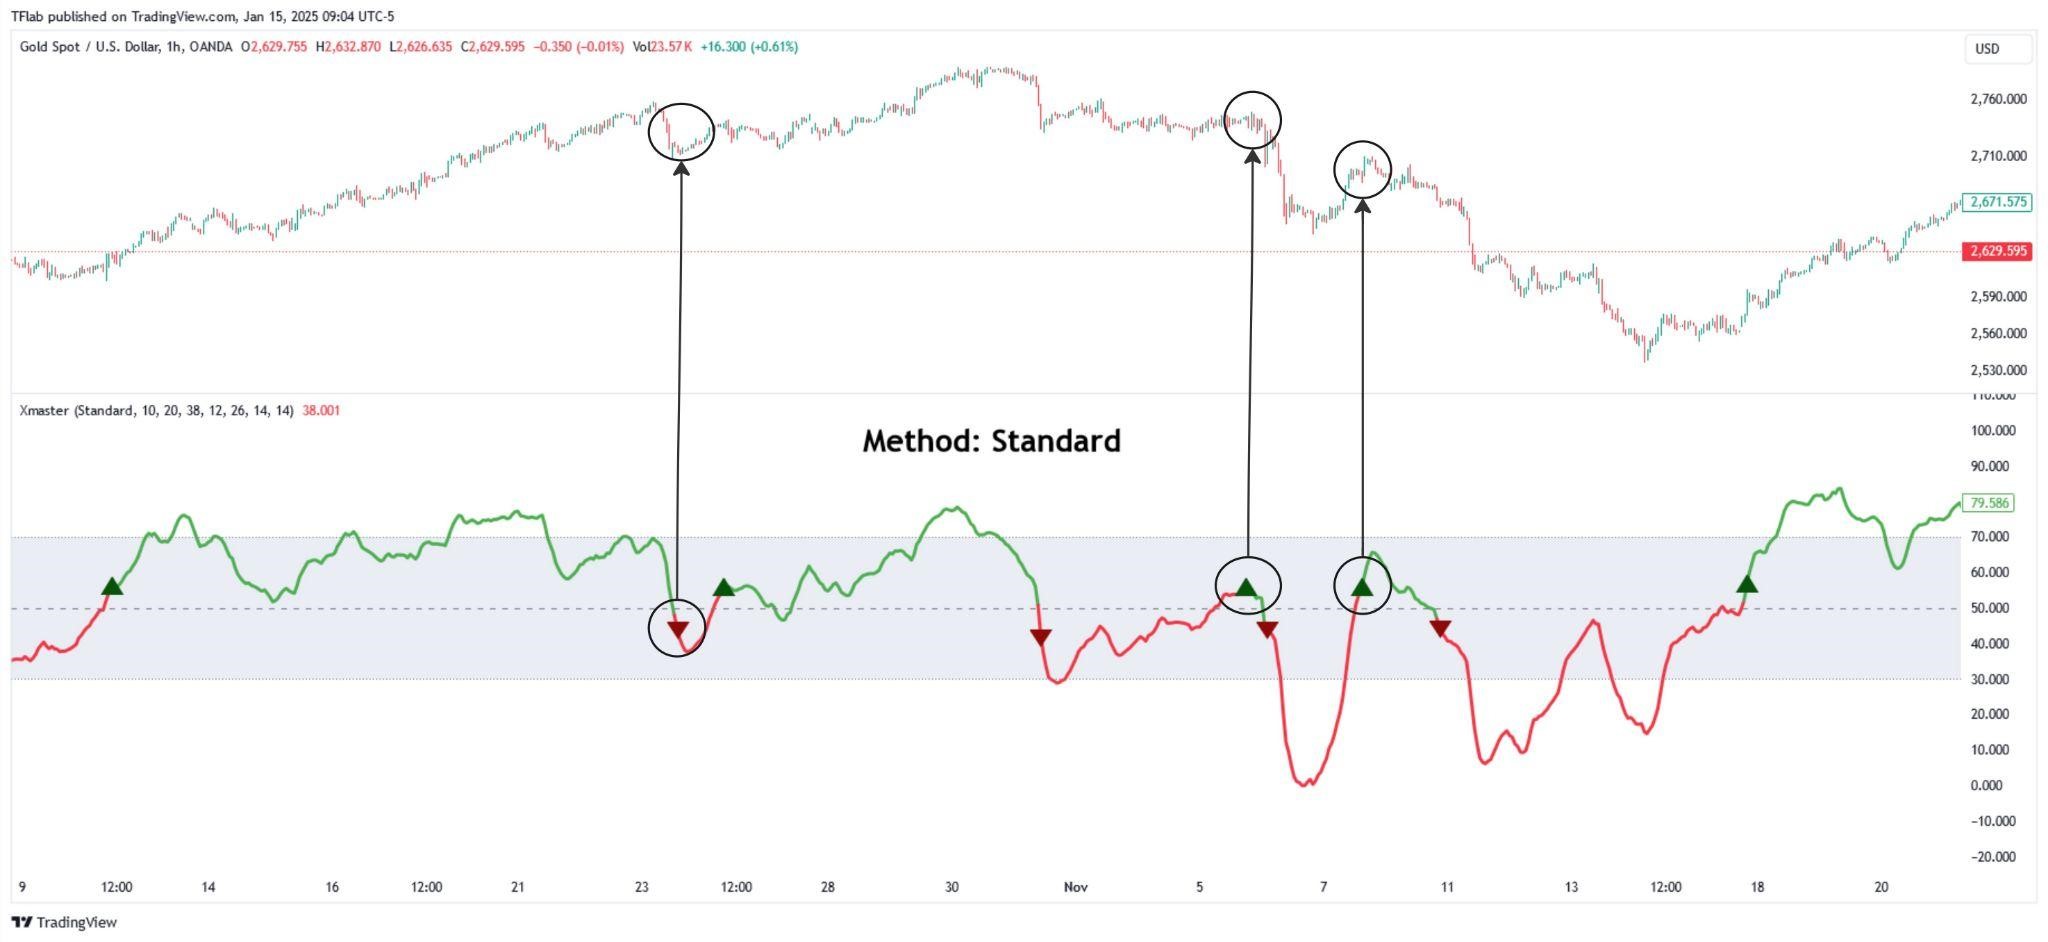
Here are the limitations of xMaster Formula Indicator: out of 9 predictions made, it hits 6 times and misses 3. Same is confirmed on Crypto, such as BTC/USDT — the xMaster Formula Indicator can give off lethal false positives, so you have to double-check your readings before opening a position.
Check the chart and look for both — good and bad signals, the bad ones are labeled out, but can you find all the good ones?
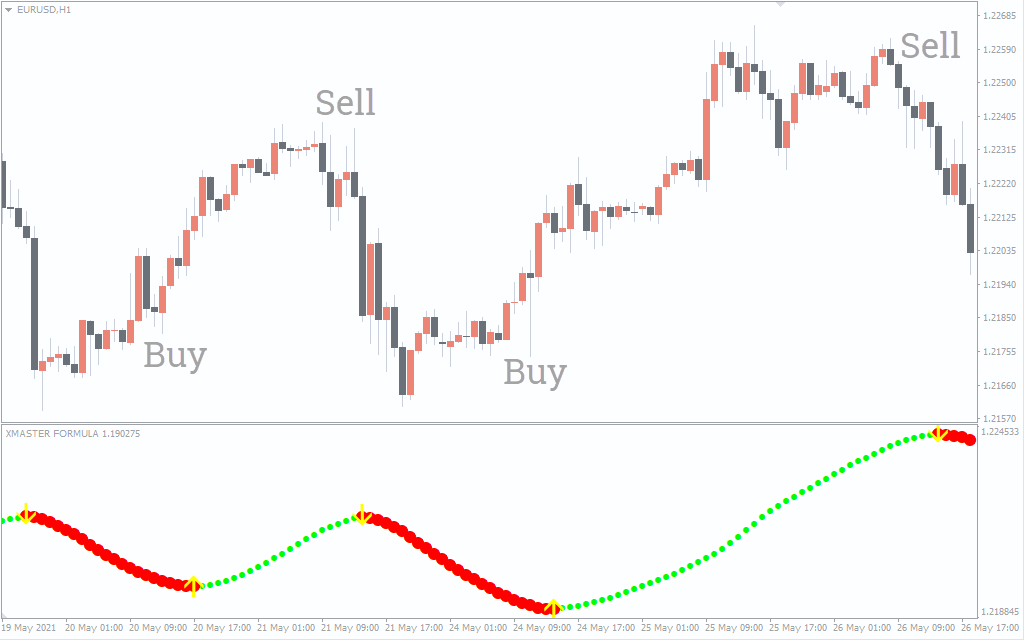
How different is the Metatrader xMaster Indicator?
Simple as «Buy low, sell high». Yellow arrows indicate when you should place the order; green and red dots label out the trend correspondingly and tell you when it is safe to enter the market. You enter when the trend twists its direction, and exit as early, as you notice the trend reversal on the xMaster Formula Indicator chart. If you’re one the conservative side of things you can exit as soon as trend indicator crosses the middle line given the entry point gives you any profit.
What is the best strategy with the xMaster Formula Indicator?
- At first, when you are just starting to learn the ends of the tool, begin with simple assets — metals — and once you can reliably filter out false positives move on to currency pairs;
- Using leverage is not advised if you’re just starting to learn the new tool, even if singlas look to be clear;
- For the best results combine xMaster Formula Indicator with basic resistance and support levels which you can determine by hand, and work from there.
Can xMaster Formula Indicator Improve your Forex performance?
Given you account for false positives and pair it with a suitable indicator you can rely on — it can definitely help you out with getting good trades both, with TradingView and Metatrader MT4 and MT5. Best suited for currency pairs and conservative assets, xMaster — with some practice — can help you reel out profit out of the market. There is no guarantee — as no indicator is the silver bullet — that your trades will 100% land on the best spots, as the nature of the market is too unpredictable.
Is XMaster Worth It? Traders’ Reviews & Insights
Yes, xMaster takes best from the old school indicators and combines them into a single powerful tool to filter out market noise and find the best moments to enter and exit the deal. It is worthwhile for those who are yet to buy Tradingview Pro as it packs 5 into 1, leaving space for one more indicator to help beginners to double-confirm.
For the advanced traders, xMaster Formula Indicator can help out to support tools you already know and use, and provide insights into the best placing for a position.
Where to download xMaster Formula Indicator for MT4 and MT5?
Where to find xMaster Formula Indicator for Tradingview?
- Use this link: https://www.tradingview.com/script/ghYlynnf-Xmaster-Formula-Indicator-TradingFinder-No-Repaint-Strategies/
FAQ
Are xMaster and xHMaster Formula Indicators the same thing?
Yes, xHMaster is a common typo for xMaster.
Is xMaster Formula Indicator bulletproof?
No, it still can occasionally give false positives, as with all indicators. Always use a backup indicator, price levels and your own cold head to judge if the signal you’re seeing is a clear hit or a miss.
Can xMaster Formula Indicator improve your trading results?
Yes, it will help you out to make more hits and less misses, but it still requires some knowledge of what you’re doing and how it can or cannot play out.
Should you pair xMaster Formula Indicator with other tools?
Yes, you can filter out false positives by using Ichimoku and/or Market Structure Break (MSB). It won’t make the xMaster a silver bullet, but will help you make less misses during your trading.


Leave a Reply