

Can Currency Strength Indicators Replace Traditional Pair Analysis in Forex Trading?
For decades, forex trading has focused on the analysis of individual currency pairs. Traders traditionally focused on chart patterns, economic news, and technical indicators tied to one pair at a time. Recently, however, currency strength indicators have been increasingly adopted by both retail and institutional market participants. These technical tools measure a currency’s overall strength or weakness against multiple counterparts simultaneously, offering a broader market perspective. Modern trading platforms now include real-time strength meters, heat maps, and correlation dashboards that simplify this process. While pair analysis remains crucial for most traders, these additional analytic tools are finding a structured place in the market.
What Are Currency Strength Indicators?
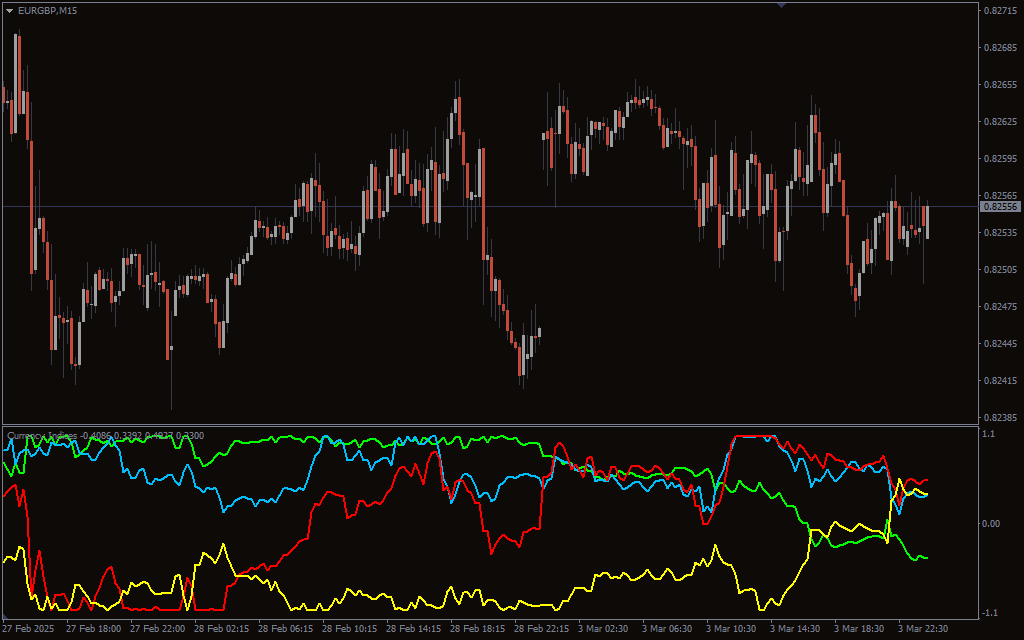
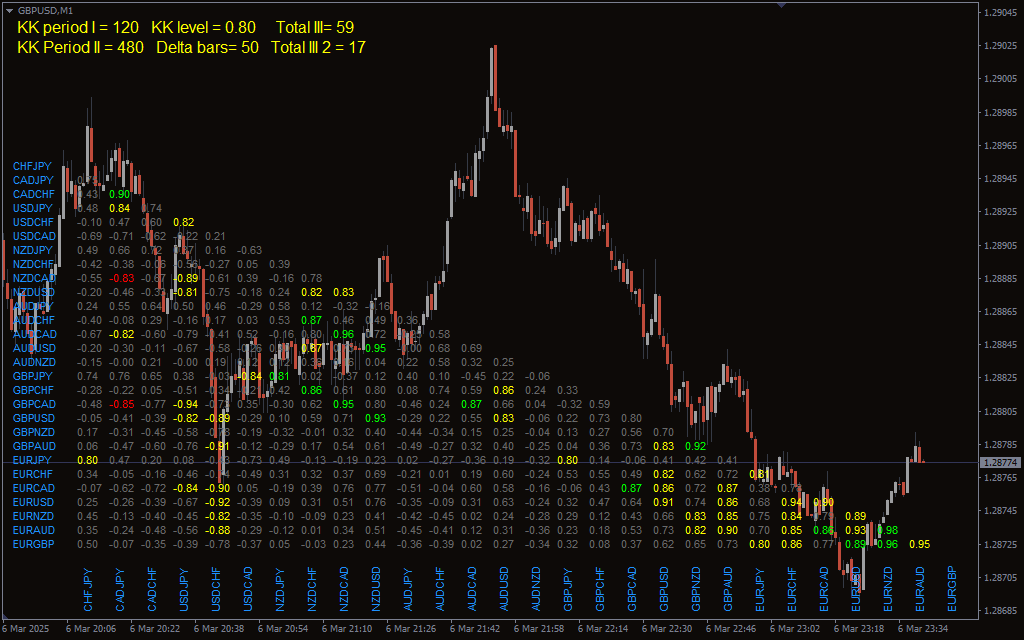
These technical instruments are designed to measure how strong or weak a currency is relative to other major counterparts in the forex market. Instead of focusing on isolated pairs, they evaluate multiple forex markets simultaneously. The underlying software engines most often use a combination of 28 major currencies, including USD, EUR, GBP, JPY, CHF, CAD, AUD, and NZD. Some market gauges focus on relative strength, comparing one currency directly against others, while alternative models calculate absolute momentum or percentage changes across several pairs. Visual instruments like strength meters and heat maps present these metrics clearly, allowing participants to make data-driven choices. These systems rely on moving averages, momentum calculations, or price change percentages over selected timeframes. The goal is for traders to spot trending assets, filter trade opportunities, reduce exposure to weak setups, and understand broader macroeconomic forces.
 Why Traditional Pair Analysis Still Dominates Forex Trading?
Trading pairs remain the primary framework for forex analysis, even with the popularity of asset evaluation tools. The traditional approach provides granular information about individual currencies, examining specific structural factors such as support and resistance levels, candlestick patterns, volatility cycles, and direct reactions to economic data releases. All of these details allow traders to make highly specific execution decisions. Each forex pair possesses unique characteristics that generalized valuation dashboards cannot fully capture. For instance, GBP/JPY is structurally volatile, while EUR/CHF is highly sensitive to Swiss National Bank policy decisions. Commodity prices and regional economic activity heavily influence specific pairs, such as the relationship between iron ore and the AUD/USD. Pair-specific analysis also helps market participants identify precise entry and exit points, focusing deeply on the specific macroeconomic divergence driving the relationship between two nations.
The Role of Blockchain and Digital Assets
Distributed ledger technology has introduced a variety of structural developments to the financial markets since its inception. Beyond serving as speculative assets, digital currencies and underlying cryptographic networks have altered transactional infrastructure. According to architectural analyses from platforms like Webopedia, decentralized protocols utilize cryptographic consensus mechanisms that manage transactions without relying on a central authority. This framework allows data and value to be securely transferred internationally while reducing traditional operational friction and localized database vulnerabilities. At the same time, the introduction of fiat-pegged stablecoins has established a functional bridge between digital asset networks and traditional foreign exchange infrastructure. Numerous modern financial platforms utilize stablecoins as a settlement asset, providing a cross-border framework that operates independently of conventional banking hours. The integration of stablecoins facilitates near-instantaneous transfers and around-the-clock liquidity management, representing a significant shift in how capital movement can be structured across diverse market environments.
The Advantages of Currency Strength Indicators
Traders who monitor multiple environments simultaneously can leverage the advantages of multi-currency comparative tools, effectively reducing localized tunnel vision. Instead of focusing on a single pair, market participants can instantly observe which assets are gaining or losing momentum across the broader international landscape. Macroscopic market analysis is also simplified with these relative metrics. Traders do not need to check dozens of individual charts to identify the strongest and weakest assets in real time. Trend followers, scalpers, and multi-pair operators looking for high-probability setups benefit significantly from this comprehensive structural view. Furthermore, comprehensive strength analysis helps traders avoid excessive exposure to underlying correlations. For instance, participants heavily exposed to multiple USD-related positions can quickly identify concentration risks through these macro evaluation dashboards, helping them better manage long-term portfolio dynamics.
Where Currency Strength Indicators
Fall Short There are also critical systemic limitations inherent to these analytical instruments that traders must consider. One major structural weakness is that most strength calculations operate as lagging metrics, relying entirely on historical price action rather than predicting future directional movement. By the time a specific asset registers as mathematically strong, a significant portion of the market move may have already concluded. Additionally, different algorithmic platforms employ disparate mathematical formulas. Some models prioritize raw momentum while others emphasize moving averages or volatility-adjusted calculations. Consequently, data discrepancies can occur, potentially confusing users who lack a deep understanding of the platform’s underlying methodology. These relative indices can also struggle during range-bound conditions, periods of low liquidity, or unexpected geopolitical events. An asset may register as fundamentally robust on a dashboard, only to experience rapid depreciation due to an immediate central bank intervention or unexpected economic report. Most professional operators, therefore, utilize these indicators as secondary confirmation mechanisms rather than standalone decision-making systems.
The Hybrid Approach: Why Most Traders Use Both
As with most market intelligence utilities, the majority of professional users adopt a hybrid methodology that integrates the distinct advantages of both systems. A typical analytical workflow commences with a macro strength dashboard to filter the broader market and isolate potential anomalies or emerging trends. Operators then transition to individual currency pair charts to evaluate granular technical structures, localized volatility conditions, and relevant macroeconomic contexts before executing a position. For instance, a trader may observe a strong bullish divergence in the Japanese Yen alongside systemic weakness in the British Pound via a strength meter. The subsequent analytical step requires mapping support zones, analyzing candlestick formations, and reviewing upcoming economic calendar releases on the GBP/JPY chart specifically. This combination of top-down scanning and bottom-up validation is also increasingly integrated into automated algorithmic strategies, representing a growing standard in institutional workflows.
To sum up
In summary, currency strength indicators offer valuable macroeconomic overviews and aid in identifying systemic trends across foreign exchange markets, yet they do not possess the granular capability required to fully replace traditional currency pair analysis. The lagging nature of generalized strength metrics and their vulnerability to sudden volatility shifts necessitate a disciplined approach. Therefore, isolated pair analysis remains foundational for determining precise market entries and risk parameters. The evidence suggests that optimal analytical efficiency is achieved through a integrated hybrid model, utilizing macro gauges for broad asset selection and detailed chart analysis for tactical execution.


















Leave a Reply