

How to Make Better Trade Entries With Candlestick Patterns
Why Candlesticks are Crucial for Better Trade Entries
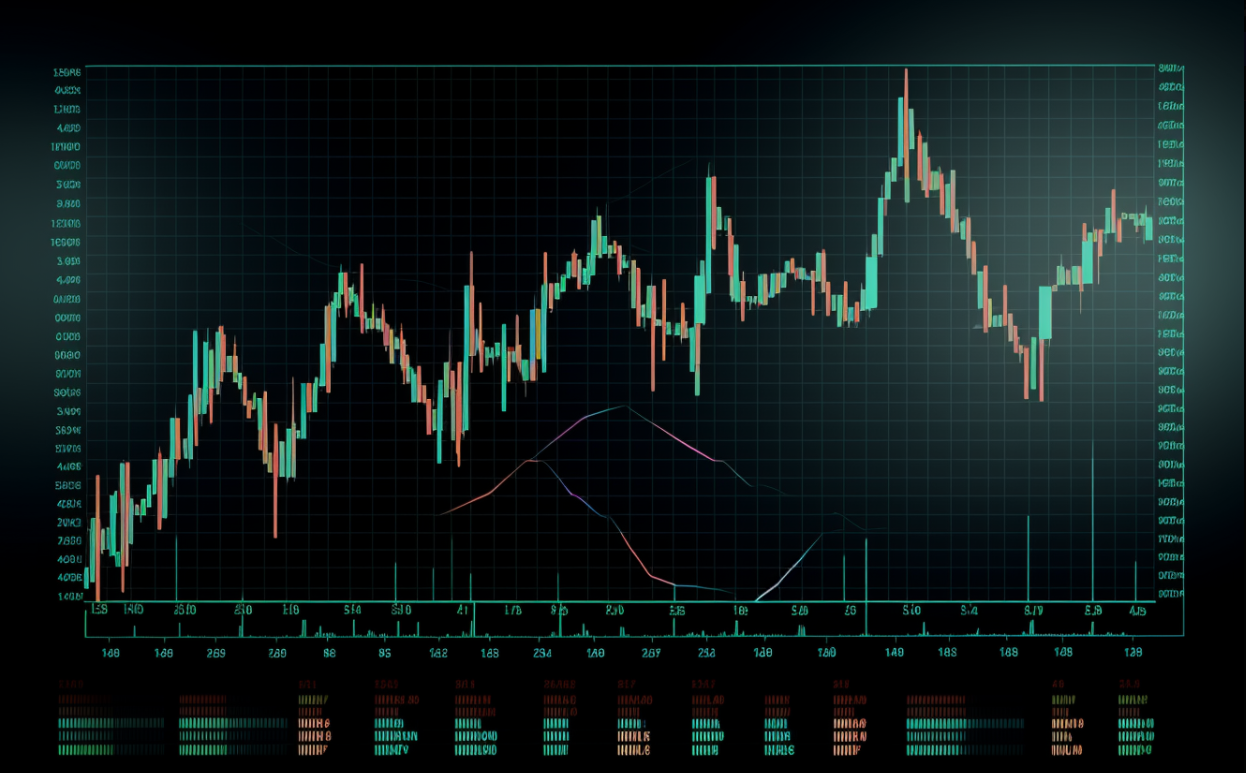
Japanese candlesticks are one of several types of charts, including line, bar, and Renko, used in the financial markets. Candlesticks are the most popular because they offer a more balanced way to study price action. The most popular trading platforms, including MetaTrader 5 and TradingView, offer candlestick charts because they allow traders to analyze price movements, trend reversals, and market sentiments.
Candlesticks help traders improve their technical analysis by forming predictive patterns. These patterns are based on opening, high, low, and closing (OHLC) prices and show where the following price action will occur. However, traders combine other tools with candlesticks to refine their trading strategies. However, make no mistake; learning to read candlesticks will improve your forex trading skills.
How Candlesticks Form
The forex market always has sellers and buyers at any point when it is open. Each candlestick shows the OHLC prices, representing the buying and selling dynamics at the instance. Candlesticks form for each trading activity and are organized based on timeframes for easier analysis. Each candle has three parts:
- Real Body: The body of a candle is the rectangular section showing the opening and closing prices and the range in between. Cancels with large bodies show strong selling or buying pressure, but smaller bodies show lower pressure or indecision.
- Wicks (Shadows): The wicks are single lines extending below and above the candle body. Wicks show the lowest and highest prices that the asset reached during the period.
- Color: Candles’ preset colors are usually red/black or green/white, indicating downward/falling pressure or upward/rising momentum, respectively. The colors allow traders to identify bearish and bullish candles and market trends at a glance.
Candlesticks form one after another and typically overlap as they form. If the price closes above the open price, the candle is bullish, but if it closes below the open, it is a bearish candle.
Types of Candlestick Patterns
As traders buy and sell currencies across exchanges, brokers, and OTC markets, candlesticks reflect their orders, volume, and momentum in real time. Each candlestick reflects the trading activity within a period (timeframe), from lower timeframes like 1-second, 30-second, 1-minute, 5-minute, and 10-minute to higher timeframes like 1-hour, 4-hour, daily, weekly, and yearly.
The lower the timeframe, the more candles. So, you’ll find sixty 1-minute candles on the 1-minute chart when you mark out the hourly candle. But as one candle forms after another, they create patterns that mirror traders’ sentiments and decisions. These patterns allow traders to predict price action with greater accuracy, due to the principle that price action repeats itself.
There are various candlestick patterns, categorized based on formation:
Liquidity Patterns
Liquidity is the ease of selling or buying an asset without significant price fluctuations. In the forex markets, liquidity revolves around key areas where prices reverse or continue in the same direction. Mastering liquidity patterns will help you to take better trades because the market moves only when liquidity is present or is the target.
On the charts, liquidity patterns are the obvious highs or lows on any timeframe. Traders target previous daily or weekly highs or lows as liquidity points. The logic behind this is that most traders use the concept of support (major lows) and resistance (major highs) areas to trade, buying and selling, respectively, when the price reaches those areas.
Reversal Patterns
When the price moves in a trend (direction), it gets to a point where the buyers or sellers gradually reduce their momentum until the price eventually reverses into the opposite trend. This is visible with candlestick patterns. There are many reversal patterns, but these are popular.
- Bullish Engulfing Pattern: Consists of two candlesticks: a small bearish candle and a larger bullish candle. This pattern indicates a potential reversal into a buy trend, since the selling pressure tapers off.
- Bearish Engulfing Pattern: This pattern has a smaller bullish candle engulfed by a larger bearish candle. It indicates a potential reversal into a sell trend.
- Bearish Evening Star: This three-candle pattern has a long bullish candle followed by a small-bodied candle and a strong, larger bearish candle. This pattern shows that buying pressure is waning, and the market may start selling.
- Bullish Morning Star: This pattern forms as a long bearish candle, followed by a small-bodied candle, and then a strong bullish candle. It indicates a potential reversal into an uptrend.
Other worth mentioning are the bullish/bearish harami pattern and the cross pattern.
Continuation Patterns
- Doji: A doji is a candlestick with a small body and long wicks. There are five types of dojis: common, long-legged, dragonfly, four-price, and gravestone. Dojis indicate indecision from traders and can suggest a potential continuation or reversal.
- Spinning Top: This pattern forms as one candle, similar to the doji. The difference is in the body. Spinning tops have larger bodies than doji.
How To Read Candlestick Patterns
Traders read candlesticks based on where and when they form. For example, a doji pattern usually indicates a trend continuation, but sometimes, it may indicate a reversal if a cluster of dojis appears. Candle patterns that appear in the middle or at the end of trends tend to have a greater impact than others.
The first step in reading a candlestick pattern is to identify the overall market trend on higher timeframes and then mark out the key levels. The next step is to find patterns in the lower timeframes in key areas like support and resistance, demand and supply zones, and gaps between candlesticks. Then, you can study the three highest or lowest candles at the key zone and the shape they form. Note that single candles like the doji may need more candlesticks to confirm the reversal or continuation.
Taking Better Trade Entries
Patience is key to finding better trades. You should always wait for the pattern to form with a confirmation. For example, if a bearish reversal occurs near a resistance level, you should wait for the price to retest the level before pulling back. Consider other tools like fundamental analysis and indicators for confirming signals from candlestick patterns.


Leave a Reply