
Anchored VWAP – Navigating Market Trends with Precision
The Anchored Volume Weighted Average Price (VWAP) stands as an innovative technical indicator that offers traders a nuanced perspective by amalgamating price data with volume information to present a more comprehensive market analysis. Unlike the standard VWAP, which typically starts calculations from the beginning of the trading day, the Anchored VWAP introduces the concept of ‘anchoring’. This technique allows traders to set the starting point (Timeframe) of the VWAP calculation to a specific event or time of their choosing – such as a major news release, earnings announcement, or a significant market high or low. By anchoring the VWAP, traders can gain insights into how price action has unfolded relative to a notable event, providing a tailored reference point that can inform trading decisions and strategies with greater context and relevance to current market conditions.
The Significance of Anchoring
Anchoring the Volume Weighted Average Price (VWAP) to specific events such as earnings reports, significant market highs/lows, or impactful news releases can offer traders profound insights into market sentiment and dynamics. This tailored approach allows traders to gauge the market’s reaction to these pivotal moments, providing a clear lens through which the subsequent price action can be evaluated.
Earnings Reports – Anchoring VWAP to the date of an earnings announcement can help traders understand investors’ response to the company’s financial health. A consistent deviation from the anchored VWAP post-earnings can indicate whether the market views the earnings as positive or negative, based on whether the price trends of currency pairs above or below the VWAP.
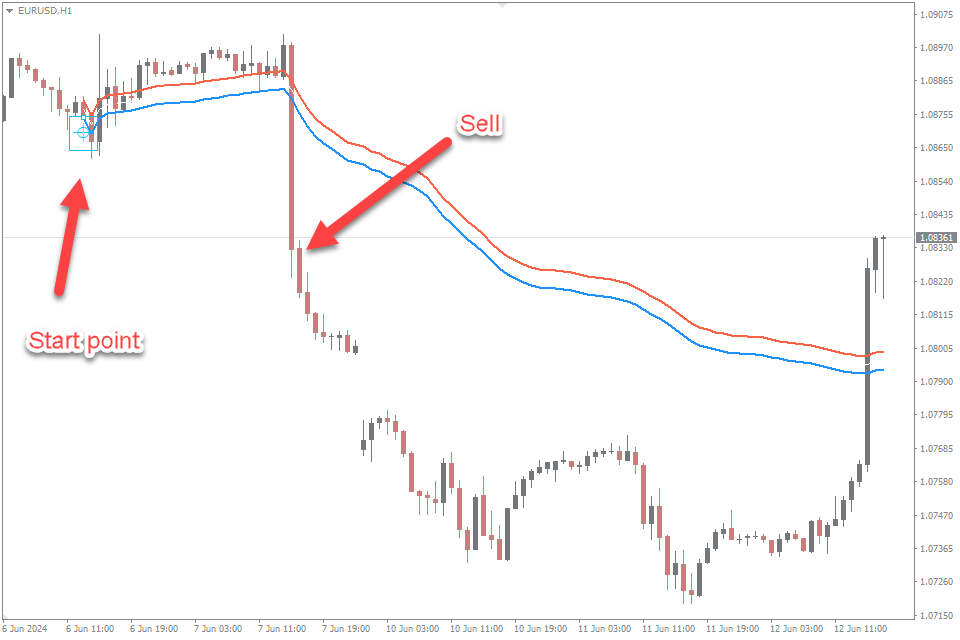
Significant Highs/Lows – By anchoring VWAP at points of significant highs or lows, traders can assess the strength of the trend following these critical levels. If prices remain above the VWAP after hitting a significant low, it may suggest accumulation and a potential reversal. Conversely, prices trending below the VWAP after a significant high might indicate distribution and a possible downtrend for short position.
Market News – News events can dramatically shift market sentiment. I constantly monitor the economic calendar, and the convenient free FXSSI indicator reminds me. It works great on Metatrader trading platform MT4/MT5.
Anchoring the VWAP to the time of a major news release provides insights into how the news has influenced trading behavior. The price’s relation to the anchored VWAP post-news can reveal whether the market perceives the event as bearish for sell or bullish for long position.
In essence, the Anchored VWAP serves as a benchmark to measure the market’s valuation of an asset since a notable event, offering a clearer understanding of market sentiment and direction.
Calculating the Anchored VWAP
The Anchored Volume Weighted Average Price (VWAP) is a trading benchmark that gives the average price a security has traded at throughout the day, based on both volume and price. The calculation for the Anchored VWAP starts from a specific point in time, known as the anchor point, rather than the beginning of the day, which is the case for the traditional VWAP.
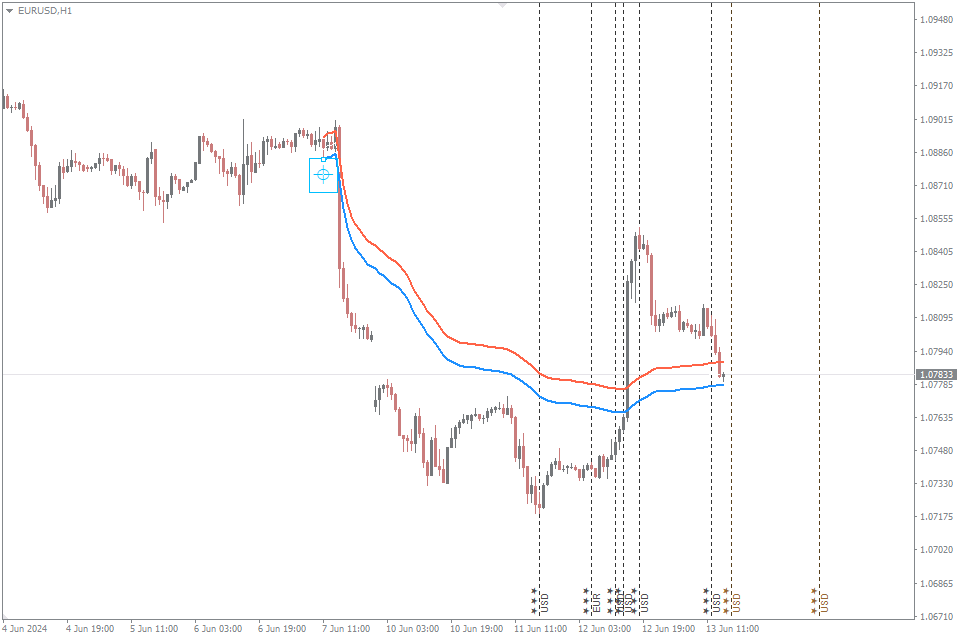
Selection of the Anchor Point: The anchor point is a critical component in calculating the Anchored VWAP. It is selected based on a significant event or time that the trader believes is relevant for their technical analysis. This could be a major news release, an earnings report, a significant high or low, or the start of a trading session. The key is to choose a point that reflects a change in market dynamics or sentiment.
Mathematical Formula: The formula for calculating the Anchored VWAP is as follows:
Anchored VWAP = Cumulative (Typical Price * Volume) / Cumulative Volume
The Anchored VWAP will change with each new period as more data is included in the calculation from the anchor point onwards. It is commonly plotted as a line on a chart, providing a dynamic level that adjusts with new price and volume data, reflecting the average price based on the volume since the anchor point. Traders use this line to make decisions about entries, exits, and the strength of the current price movement in relation to the average price since the anchor point.
Strategic Applications of Anchored VWAP
Anchoring the Volume Weighted Average Price (VWAP) to significant highs and lows in the market offers traders critical insights into market trends, potential reversals, and the strength of ongoing movements. Here are some of the key insight’s traders can gain:
Trend Confirmation: When the price remains above the VWAP anchored at a significant low, it suggests that the market is valuing the asset higher than at the point of the low, indicating a potential uptrend. Conversely, if the price stays below the VWAP anchored at a significant high, it may signal a downtrend, confirming the market’s bearish sentiment post the high.
Market Sentiment: Anchoring VWAP at these points allows traders to gauge the market’s sentiment towards an asset since reaching a significant high or low. A price consistently above the anchored VWAP suggests bullish sentiment, while a price below indicates bearish sentiment.
Volume-Weighted Support and Resistance: The anchored VWAP can act as a dynamic level of support or resistance. After a significant low, if the price approaches the anchored VWAP from above and bounces off, it indicates strong buying interest at that volume-weighted price level, serving as support. Similarly, after a significant high, if the price approaches the anchored VWAP from below and fails to break through, it acts as resistance, suggesting selling pressure.
Potential Reversals: A significant move away from the anchored VWAP could indicate overextension in the price movement, signaling a potential reversal. Traders can look for signs of price consolidating back towards the VWAP as an early indicator of a change in direction.
Validation of Breakouts or Breakdowns: By analyzing candlestick charts how the price interacts with the VWAP anchored at significant points, traders can validate the strength of breakouts or breakdowns. A strong breakout above the VWAP, following a significant low, can confirm the start of a new bullish phase, while a breakdown below the VWAP, after a significant high, can confirm bearish momentum.
This approach enables a deeper understanding of how significant highs and lows impact subsequent price action and market sentiment.
Combining Anchored VWAP with Other Indicators
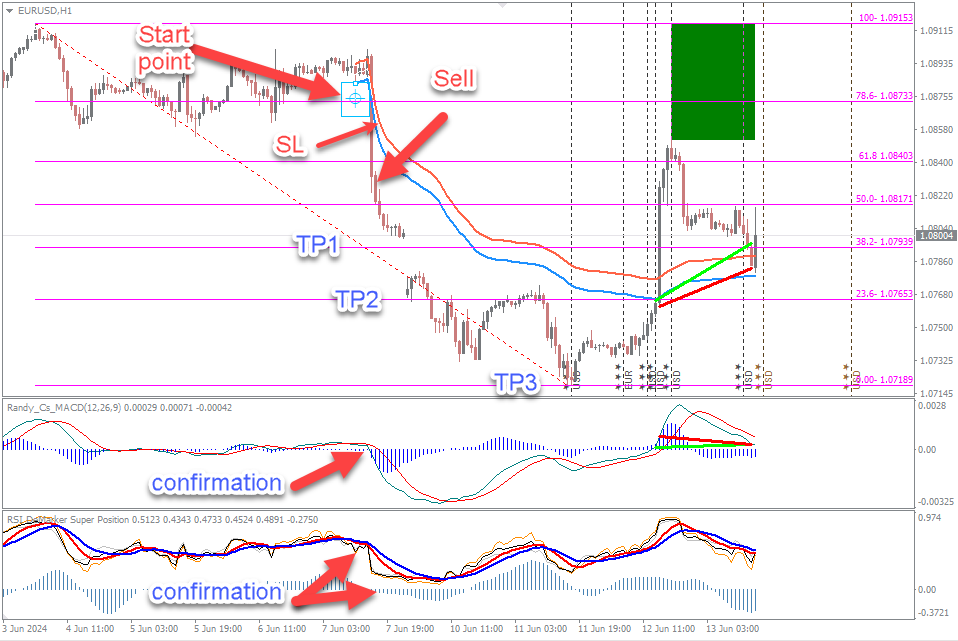
Integrating the Anchored VWAP with a suite of complementary technical indicators can significantly amplify the efficacy of trading strategies, offering a multidimensional view of market dynamics. By pairing the Anchored VWAP’s volume-weighted price insights with the trend-following precision of Moving Averages, traders can discern the strength and sustainability of market movements. The Relative Strength Index (RSI) serves as a perfect counterbalance, providing overbought or oversold signals that, when divergent from the Anchored VWAP trend, hint at potential reversals. The Moving Average Convergence Divergence (MACD) further enriches this analytical tapestry by identifying momentum shifts that corroborate or challenge the trend direction suggested by the Anchored VWAP. Bollinger Bands add a layer of volatility analysis, framing the price action around the Anchored VWAP and offering clues about market sentiment. Incorporating Fibonacci Retracement Levels offers strategic price points that, when aligned with the Anchored VWAP, reveal significant support or resistance zones. Lastly, the Stochastic Oscillator’s momentum cues can validate or question the trading signals derived from the Anchored VWAP’s path. This synergistic approach, using Anchored VWAP in combination with these indicators, creates a robust, detailed strategy for placing your stop-loss order and take-profit order, and gives you the ability to confidently and accurately navigate the Forex market, maximizing the potential for making informed and profitable trading decisions.
Limitations and Considerations
While the Anchored VWAP offers invaluable insights into market dynamics, traders must navigate its limitations and considerations to fully harness its potential. Primarily, the Anchored VWAP’s effectiveness hinges on the subjective selection of the anchor point, a decision that can significantly influence the indicator’s relevance and outcomes. This subjectivity underscores the importance of a strategic approach in choosing meaningful events or moments as anchor points.
Additionally, the Anchored VWAP may not fully capture the spectrum of market sentiment under certain conditions, particularly in highly volatile markets and thinly traded or illiquid conditions.
High Volatility: In extremely volatile markets, price swings can be sudden and significant, often driven by news events or market panic rather than underlying volume. In such scenarios, the Anchored VWAP might lag behind the rapid price changes, providing a less accurate reflection of the current market sentiment.
Thinly Traded or Illiquid Conditions: In markets or assets with low trading volume, the Anchored VWAP may not be as reliable. The lack of volume means that a few trades can disproportionately affect the price charts, making the VWAP less representative of the true market sentiment. This is often the case in smaller stock markets, certain hours of Forex trading, or with less popular cryptocurrencies.
Gaps in Trading: Markets that experience gaps in trading, such as stocks or currency pairs that gap up or down at the open, can also challenge the Anchored VWAP’s effectiveness. The gap can cause a sudden shift in price that isn’t immediately reflected in the volume-weighted average, potentially misleading traders about the prevailing sentiment.
Understanding these limitations is crucial for traders relying on the Anchored VWAP, as it emphasizes the need for a comprehensive approach to market analysis, fundamental analysis and other indicators and tools to gain a more complete view of market sentiment.
Conclusion
In conclusion, the Anchored VWAP stands as a cornerstone technical indicator within a comprehensive for swing trading, day trading or scalping strategies, offering traders a nuanced lens through which to view market dynamics. Its ability to merge price and volume data from a specific, significant starting point provides a unique perspective on market sentiment and price trends since that moment. This insight is invaluable for identifying potential support and resistance levels, validating trend directions, and enhancing the precision of entry and exit points. However, mastering the Anchored VWAP requires more than just understanding its calculation and application; it demands a strategic selection of anchor points, a practice honed through experience and a deep understanding of market events and their impacts. When used in conjunction with other technical indicators, the Anchored VWAP becomes an even more powerful tool, enabling traders to cross-verify signals and build a robust, multi-faceted trading approach. Ultimately, the effectiveness of the Anchored VWAP in a trader’s arsenal is amplified by continuous learning, practice, and the integration of comprehensive market analysis.


Comment (1)
Good post!