Recommended Brokers
Recommended Prop Firms
Recent Posts

How to Make Better Trade Entries With Candlestick Patterns
Why Candlesticks are Crucial for Better Trade Entries Japanese candlesticks are one...
Read More
Sunny Mining Automated Mining Contracts: Unlock $3,995 in Daily Cryptocurrency Passive Income
As the cryptocurrency market continues to fluctuate and institutional capital continues...
Read More
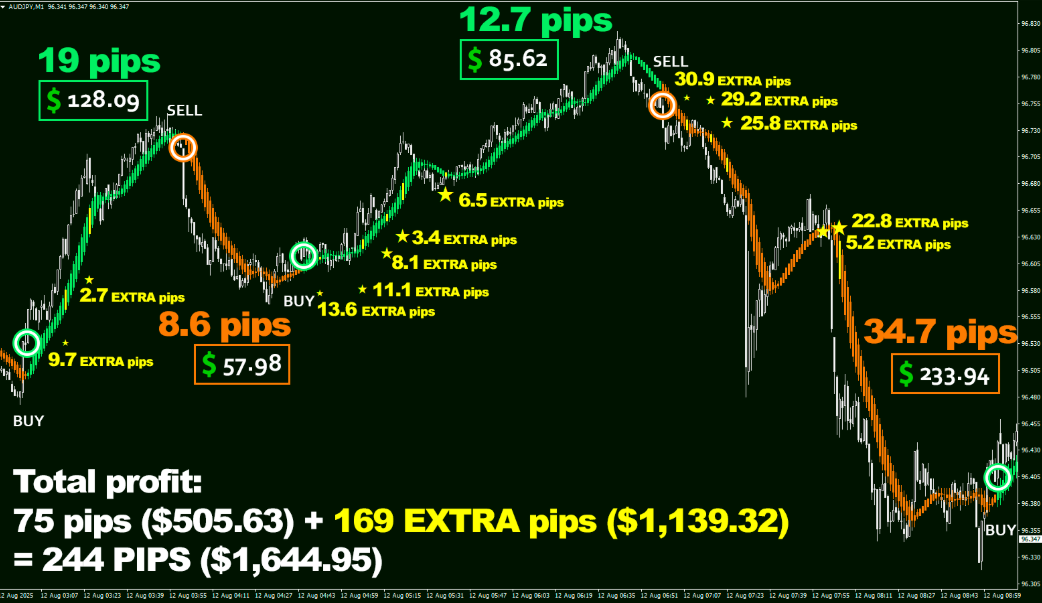
Meet Eagle Scalper — a game-changing Forex indicator
Meet Eagle Scalper — a game-changing Forex indicator engineered for unmatched...
Read More
Make $3,000 a day, XY Miners cloud mining becomes the best investment option in 2025
As the crypto market matures in 2025, smart investors are shifting...
Read More
Is OctaFX, Now Known as Octa, Legal in India? What Traders Ought to Know in 2025
Online trading platforms have emerged to prominence over the past decade...
Read More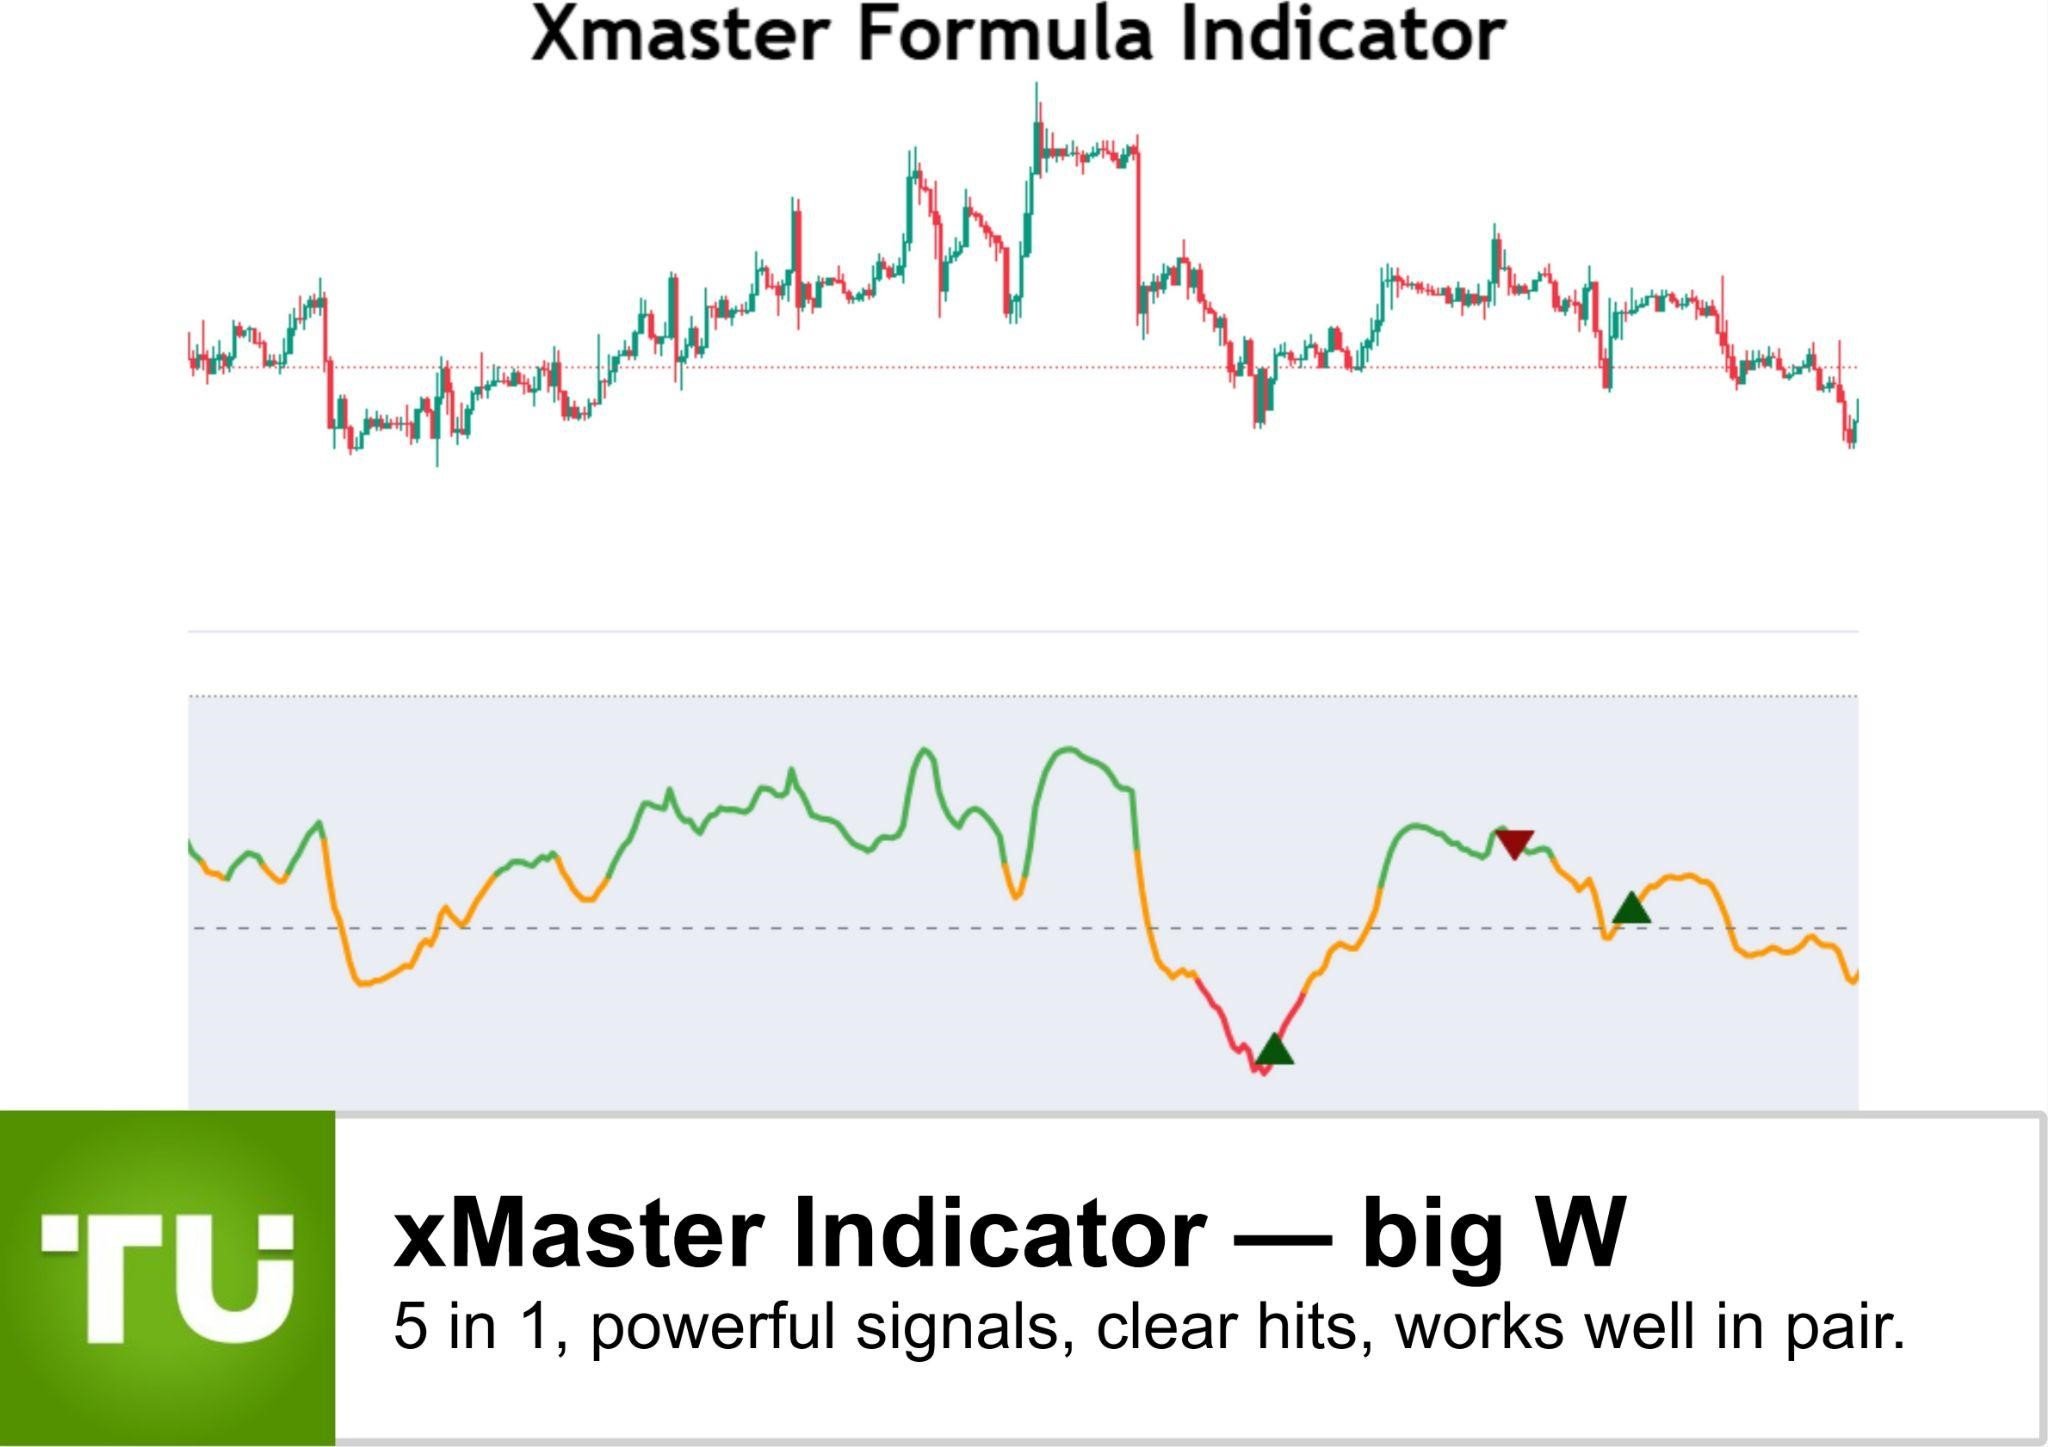
xMaster Review — good, old, reliable, makes sense
Say, you don’t want to overpay for TradingView Pro yet, but...
Read More
Exploring a Leading Forex Broker: A Detailed Review of Fxcess
In the competitive world of forex trading, selecting a reliable broker...
Read More
Scalping vs Swing Trading: Which Strategy Suits You Best?
ByAlexFX
Navigating the world of trading can be daunting, especially when choosing...
Read More
Day Trading vs Swing Trading – Choosing the Right Style
ByAlexFX
In the dynamic world of financial markets, adopting a trading style...
Read More
Anchored VWAP – Navigating Market Trends with Precision
ByAlexFX
The Anchored Volume Weighted Average Price (VWAP) stands as an innovative...
Read More
Smart Money Concept – Best Strategy of Modern Traders
ByAlexFX
In the intricate world of investing, the 'Smart Money Concept' stands...
Read More
Exploring the Most Trendy Currency Pairs of the Year
ByAlexFX
In the Forex market, the concept of 'trend' is a fundamental...
Read More
Mastering Momentum – Optimal Settings for the Stochastic Oscillator
ByAlexFX
The Stochastic Oscillator stands as a cornerstone in the toolkit of...
Read More
Profit from the Pause – Advanced Gap Trading Strategies Uncovered
ByAlexFX
Gap trading, a strategy that capitalizes on price gaps occurring between...
Read More
The Inside Bar Strategy Simplified
ByAlexFX
The Inside Bar strategy is a powerful technical analysis tool used...
Read More
Most Liquid Forex Currency Pairs
ByAlexFX
The Forex market, a global arena for currency trading, is renowned...
Read More
Most Popular Lagging Indicators
ByAlexFX
In the vast and ever-evolving landscape of forex trading, mastering the...
Read More
TOP List of Currency Pairs with High Volatility
ByAlexFX
In the fast-paced realm of forex trading, volatility is often seen...
Read More
10 Best Indicators for Gold Trading
ByAlexFX
Gold has long been revered as a symbol of wealth and...
Read More
7 Best Indicators for Crypto Trading
ByAlexFX
In the dynamic realm of cryptocurrency trading, success hinges not only...
Read More


