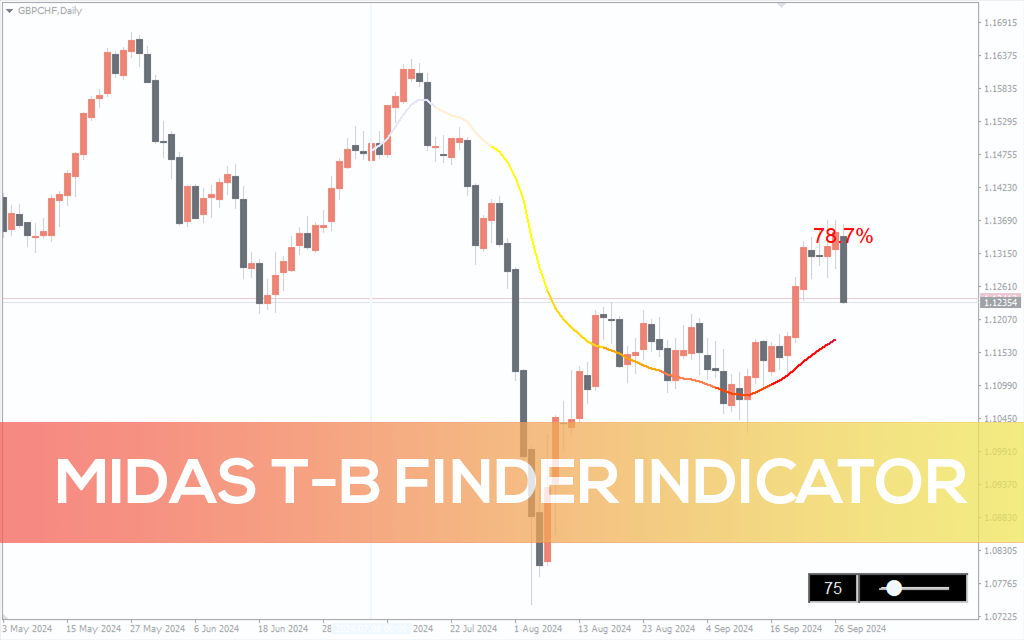
MIDAS T-B Finder Indicator
The MIDAS T-B Finder Indicator for MT4 helps traders identify key market tops and bottoms by analyzing volume, allowing for optimized trade entries and exits.
Trader, Forex Writer
I am 5+ years experienced FOREX trader and 3 years+ experienced MT4 EA coder. I have coded 200+ EAs for my clients around the world and it’s my passion also. While having this experience, I also got a chance to work for a leading broker
The MIDAS T-B Finder Indicator for MT4 helps traders identify key market tops and bottoms by analyzing volume, allowing for optimized trade entries and exits.
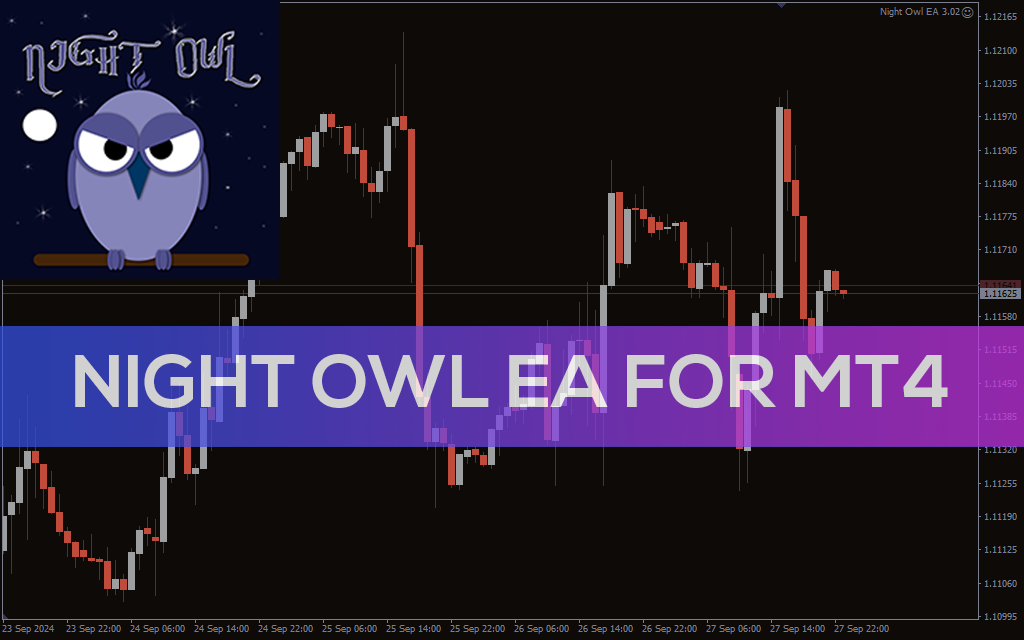
Night Owl EA 3.02 automates forex trading during low volatility sessions, capturing short-term profits while minimizing risks on MT4.
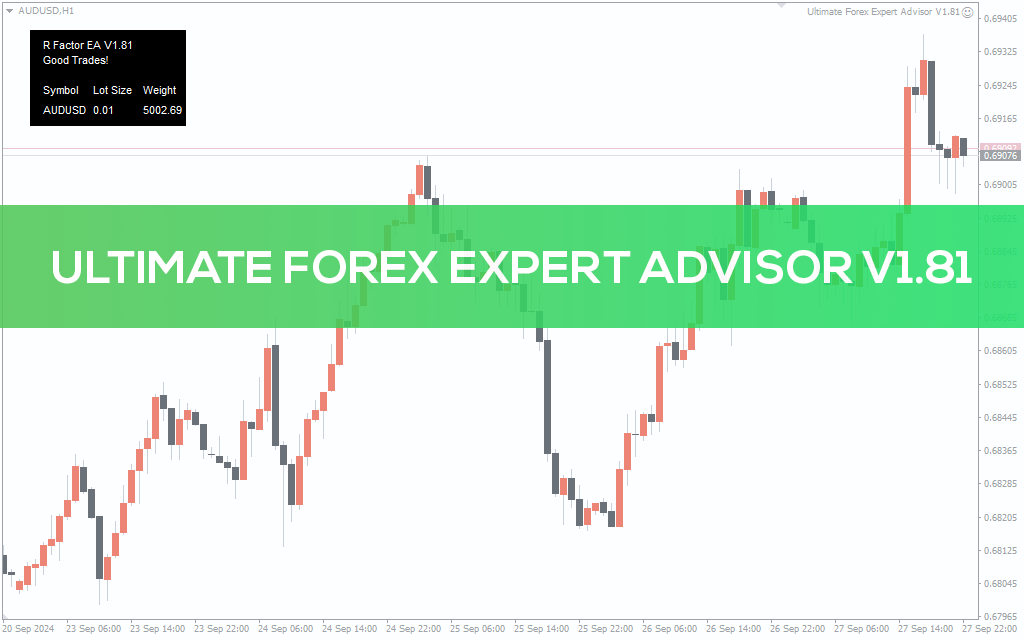
Ultimate Forex Expert Advisor V1.81 automates forex trading on MT4 with dynamic strategies for optimal results across various market conditions.
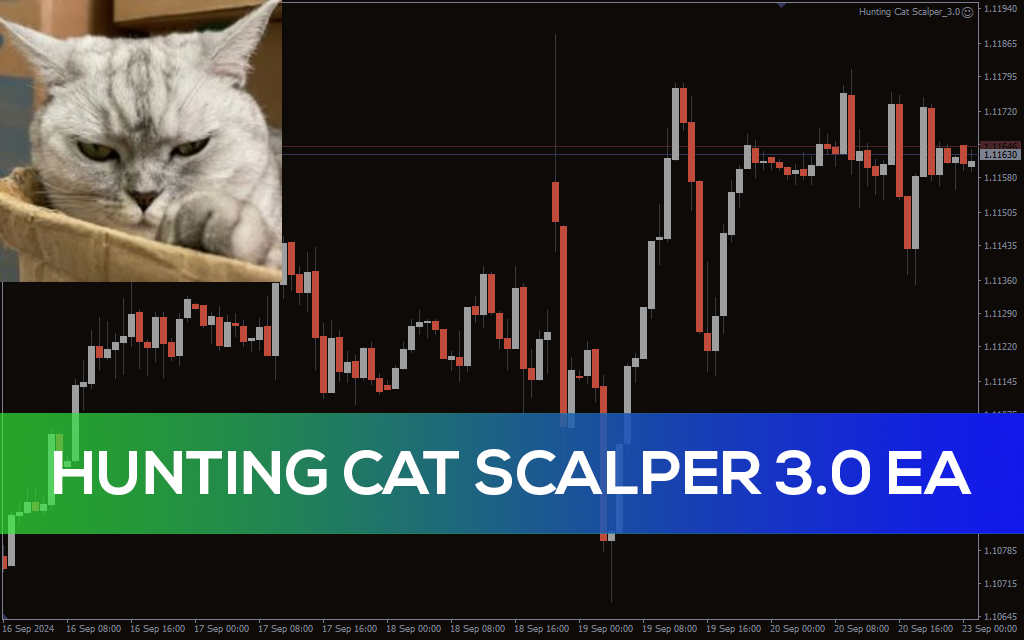
Hunting Cat Scalper 3.0 EA for MT4 is designed for accurate, high-frequency scalping, capturing profits in short-term market fluctuations.
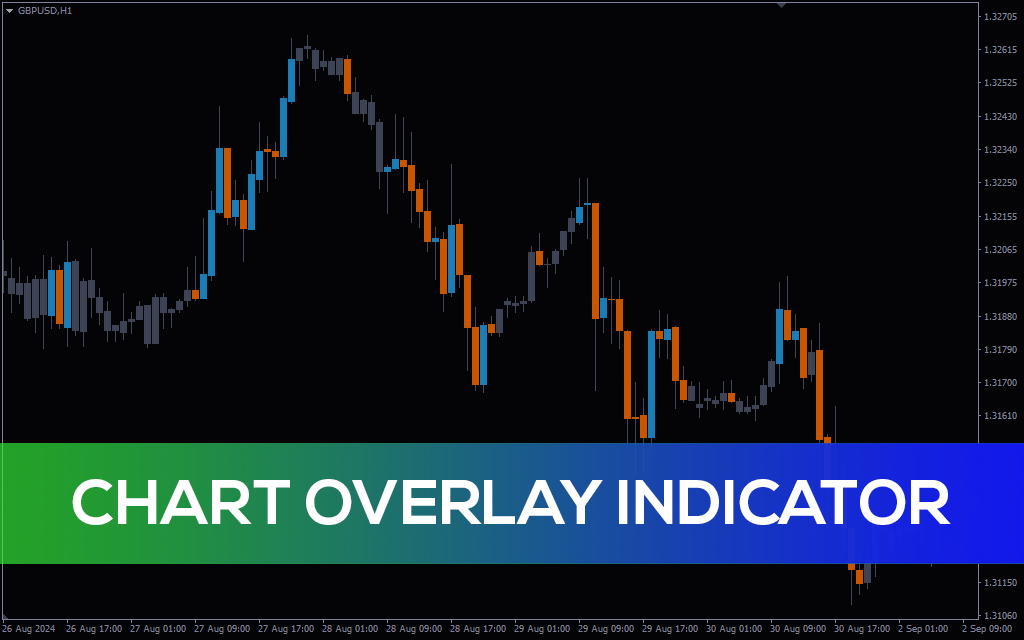
The Chart Overlay Indicator for MT4 enhances visual representation of candlesticks by using customized themes, making it easier for traders to identify market trends.

Twin Range Filter Indicator For MT4 helps traders spot trend reversals by using dual range filters to generate accurate buy and sell signals.
Binary Arrow Indicator For MT4 provides traders with clear buy and sell signals based on a combination of moving averages and RSI, helping optimize entry and exit points.
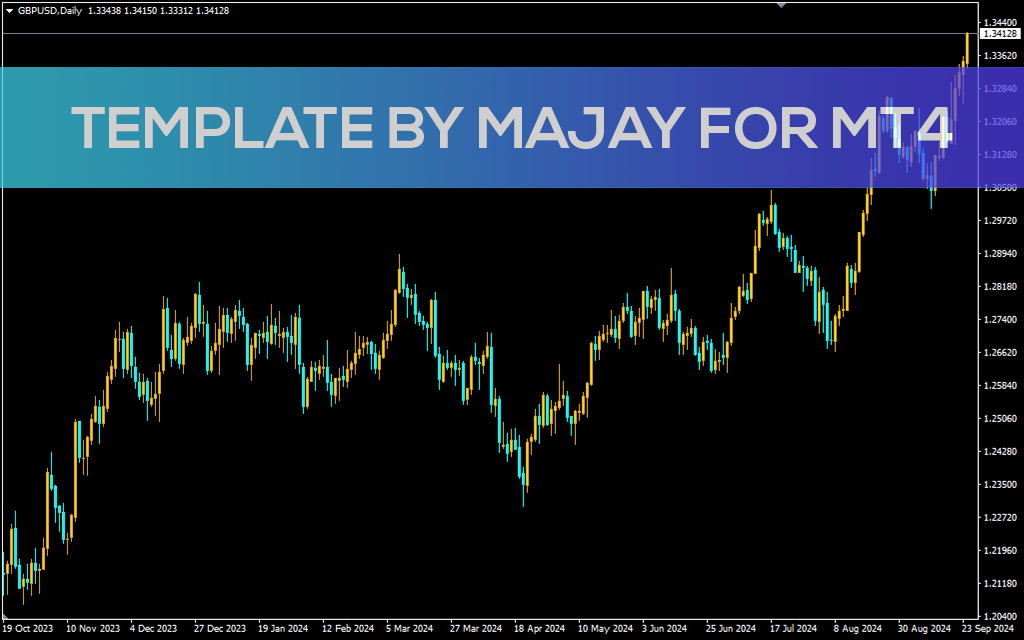
Download the Template by Majay for MT4, a unique design that improves chart readability and provides clear visual cues for market analysis. Enhance your trading with this customizable and visually appealing MT4 template. Available for free download.
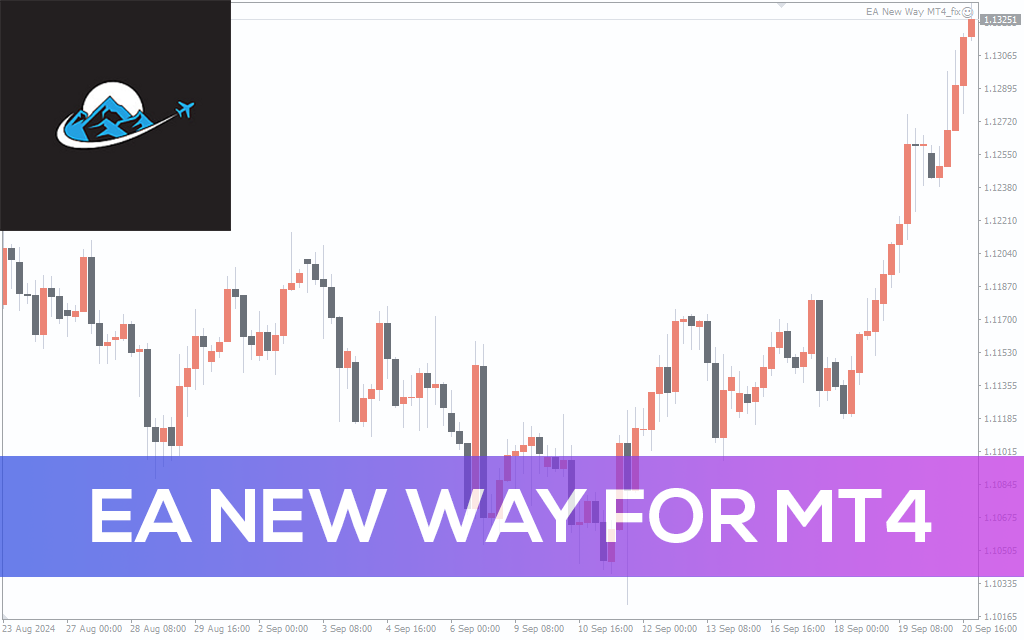
EA New Way for MT4 combines innovative strategies with adaptive risk management to deliver consistent trading results in changing market conditions.
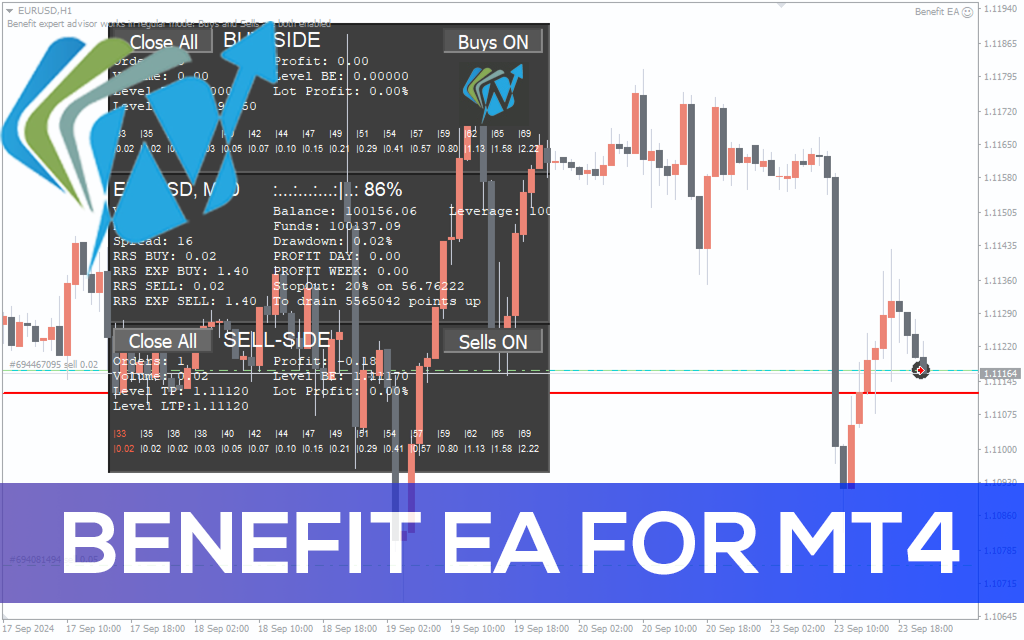
Benefit EA for MT4 automates trading on major currency pairs using adaptive strategies that suit both trending and range-bound markets.