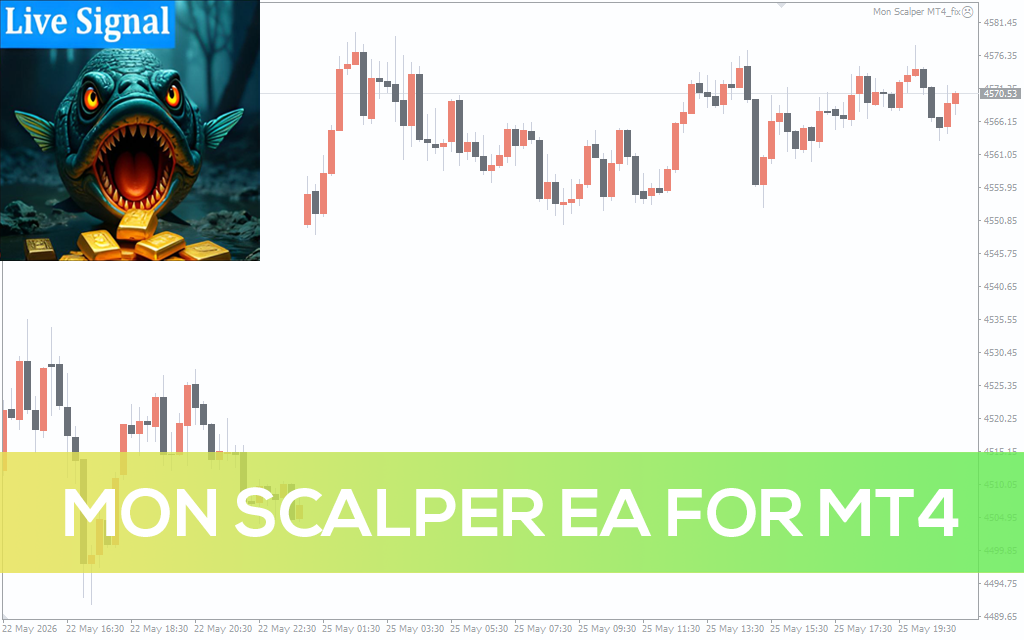
Mon Scalper EA MT4
Mon Scalper EA for MT4 is a Gold trading robot featuring support and resistance entries, automatic trailing stop management, and trend filtering.
Trader, Forex Writer
I am 5+ years experienced FOREX trader and 3 years+ experienced MT4 EA coder. I have coded 200+ EAs for my clients around the world and it’s my passion also. While having this experience, I also got a chance to work for a leading broker
Mon Scalper EA for MT4 is a Gold trading robot featuring support and resistance entries, automatic trailing stop management, and trend filtering.
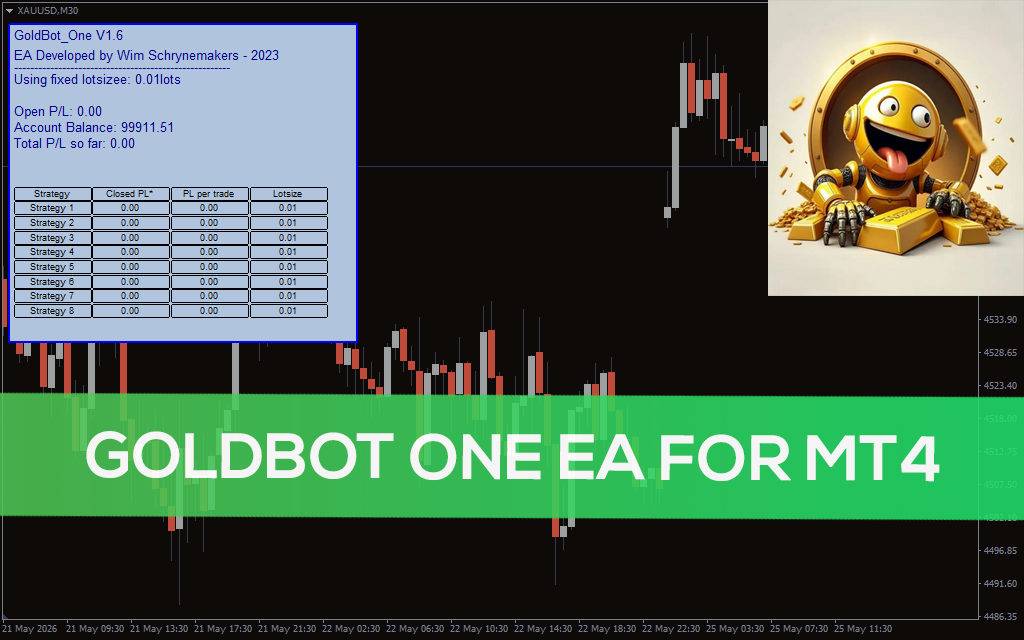
Goldbot One EA for MT4 combines multiple trading strategies, NFP protection, breakout filters, and prop firm settings for automated XAUUSD trading.
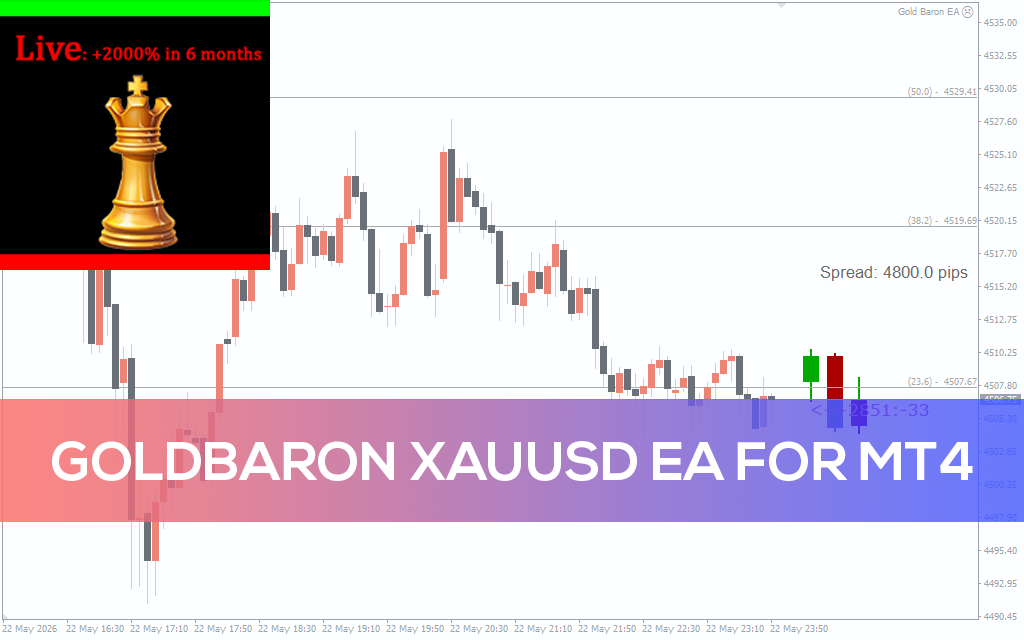
Download GoldBaron XAUUSD EA for MT4, an automated Gold trading robot with scalping logic, dynamic risk management, and breakeven protection.
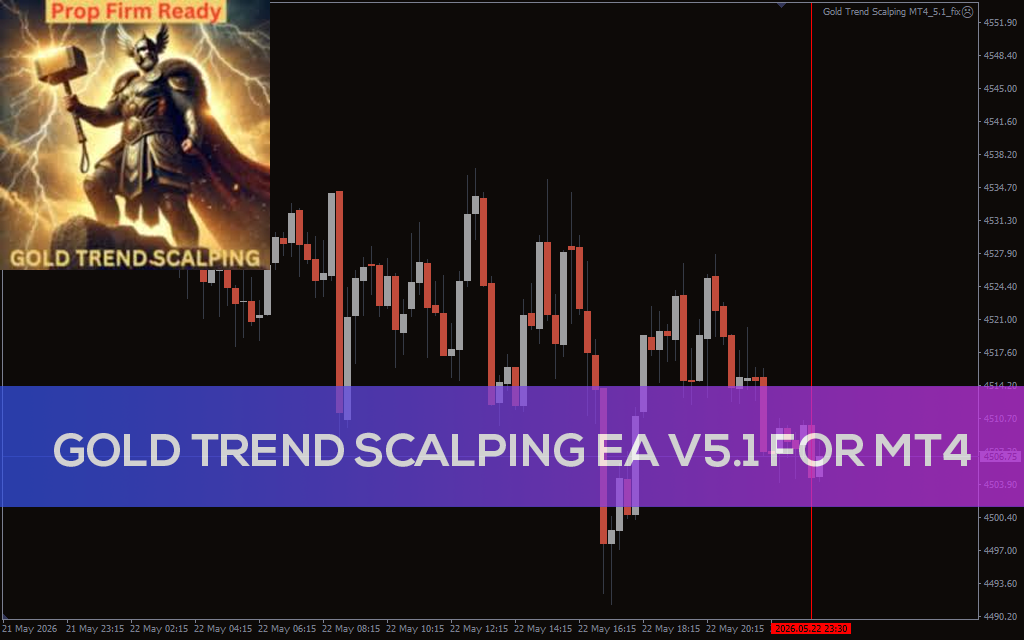
Download Gold Trend Scalping EA V5.1 for MT4, a Gold trading robot for XAUUSD with trend entries, trailing stop management, and risk control settings.
Built for active Gold sessions, Gold Pulse EA MT4 combines news filtering, recovery tools, and market protection features.
Download Gold Emperor EA V1.6 MT4, an automated XAUUSD Expert Advisor for MetaTrader 4 with trend analysis, trailing stop management, and dynamic risk settings.
Explore Daytrade Pro Algo EA v3.30 MT4, a prop firm ready trading system built for multi-pair execution and funded account management.
FX HFT Mega LLC EA V14.70 MT4 a high-frequency trading EA for MetaTrader 4 featuring ultra-fast execution logic, risk management, and low drawdown performance.
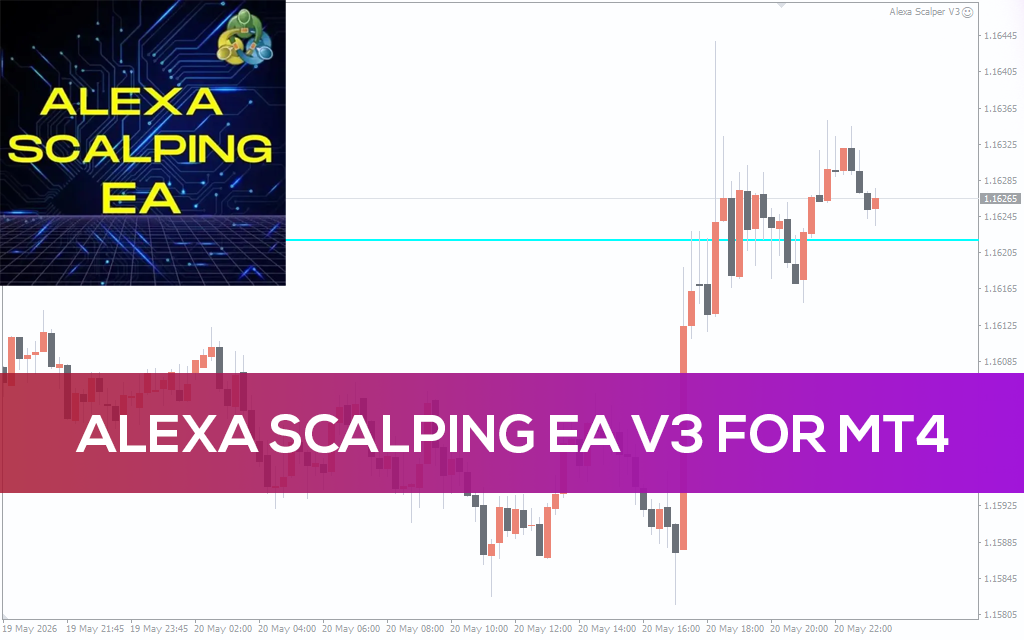
Designed for short-term trading, Alexa Scalping EA V3 MT4 combines fast entries, trailing logic, and simplified risk management.
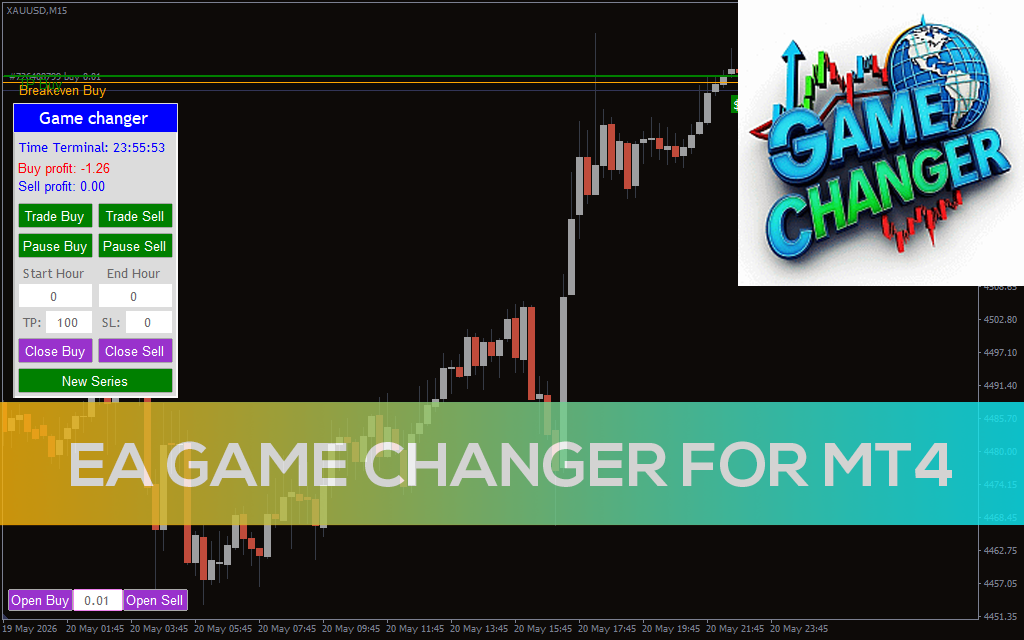
EA Game Changer MT4 delivers Gold basket trading with hedge recovery logic and adaptive order management.